Abstract
Somatostatin receptors (SSTRs) are highly expressed in well-differentiated neuroendocrine tumors (NET). Octreotide, an SSTR agonist, has been used to suppress the production of vasoactive hormones and relieve symptoms of hormone hypersecretion with functional NETs. In a clinical trial, an empiric dose of octreotide treatment prolonged time to tumor progression in patients with small bowel neuroendocrine (carcinoid) tumors, irrespective of symptom status. However, there has yet to be a dose optimization study across the patient population, and methods are lacking currently to optimize dosing of octreotide therapy on an individual basis. Multiple factors such as total tumor burden, receptor expression levels, and non-target organ metabolism/excretion may contribute to a variation in SSTR octreotide occupancy with a given dose among different patients. In this study, we report the development of an imaging method to measure surface SSTR expression and occupancy level using the PET radiotracer 68Ga-DOTATOC. In an animal model, SSTR occupancy by octreotide was assessed quantitatively with 68Ga-DOTATOC PET, with the finding that increased occupancy resulted in decreased tumor proliferation rate. The results suggested that quantitative SSTR imaging during octreotide therapy has the potential to determine the fractional receptor occupancy in NETs, thereby allowing octreotide dosing to be optimized readily in individual patients. Clinical trials validating this approach are warranted.
Keywords: Positron emission tomography, Neuroendocrine tumors, Receptor quantitation, Somatostatin receptor, Multiparameter imaging
Introduction
Neuroendocrine tumors (NETs) are a heterogeneous group of malignancies that are thought to originate from endocrine progenitor cells located in various organ systems, including the lung, pancreas, and gastrointestinal tract. Very commonly, these NETs secrete a variety of biologically active peptides and amines that can lead to symptoms of wheezing, nausea, abdominal pain, flushing and diarrhea, among others (1). Somatostatin receptor (SSTR) agonists have been employed with great success for controlling these symptoms (1, 2). With 80-100% of well-differentiated NETs expressing high levels of SSTR (3), somatostatin analogs, such as octreotide, have become the treatment of choice for symptomatic relief through the reduction of NET hormone production.
Over the past several years it has further been demonstrated that SSTR agonists may also have an anti-proliferative effect on NETs (4, 5) and may have a role as anti-neoplastic therapy for NETs. It was shown in a double-blind randomized controlled trial that patients with metastatic well-differentiated mid-gut NETs who received monthly intramuscular injections of a standard dose (30 mg) of long-acting octreotide (octreotide LAR) had a significantly increased progression-free survival (PFS) compared to those who received placebo (15.6 versus 5.9 months, respectively) (6). The patients in this study benefited from octreotide LAR therapy regardless of tumor functional status. The results of this trial suggest that octreotide may possess anti-proliferative properties on NETs that are enacted through SSTR-mediated signaling, irrespective of activation of pathways involved in bioactive peptide and amine production. This paradigm shift in the use of SSTR agonists for their anti-tumor effects has been empiric in nature, without an understanding of what fraction of the somatostatin receptors were bound during agonist therapy, how this changed over the course of a monthly treatment cycle, and the association with proliferation. The development of a non-invasive approach to quantify the concentration of SSTR in tumors, the change in free receptor fraction with therapy, and the resultant downstream effects on proliferation would provide a method to optimize this treatment, both at the individual level and across treatment populations.
Radionuclide imaging of SSTR through 111In-octreotide or 68Ga–DOTATOC has largely been qualitative in nature, using the high contrast gained from the images to locate foci of disease not apparent on other imaging modalities, or to monitor disease progression by the assessment of tumor volume changes over time (7-9). In fact, tumor imaging with these agents is typically performed either for primary staging prior to initiation of octreotide LAR therapy or monitoring of disease progression during the expected nadir blood levels of octreotide LAR to aid in tumor visualization (10, 11). The objective in this study was to utilize the quantitative nature of 68Ga–DOTATOC PET imaging to develop a technique that allows one to compute the receptor density in a tumor volume and monitor the fraction that is occupied with agonist treatment at a given time, based on changes in the available (unbound) receptor density. In combination with another positron-emitting radiotracer, 18F-Fluoro-3′-deoxy-3′-L-fluorothymidine (18F-FLT), a proliferation marker (12), we were able to correlate the changes in unoccupied SSTR with proliferation status in an animal model. The imaging techniques and quantitation methods thus developed have the potential to be readily translated to patients with neuroendocrine tumors to more effectively monitor treatment and improve dosing regimens.
Materials and Methods
Cell Culture
AR42J (ATCC, Manassas, VA), an STTR expressing rat pancreatic carcinoma, was cultured in F-12K medium (ATCC), supplemented by 20% (v/v) fetal bovine serum (FBS), 100 U/mL penicillin, and 100 μg/mL streptomycin. A549 (ATCC, Manassas, VA), an SSTR-negative human alveolar basal epithelial carcinoma cell line, was cultured in F-12K medium (ATCC), supplemented by 10% (v/v) FBS, 100 U/mL penicillin, and 100 μg/mL streptomycin. Cultures were maintained in a humidified incubator at 37°C, 5% CO2. Subculturing was performed employing a 0.25% trypsin-0.1% EDTA solution. The cell lines were obtained from ATCC, and were used in this study for less than 6 months after resuscitation. Cell lines undergo comprehensive quality control and authentication procedures by ATCC prior to shipment. These include testing for mycoplasma by culture isolation, Hoechst DNA staining and PCR, together with culture testing for contaminant bacteria, yeast and fungi. Authentication procedures used include species verification by DNA barcoding and identity verification by DNA profiling.
68Ga Labeling of DOTATOC
A 68Ge/68Ga generator (iThemba Labs, South Africa) was eluted with 6ml of 0.6N HCl. The eluant was added to a buffer system of 2M HEPES at pH 3.5-4.0 with 5μg of DOTATOC. The reaction solution was heated at 100°C for 20 min. The reaction product was loaded on a reverse-phase C18 Sep-Pak mini cartridge and eluted with 200μl of 200-proof ethanol. The final formulation was adjusted to 10% ethanol in saline. The chemical and radiochemical purity of 68Ga-DOTATOC was measured through radio thin-layer chromatography (TLC) (13, 14).
Competitive binding study
To evaluate the specific binding of 68Ga-DOTATOC, a competitive binding assay using a fixed concentration of radiotracer and increasing concentration of octreotide acetate was performed. AR42J (SSTR-2 expressing), and A549 (SSTR negative) cells were seeded in 24 well plates (2.5×10⁵/well) and allowed to grow to 80% confluence. Wells were incubated for one hour with 0.01 to 1000 μM concentration of octreotide acetate (Abbiotec, San Diego, CA). Then 25μCi 68Ga-DOTATOC (∼9.5 nM DOTATOC peptide) was added to each well and plates were incubated at 37 °C for one hour. The medium was removed and wells were washed 3 times using 4 °C phosphate-buffered saline (PBS). Cells were collected after trypsin treatment and the number of cells in each well was counted using an automated cell counter (Countess®, Invtrogen, NY, USA). 68Ga activity in the cells in each well was assayed using an automated gamma counter (Wizard 2480, Perkin Elmer, MA, USA) and decay corrected for the beginning of incubation with 68Ga-DOTATOC.
In-vitro cell cycle assay
To assess the effect of octreotide on cell cycle progression, AR42J and A549 were seeded in 6-well plates and incubated at 37°C for 24 h (A549) or 2 days (AR42J) in cell-culture medium. The medium was then removed and fresh medium was added to each well. Wells were randomized to receive octreotide acetate at a concentration of 1 μM or no octreotide acetate and all wells were incubated at 37°C for 24 h prior to the addition of EdU (5-ethynyl-2′-deoxyuridine) (Click-it EDU kit, Invitrogen, CA, USA), a fluorescent DNA analog that is incorporated during DNA synthesis. Treated cells were then sorted for cell-cycle phase using fluorescence-activated cell sorting (FACS) and the percentage of the cells in S-phase determined in octreotide treated versus non-treated groups for each cell-line. Studies were performed in triplicate.
Western blotting for SSTR-2 expression
Nude (nu/nu) mice were injected subcutaneously with 106 AR42J cells suspended in Matrigel (BD Biosciences, Franklin Lakes, NJ USA) in the left upper flank. After PET imaging, AR42J tumors were removed and extracted and whole protein extract purification performed. Protein samples (30 μg) were loaded onto SDS-polyacrylamide gels and run at 120 V and 14 mA for 1.5 h. Gels were blotted on polyvinylidene difluoride (PVDF) membrane and the blots incubated overnight at 4°C with SSTR-2 monoclonal antibody (Abcam, UK) at 1/500 dilution. Beta-actin monoclonal antibody (Santa Cruz, USA) at 1/1000 dilution was used as an internal control. Detection was performed using the BM Chemiluminescence Western Blotting Kit (Mouse/Rabbit) (Roche, Germany) and imaged on the Carestream In-Vivo Multispectral FX imaging system (NY, USA). Quantitation of SSTR-2 and beta-actin expression was performed by drawing a region of interest around the protein bands on chemiluminescence images acquired with the Carestream Molecular Imaging Software. The acquired data was normalized using beta-actin expression and corrected for tumor weight.
In vivo imaging studies
AR42J bearing mice were divided randomly in four groups (n=3 in each group) that received vehicle, 1.25, 2.5, or 10 mg/kg octreotide acetate, delivered via intraperitoneal injection every 6h for a total of five injections in order to reach steady state blood levels. Five hours following injection of the fifth dose (trough blood level of octreotide acetate) the mice underwent dynamic PET imaging with 68Ga-DOTATOC. Immediately following, the mice were imaged in static mode and then a sixth dose of octreotide was administered. Five hours after receiving the last dose of treatment solution the mice were imaged using 18F-FLT PET in static mode.
Static PET imaging protocol
Approximately 400μCi of 68Ga-DOTATOC prepared as described above and diluted into a final volume of 150-200 μL that was injected intravenously via tail vein, and 1h later static PET images were acquired for 15 min in 2 bed positions using the Sedecal Argus microPET. Static PET imaging with 18F-FLT was performed 2 h after intravenous injection of 400μCi 18F-FLT. Images were reconstructed using 2D-OSEM (4 iterations, 16 subsets) and were corrected for scatter and randoms. The mean standard uptake value (SUVmean) for each tumor was calculated in a 3D region of interest autodrawn around the tumor using a 30% isocontour threshold.
Dynamic PET imaging protocol and compartmental modeling
Mice were placed under anesthesia with 2% isoflurane in O2 and positioned on the scanner such that heart and tumor were both in the field of view. Dynamic PET data were acquired in list mode for 60 minutes beginning immediately prior to injection of 400μCi 68Ga-DOTATOC in 150-200 μL of volume via tail vein. The list mode data were then reframed in 40 fifteen-second, 20 thirty-second, 16 sixty-second, and 16 ninety-second frames. Scans were reconstructed and a 3D region of interest was set around the tumor, as described above. The input function was measured from a spherical region of interest with a 3 mm diameter over the center of the mouse heart. Time activity curves were plotted for tumor and blood pool. To determine the best compartmental model fit for 68Ga-DOTATOC binding, an octreotide challenge study was performed during a dynamic 68Ga-DOTATOC PET study in AR42J bearing mice. The octreotide dose (150 μg) was injected via tail vein 10 minutes after the scan start and the administration of 68Ga-DOTATOC.
Ki-67 staining
To determine tumor cell proliferation changes in response to octreotide therapy in vivo, Ki-67 staining was performed. Tumor samples from AR42J tumor bearing mice from the different treatment groups described above were excised and kept in frozen-tissue-embedding fixative (Fisher Scientific, Hampton, NH) at −80° C for further immunofluorescent staining. Briefly, slide-mounted 5-micron-thick sections were prepared and fixed using ice-cold acetone for 10 minutes followed by 3× wash with PBS (5 minutes each). Tissue sections were blocked for 30 minutes with 1% bovine serum albumin (BSA) in PBS with tween, washed with PBS and incubated overnight at +4° C with Ki-67 antibody (Abcam, Cambridge, UK). The slides were washed again with PBS, mounted with mounting medium for fluorescence-containing DAPI (Vector Laboratories, Burlingame, CA) and visualized by confocal fluorescent microscopy (Nikon, Tokyo, Japan). Ki-67-stained and -unstained cells in the resulting images were segmented using ImageJ software and the percentage of cells stained for Ki-67 was determined.
Statistical analysis
The statistical analysis was performed using Graphpad Prism 5. Unpaired t-test was used to compare the number of cells in S-phase in control and treatment groups. One-way ANOVA was employed to discern the differences in SUVmean and Ki among different treatment groups in mice. Tukey's multiple comparison test was used to compare the significance between groups. The 68Ga-DOTATOC influx rate and SUVmean were plotted against 18F-FLT SUVmean and correlation between the measurements was determined using linear regression. A p<0.05 was considered statistically significant. Mean values are reported +/- standard error of the mean (+/- SEM).
Results
Competitive binding and in-vitro cell cycle assays
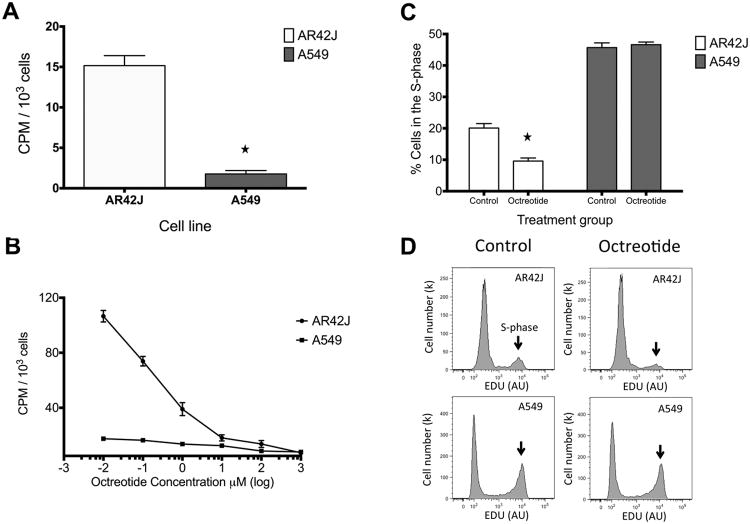
68Ga-DOTATOC demonstrated 8.6 fold greater binding to AR42J compared to A549 cells (p < 0.0001) (Fig. 1A). This is consistent with the high expression of SSTR type 2 in AR42J cells and undetectable expression of SSTR2 in A549 cells. In the competition receptor-binding assay, non-labeled octreotide competed specifically with the 68Ga-DOTATOC for binding to the AR42J cells. As shown in Figure 1B, treatment of AR42J cells with increasing doses of octreotide acetate led to decreased 68Ga-DOTATOC uptake. 68Ga-DOTATOC influx was completely inhibited at an octreotide concentration of 10 μM or higher. A549 did not show considerable 68Ga-DOTATOC uptake or displacement with octreotide treatment. This finding shows that 68Ga-DOTATOC can be used to monitor the SSTR octreotide occupancy in SSTR expressing cells. Cell cycle assays were performed to demonstrate the effect of octreotide on cell proliferation. As seen in Figure 1C, and 1D, for SSTR expressing AR42J cells, treatment with octreotide decreased the percent of cells in S-phase by 53% compared to control (p<0.001). In SSTR non-expressing A549 cells, treatment with octreotide did not lead to a significant difference in S-phase compared to control (p>0.5). These data suggest that octreotide exerts a downstream inhibitory effect on cell proliferation through somatostatin receptors.
Fig. 1.
In vitro studies. A) 68Ga-DOTATOC demonstrated significantly higher binding to AR42J compare to A549 cells (p < 0.0001). B) In vitro competitive binding studies demonstrate binding affinity of 68Ga-DOTATOC to SSTR. Octreotide concentration ≥ 10 μM completely binds all sites, while doses of ≤1 μM allow for 68Ga-DOTATOC accumulation in graded manner in AR42J cells. A549 serve as a negative control with minimal expression of SSTR. C) Gated FACS EDU binding data demonstrates that treatment with octreotide significantly decreased (p<0.001) the number of AR42J cells in s-phase while it had no effect on the number of A549 cells in s-phase. D) Gated FACS EDU graph shows decreased proliferation in octreotide-treated versus control cultures for AR42J (top row), compared to A549 cells (second row) which showed no difference. Arrows indicate the cells in the S-phase.
Correlation of imaging findings with SSTR-2 protein levels
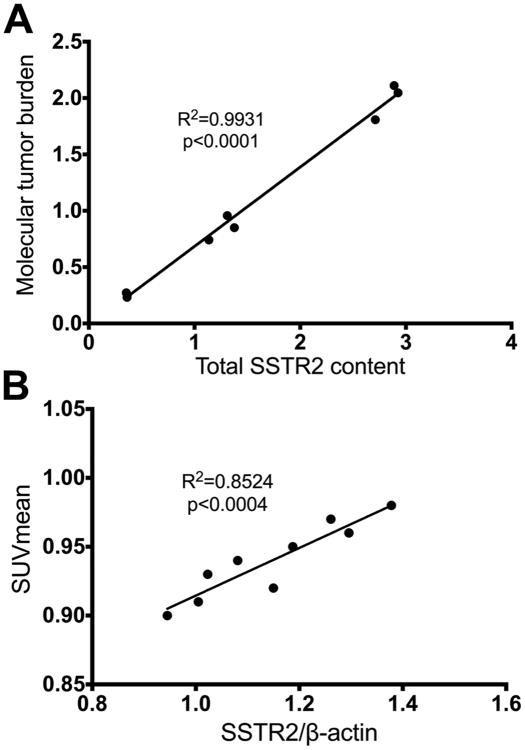
There was a consistent ratio between SSTR2 expression level and 68Ga-DOTATOC quantitative imaging measures irrespective of tumor size (tumors with diameter 3.9-8.2 mm) in AR42J tumors. The total 68Ga-DOTATOC uptake of the tumors as measured by the molecular tumor burden (MTB) (15) on PET studies which were acquired in the static mode strongly correlates with the total SSTR2 content in tumors (R2= 0.99, p<0.0001), as seen in Figure 2A. MTB is the product of SUVmean and molecular tumor volume (total volume of the voxels in the region of interest with 68Ga-DOTATOC uptake above the defined threshold) (16). Moreover, the mean 68Ga-DOTATOC uptake in tumors (SUVmean) also strongly correlates (Fig. 2B) with the expression of SSTR2 normalized for β-actin expression (R2= 0.85, p<0.0004). These findings demonstrate that the noninvasively measured 68Ga-DOTATOC uptake is a true reflection of the SSTR2 levels in the tumors.
Fig. 2.
Western blotting results demonstrates a consistent ratio between SSTR2 expression level and 68Ga-DOTATOC quantitative measures irrespective of tumor size (tumors with diameter 3.9-8.2 mm) in AR42J tumors. A) Total 68Ga-DOTATOC uptake of the tumors (MTB) strongly correlates with the total SSTR2 content in tumors. B) The mean 68Ga-DOTATOC uptake in tumors (SUVmean) also strongly correlates with the SSTR2/β-actin expression ratio.
Dynamic 68Ga-DOTATOC PET imaging of AR42J tumors
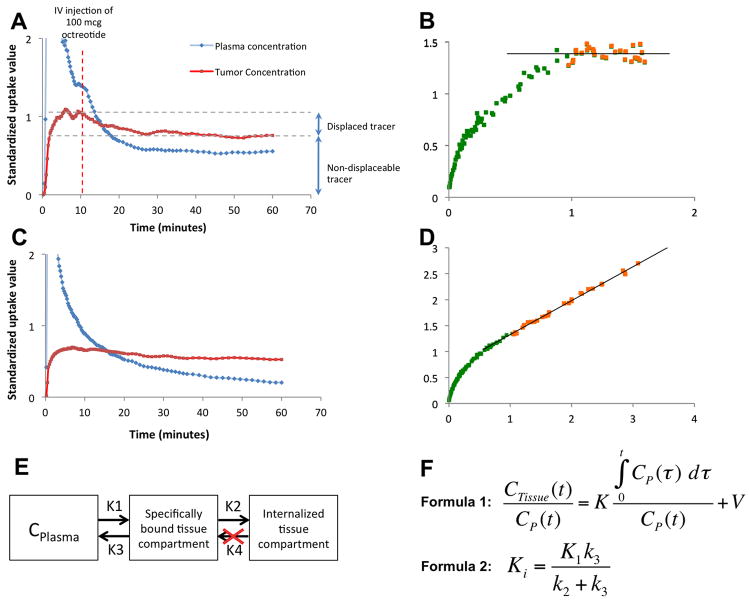
Octreotide challenge studies showed that 68Ga-DOTATOC is partially displaced by octreotide but a large fraction was not displaceable following competitive challenge. The displaceable fraction was the 68Ga-DOTATOC bound to SSTR but not yet internalized, while the remaining component was already internalized and non-displaceable (Fig. 3A, C). These findings were compatible with an irreversible 2-compartment tissue model (17) (Fig. 3E). Thus, based on the equations in Figure 3F, we employed a Patlak graphical plot and calculated the tumor influx constant (Ki) (18, 19). We noted that for all studies steady-state was achieved in less than 25 min, and thus a 25 min cut-off was used as a for fitting the Ki. The net 68Ga-DOTATOC influx rate, measured using a Patlak plot, following IV challenge of octreotide decreased to 0.0 (mL plasma)/(mL tissue)−1/min−1 (Fig. 3B), while the influx rate was approximately 0.7 (mL plasma)/(mL tissue) −1/min−1 without an octreotide challenge (Fig. 3D).
Fig. 3.
Dynamic 68Ga-DOTATOC scans of two AR42J bearing mice. A) In this dataset octreotide IV challenge at 10 minutes resulted in partial displacement of tracer from the receptor but a component of the uptake could not be displace even though the Patlak plots (B) show essentially no tracer influx after octreotide challenge in steady-state condition (orange dots). Please note that the slope of the best-fit line (Ki) in the steady state is approximately zero (R2=0.98). C) Without an octreotide drug challenge, the tracer accumulates in the tumor with a constant rate, as is evident in the Patlak plot (D); in the steady-state condition the orange dots the slope of the best-fit line (Ki) is 0.69 (R2=0.99). (D). E) This pattern of tracer uptake is compatible with an irreversible two-tissue compartment model. F) The x and y axis of the Patlak plots (such as B and D) are calculated using formula 1; in the x axis is plotted against in the y axis to draw the Patlak plot and K is measured using linear regression. The net tracer influx rate (Ki) is measured using formula 2. t: time after tracer injection; CTissue: the amount of tracer in the region of interest; CP(t): the concentration of tracer in plasma; K: the rate of entry into the irreversible compartment; V0: the distribution volume of the tracer in the central compartment.
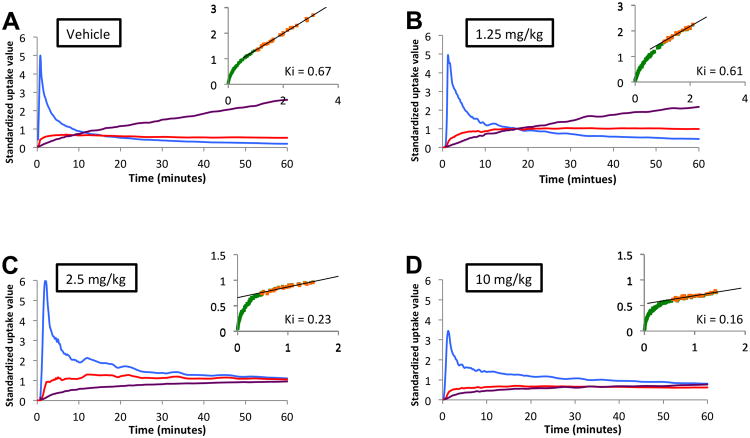
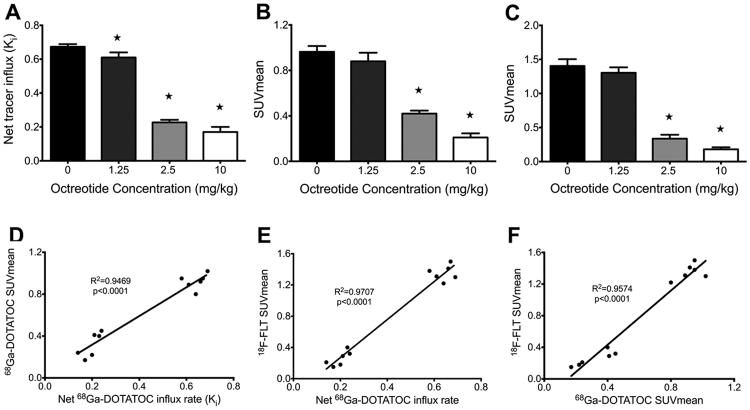
The parameter Ki, which is the net rate of 68Ga-DTOATOC influx, is independent of tumor perfusion and reflects the number of available receptors as well as the rate of receptor trafficking (17-19). Measurement of the Ki in AR42J tumors demonstrated that octreotide treatment significantly decreased the rate of tracer influx in all treatment groups compared to control, and that the mean Ki monotonically decreased with higher doses. The mean Ki was 0.67±0.02, 0.61±0.03, 0.23±0.02, and 0.17±0.03 (mL plasma)/(mL tissue)−1/min−1 in vehicle, 1.25mg/kg, 2.5mg/kg, and 10 mg/kg treatment groups, respectively, as shown in Figure 4. There was a significant decrease in the Ki of all treatment groups compared to the vehicle group. The decreasing Ki reflects the number of receptors occupied by octreotide and that are unavailable to bind 68Ga-DOTATOC.
Fig. 4.
Dynamic PET imaging of AR42J tumors in vehicle (A), 1.25 mg/kg (B), 2.5 mg/kg (C), and 10 mg/kg (D) octreotide with accompanying Patlak plot on right upper corner of each panel (orange). There is a graded decrease in the slope of the Patlak plot (Ki) after reaching steady state with increasing doses of octreotide treatment (Blue: blood pool; Red: tumor uptake; Purple: tumor/blood pool ratio; Green: data points in Patlak plot before reaching steady-state blood levels; Orange: data points in Patlak plot after reaching steady-state blood levels)
Static 68Ga-DOTATOC PET imaging of AR42J tumors
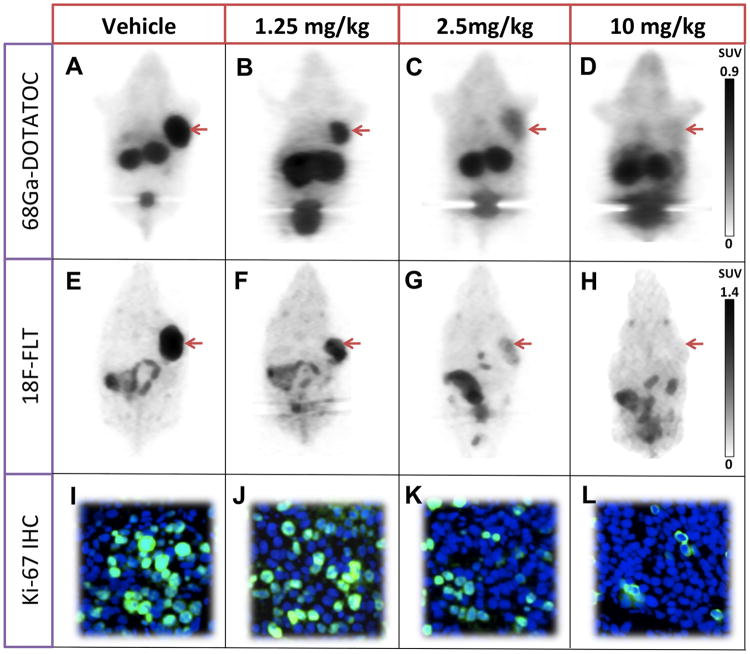
Static scan results confirmed and paralleled the results of dynamic 68Ga-DOTATOC PET imaging. Treatment with increasing doses of octreotide acetate led to progressively significant decreases in tumor SUVmean compared to control. Representative images are shown in Figure 5. The mean SUVmean was 0.96±0.05, 0.88±0.08, 0.42±0.03, and 0.21±0.04 in vehicle, 1.25mg/kg, 2.5mg/kg, and 10 mg/kg treatment groups, respectively (Fig. 6B). As is shown in the Figure 6D, there was a very strong correlation between tumor SUVmean and Ki measured by static and dynamic 68Ga-DOTATOC PET imaging (R2=0.95, p<0.0001). The high agreement of quantitative parameters between static and dynamic 68Ga-DOTATOC PET in our study, suggests that SUVmean of the tumors in static PET, although not as accurate as Ki measured by dynamic PET for free receptor density, can be effectively employed to monitor SSTR receptor occupancy with octreotide treatment.
Fig. 5.
Imaging of AR42J tumors using static 68Ga-DOTATOC (A-D), 18F-FLT (E-H) and staining for Ki-67 in tumors samples (I-L) in 4 groups of mice treated with vehicle, 1.25, 2.5, or 10 mg/kg. There is high 68Ga-DOTATOC and 18F-FLT uptake as well as 25% cells stained for Ki-67 in tumors in the control group; there is a graded decrease across all the biomarkers with increased dose of octreotide treatment. The 10 mg/kg octreotide dose shows near background levels of 68Ga-DOTATOC and 18F-FLT uptake and 5% staining for Ki-67.
Fig. 6.
A-C) Results of PET imaging in four treatment groups of mice bearing AR42J tumors (n=3 in each treatment group). A) Net tracer influx rate (Ki) in dynamic 68Ga-DOTATOC shows a graded and significant decrease in uptake with increased dose of octreotide. B) The same pattern of decrease is observed in SUVmean of tumors in static 68Ga-DOTATOC PET (B) and 18F-FLT PET (C). D) There is strong correlation between SUVmean of tumor in static 68Ga-DOTATOC PET scans and Ki in dynamic 68Ga-DOTATOC PET analysis. E, F) Correlation between SUVmean of tumor in 18F-FLT PET scans and Ki in dynamic 68Ga-DOTATOC PET (D) as well as SUVmean in static 68Ga-DOTATOC PET (E). There is very strong correlation between 18F-FLT uptake in the tumor and both Ki and SUVmean of tumor in 68Ga-DOTATOC PET scans. *: p<0.05
Static 18F-FLT PET imaging and its correlation with 68Ga-DOTATOC PET imaging
Treatment with octreotide acetate decreased the SUVmean of 18F-FLT tumor uptake in all treatment groups compared to the control group. As with dynamic and static 68Ga-DOTATOC PET imaging, higher doses of octreotide led to monotonically decreasing 18F-FLT PET SUVmean. The mean SUVmean was 1.40±0.10, 1.30±0.08, 0.34±0.06, and 0.18±0.03 in vehicle, 1.25mg/kg, 2.5mg/kg, and 10 mg/kg treatment groups, respectively, as seen in Figure 6. There was a strong correlation between the SUVmean of the tumors in 18F-FLT PET scans and both SUVmean and Ki of tumors in 68Ga-DOTATOC PET scans (R2= 0.95, p<0.0001 and R2=0.97, p<0.0001, respectively) (Fig. 6E, and 6F). This demonstrates that increased occupancy of SSTR with octreotide results in a reduced rate of tumor proliferation in vivo, assessed by static18F-FLT PET; the magnitude of reduction in tumor proliferation rate is directly correlated with and dependent on the level of SSTR octreotide occupancy and thus can be potentially monitored using 68Ga-DOTATOC PET imaging.
Ki-67 staining results
Treatment of AR42J tumors with increasing doses of octreotide led to a reduction in the percentage of cells staining for Ki-67. The mean percentage of cells stained for Ki-67 was 25±1.2, 23±0.8, 11±0.9, and 5±1.1 in the vehicle, 1.25mg/kg, 2.5mg/kg, and 10 mg/kg treatment groups, respectively. Increase in the SSTR octreotide occupancy results in a respective decrease in the rate of tumor proliferation shown by the decrease in relative number of cells stained for Ki-67 (Fig. 5). These results are consistent with the results obtained by noninvasive 18F-FLT PET imaging and further confirms the enhanced anti-proliferative effects of octreotide on tumor cells with increasing level of SSTR octreotide occupancy.
Discussion
Octreotide continues to play a key role in the treatment of patients with metastatic NET, both for the control of symptoms of hypersecretion and, more recently, for control of tumor growth (1, 20-22). In an efficacy clinical trial called the PROMID trial (6) it was shown that a fixed monthly injection of octreotide LAR significantly increased the time to tumor progression in patients with metastatic mid-gut carcinoids by 8.3 months compared to placebo, demonstrating the antiproliferative effect of octreotide LAR on well-differentiated mid-gut NETs. However, the potential for optimized individual dosing of octreotide to lead to further significant improvements in PFS has never been explored. Quantitative noninvasive assessment of somatostatin receptor occupancy and downstream pharmacodynamic assessment of proliferation, as demonstrated in this study, could directly guide such personalized dosing optimization.
This paradigm shift from the use of imaging for disease detection to disease characterization, including the direct and downstream molecular effects of therapy on specific tumors, provides an opportunity to use such assessment to prospectively guide tailored therapy rather than retrospective reporting on treatment effectiveness measured by tumor volume changes. Such paired imaging of upstream intracellular signaling from cell surface receptors and downstream effects such as proliferation changes or alterations in apoptosis rates could be applied to a broad range of targeted therapies for individual patient drug dosing optimization. This includes therapies targeted at receptor tyrosine kinases, estrogen receptors, and androgen receptors, among other targets.
The quantitative nature of the 68Ga-DOTATOC PET measurements allows an indirect assessment of fractional SSTR occupancy. Our kinetic model is similar to that developed by Henze, et. al. (17) for characterization of the kinetics of 68Ga-DOTATOC uptake in brain meningiomas. Using dynamic PET imaging we established that 68Ga-DOTATOC and octreotide directly compete for binding to SSTR and that binding of somatostatin analogs results in irreversible internalization (23) of the ligand receptor complex. Using this tracer kinetic model, we could then reliably calculate SSTR free fraction with increasing doses of octreotide. We demonstrated a highly significant correlation between the net tracer influx rate (Ki) and the SUV measurement. The net tracer influx rate (Ki) is measured by Patlak graphical analysis of dynamic PET data based on an irreversible two-compartment kinetic model which removes the effects of perfusion from the calculated receptor mediated uptake values, while SUV, which is calculated from static PET data, is more routinely employed in the clinic and does not separate perfusion effects from the receptor mediated uptake. For clinical translation, both the net tracer influx rate (Ki) and SUV measurements could be determined in patients. Given the typical enhancement pattern seen on CT scanning of carcinoid tumors (24, 25) suggestive of high tumoral perfusion, these may correlate clinically as well as in preclinical assessment performed in this study, providing a means to more simply translate this approach for patient assessment.
One possible limitation to measuring receptor occupancy level using PET imaging is that it is most useful when the receptor-targeted therapy such as octreotide is in the sub-saturating range. If the administered dose of octreotide is high enough to completely saturate receptors, then there will be no tracer uptake in the intracellular compartment; in these circumstances receptor quantitation using PET imaging shows complete occupancy and the degree of excess octreotide dose cannot be assessed. In practice, the majority of carcinoid patients is given sub-saturating doses of octreotide (26) and may benefit from dose adjustment using the proposed approach.
The association between SSTR receptor occupancy and tumor proliferation observed in the animal models used in our study suggests that dose optimization of octreotide based on receptor occupancy measurements in individual patients may be clinically beneficial. Specifically, quantitative PET imaging of the free somatostatin receptor fraction measured with 68Ga-DOTATOC, coupled with PET imaging of proliferation measured with 18F-FLT, provides a multiparametric means for potentially optimizing octreotide LAR dosing in patients with carcinoid tumors on an individual basis. Such personalized treatment may provide additional benefit over standard uniform dosing approaches currently employed. This image-guided approach to individualized drug dosing may also be employed for other receptor-targeted therapies in cancer treatment in the future. Validation of this approach in clinical trials is warranted.
Acknowledgments
The authors would like to thank Alicia K. Leece for helping us with labeling of the PET radiotracers.
Financial support: This research was supported in part by National Institutes of Health grants R01CA166582, U01CA143056, U01CA084301, and P50CA127003.
Footnotes
Conflicts of interest: none
References
- 1.Kulke MH, Benson AB, 3rd, Bergsland E, Berlin JD, Blaszkowsky LS, Choti MA, et al. Neuroendocrine tumors. Journal of the National Comprehensive Cancer Network: JNCCN. 2012;10:724–64. doi: 10.6004/jnccn.2012.0075. [DOI] [PubMed] [Google Scholar]
- 2.Kulke MH, Bendell J, Kvols L, Picus J, Pommier R, Yao J. Evolving diagnostic and treatment strategies for pancreatic neuroendocrine tumors. Journal of hematology & oncology. 2011;4:29. doi: 10.1186/1756-8722-4-29. [DOI] [PMC free article] [PubMed] [Google Scholar]
- 3.Reubi JC, Krenning E, Lamberts SW, Kvols L. In vitro detection of somatostatin receptors in human tumors. Metabolism. 1992;41:104–10. doi: 10.1016/0026-0495(92)90042-9. [DOI] [PubMed] [Google Scholar]
- 4.Patel YC. Molecular pharmacology of somatostatin receptor subtypes. J Endocrinol Invest. 1997;20:348–67. doi: 10.1007/BF03350317. [DOI] [PubMed] [Google Scholar]
- 5.Florio T. Molecular mechanisms of the antiproliferative activity of somatostatin receptors (SSTRs) in neuroendocrine tumors. Front Biosci. 2008;13:822–40. doi: 10.2741/2722. [DOI] [PubMed] [Google Scholar]
- 6.Rinke A, Muller HH, Schade-Brittinger C, Klose KJ, Barth P, Wied M, et al. Placebo-controlled, double-blind, prospective, randomized study on the effect of octreotide LAR in the control of tumor growth in patients with metastatic neuroendocrine midgut tumors: a report from the PROMID Study Group. Journal of clinical oncology: official journal of the American Society of Clinical Oncology. 2009;27:4656–63. doi: 10.1200/JCO.2009.22.8510. [DOI] [PubMed] [Google Scholar]
- 7.Buchmann I, Henze M, Engelbrecht S, Eisenhut M, Runz A, Schafer M, et al. Comparison of 68Ga-DOTATOC PET and 111In-DTPAOC (Octreoscan) SPECT in patients with neuroendocrine tumours. European journal of nuclear medicine and molecular imaging. 2007;34:1617–26. doi: 10.1007/s00259-007-0450-1. [DOI] [PubMed] [Google Scholar]
- 8.Poeppel TD, Binse I, Petersenn S, Lahner H, Schott M, Antoch G, et al. 68Ga-DOTATOC versus 68Ga-DOTATATE PET/CT in functional imaging of neuroendocrine tumors. J Nucl Med. 2011;52:1864–70. doi: 10.2967/jnumed.111.091165. [DOI] [PubMed] [Google Scholar]
- 9.Shi W, Johnston CF, Buchanan KD, Ferguson WR, Laird JD, Crothers JG, et al. Localization of neuroendocrine tumours with [111In] DTPA-octreotide scintigraphy (Octreoscan): a comparative study with CT and MR imaging. QJM. 1998;91:295–301. doi: 10.1093/qjmed/91.4.295. [DOI] [PubMed] [Google Scholar]
- 10.Bombardieri E, Ambrosini V, Aktolun C, Baum RP, Bishof-Delaloye A, Del Vecchio S, et al. 111In-pentetreotide scintigraphy: procedure guidelines for tumour imaging. European journal of nuclear medicine and molecular imaging. 2010;37:1441–8. doi: 10.1007/s00259-010-1473-6. [DOI] [PubMed] [Google Scholar]
- 11.Virgolini I, Ambrosini V, Bomanji JB, Baum RP, Fanti S, Gabriel M, et al. Procedure guidelines for PET/CT tumour imaging with 68Ga-DOTA-conjugated peptides: 68Ga-DOTA-TOC, 68Ga-DOTA-NOC, 68Ga-DOTA-TATE. European journal of nuclear medicine and molecular imaging. 2010;37:2004–10. doi: 10.1007/s00259-010-1512-3. [DOI] [PubMed] [Google Scholar]
- 12.Barthel H, Cleij MC, Collingridge DR, Hutchinson OC, Osman S, He Q, et al. 3′-deoxy-3′-[18F]fluorothymidine as a new marker for monitoring tumor response to antiproliferative therapy in vivo with positron emission tomography. Cancer Res. 2003;63:3791–8. [PubMed] [Google Scholar]
- 13.Decristoforo C, Knopp R, von Guggenberg E, Rupprich M, Dreger T, Hess A, et al. A fully automated synthesis for the preparation of 68Ga-labelled peptides. Nucl Med Commun. 2007;28:870–5. doi: 10.1097/MNM.0b013e3282f1753d. [DOI] [PubMed] [Google Scholar]
- 14.Zhernosekov KP, Filosofov DV, Baum RP, Aschoff P, Bihl H, Razbash AA, et al. Processing of generator-produced 68Ga for medical application. J Nucl Med. 2007;48:1741–8. doi: 10.2967/jnumed.107.040378. [DOI] [PubMed] [Google Scholar]
- 15.Liao S, Penney BC, Wroblewski K, Zhang H, Simon CA, Kampalath R, et al. Prognostic value of metabolic tumor burden on 18F-FDG PET in nonsurgical patients with non-small cell lung cancer. European journal of nuclear medicine and molecular imaging. 2012;39:27–38. doi: 10.1007/s00259-011-1934-6. [DOI] [PubMed] [Google Scholar]
- 16.Fonti R, Larobina M, Del Vecchio S, De Luca S, Fabbricini R, Catalano L, et al. Metabolic tumor volume assessed by 18F-FDG PET/CT for the prediction of outcome in patients with multiple myeloma. J Nucl Med. 2012;53:1829–35. doi: 10.2967/jnumed.112.106500. [DOI] [PubMed] [Google Scholar]
- 17.Henze M, Dimitrakopoulou-Strauss A, Milker-Zabel S, Schuhmacher J, Strauss LG, Doll J, et al. Characterization of 68Ga-DOTA-D-Phe1-Tyr3-octreotide kinetics in patients with meningiomas. J Nucl Med. 2005;46:763–9. [PubMed] [Google Scholar]
- 18.Patlak CS, Blasberg RG. Graphical evaluation of blood-to-brain transfer constants from multiple-time uptake data. Generalizations. Journal of cerebral blood flow and metabolism: official journal of the International Society of Cerebral Blood Flow and Metabolism. 1985;5:584–90. doi: 10.1038/jcbfm.1985.87. [DOI] [PubMed] [Google Scholar]
- 19.Patlak CS, Blasberg RG, Fenstermacher JD. Graphical evaluation of blood-to-brain transfer constants from multiple-time uptake data. Journal of cerebral blood flow and metabolism: official journal of the International Society of Cerebral Blood Flow and Metabolism. 1983;3:1–7. doi: 10.1038/jcbfm.1983.1. [DOI] [PubMed] [Google Scholar]
- 20.Chan JA, Kulke MH. New treatment options for patients with advanced neuroendocrine tumors. Current treatment options in oncology. 2011;12:136–48. doi: 10.1007/s11864-011-0148-2. [DOI] [PubMed] [Google Scholar]
- 21.Kulke MH, Anthony LB, Bushnell DL, de Herder WW, Goldsmith SJ, Klimstra DS, et al. NANETS treatment guidelines: well-differentiated neuroendocrine tumors of the stomach and pancreas. Pancreas. 2010;39:735–52. doi: 10.1097/MPA.0b013e3181ebb168. [DOI] [PMC free article] [PubMed] [Google Scholar]
- 22.Kulke MH, Siu LL, Tepper JE, Fisher G, Jaffe D, Haller DG, et al. Future directions in the treatment of neuroendocrine tumors: consensus report of the National Cancer Institute Neuroendocrine Tumor clinical trials planning meeting. Journal of clinical oncology: official journal of the American Society of Clinical Oncology. 2011;29:934–43. doi: 10.1200/JCO.2010.33.2056. [DOI] [PMC free article] [PubMed] [Google Scholar]
- 23.Waser B, Tamma ML, Cescato R, Maecke HR, Reubi JC. Highly efficient in vivo agonist-induced internalization of sst2 receptors in somatostatin target tissues. J Nucl Med. 2009;50:936–41. doi: 10.2967/jnumed.108.061457. [DOI] [PubMed] [Google Scholar]
- 24.Levy AD, Sobin LH. From the archives of the AFIP: Gastrointestinal carcinoids: imaging features with clinicopathologic comparison. Radiographics: a review publication of the Radiological Society of North America, Inc. 2007;27:237–57. doi: 10.1148/rg.271065169. [DOI] [PubMed] [Google Scholar]
- 25.Scarsbrook AF, Ganeshan A, Statham J, Thakker RV, Weaver A, Talbot D, et al. Anatomic and functional imaging of metastatic carcinoid tumors. Radiographics: a review publication of the Radiological Society of North America, Inc. 2007;27:455–77. doi: 10.1148/rg.272065058. [DOI] [PubMed] [Google Scholar]
- 26.Haug AR, Rominger A, Mustafa M, Auernhammer C, Goke B, Schmidt GP, et al. Treatment with octreotide does not reduce tumor uptake of (68)Ga-DOTATATE as measured by PET/CT in patients with neuroendocrine tumors. J Nucl Med. 2011;52:1679–83. doi: 10.2967/jnumed.111.089276. [DOI] [PubMed] [Google Scholar]


