

Abstract
Heschl’s gyrus (HG) is reported to have a normal left>right hemispheric volume asymmetry, and reduced asymmetry in schizophrenia. Primary auditory cortex (A1) occupies the caudal-medial surface of HG, but it is unclear if A1 has normal asymmetry, or whether its asymmetry is altered in schizophrenia. To address these issues, we compared bilateral gray matter volumes of HG and A1, and neuron density and number in A1, in autopsy brains from male subjects with or without schizophrenia. Comparison of diagnostic groups did not reveal altered gray matter volumes, neuron density, neuron number or hemispheric asymmetries in schizophrenia. With respect to hemispheric differences, HG displayed a clear left>right asymmetry of gray matter volume. Area A1 occupied nearly half of HG, but had less consistent volume asymmetry, that was clearly present only in a subgroup of archival brains from elderly subjects. Neuron counts, in layers IIIb-c and V-VI, showed that the A1 volume asymmetry reflected differences in neuron number, and was not caused simply by changes in neuron density. Our findings confirm previous reports of striking hemispheric asymmetry of HG, and additionally show evidence that A1 has a corresponding asymmetry, although less consistent than that of HG.
Keywords: cerebral cortex, human, postmortem, stereology, neuron number
1. Introduction
In humans, primary auditory cortex (A1) is located on a well-developed Hechl’s gyrus (HG), located in the lateral sulcus. Like the adjacent planum temporale, volume measurements of HG have often found a left>right asymmetry, which may correspond to the human hemispheric specialization of language. In many studies, the left HG was in the range of 10–30% larger than the right [e.g., (Penhune et al., 1996; Chance et al., 2006; Dorsaint-Pierre et al., 2006; Golestani et al., 2007)]. However, the shape of HG can vary, and the extent of asymmetry depends on the criteria used to define this structure (Smiley, 2009).
The asymmetry of HG could be due to expansion of the cytoarchitectonic areas in the left hemisphere, and/or inclusion of more areas. Several cytoarchitectonic maps of HG have been produced (von Economo and Horn, 1930; Galaburda and Sanides, 1980; Hackett et al., 2001; Rademacher et al., 2001b; Wallace et al., 2002; Sweet et al., 2005; Fullerton and Pandya, 2007; Hackett, 2008). There are some inconsistencies in these maps, reflecting the limitations of cytoarchitectonic methods. Nevertheless, they consistently identify a highly granular, presumed primary sensory cortex, on the part of HG nearer to the depth of the lateral sulcus, ringed by presumed association areas that also occupy much of the rostral-lateral part of HG. This general organization is confirmed by functional mappings, made using surgical depth electrodes (Liegeois-Chauvel et al., 1991; Pantev et al., 1995; Howard et al., 2000) or functional MRI (Formisano et al., 2003; Bendor and Wang, 2006; Langers and van Dijk, 2012). Anatomical findings have suggested hemispheric differences in the cytoarchitectonic areas on HG, but most studies used small numbers of brains (von Economo and Horn, 1930; Galaburda and Sanides, 1980; Rademacher et al., 1993). One exception is a study of 27 brains that used an automated image processing method to identify auditory cortex on HG (Rademacher et al., 2001b). That study did not find consistent A1 asymmetry, although there was evidence of a gender difference, with more left>right asymmetry in males than females (Rademacher et al., 2001a).
Schizophrenia is associated with reduced volume and width of the cerebral cortex. In auditory cortex, the magnitude of decreased volume varies between studies. Some in vivo studies found reductions of as much as 15% in both HG and the adjacent superior temporal gyrus [e.g., (Kasai et al., 2003; Salisbury et al., 2007)] but others found smaller changes [reviewed in (Shenton et al., 2001; Smiley, 2009)]. In the superior temporal gyrus, reduced volume was nearly always greater in the left than right hemisphere. While fewer studies are available in HG, these also showed evidence of larger reductions in the left. We previously reported a modest cortical thinning, with unchanged neuron density, in the left planum temporale, caudal and lateral to Heschl’s gyrus (Smiley et al., 2009). In the present study we used the same postmortem brains to examine the bilateral volumes of HG and A1, and additionally measured neuron density and number in A1, to define further the normal asymmetry of these features as well as their potential changes in schizophrenia.
2. Methods
2.1. Diagnostic and exclusionary criteria
Tissue samples from 19 schizophrenia and 18 nonpsychiatric males was obtained at autopsy either at the Institute for Forensic Medicine in Skopje Macedonia (matched schizophrenia and nonpsychiatric cases), or from New York State psychiatric hospitals (schizophrenia cases) matched with Columbia-Presbyterian Medical Center (nonpsychiatric cases). Most subjects had dominant right hand use (Tables 1 and 2). Brains were included only if the entire HG and planum temporale, was available from both hemispheres. DSM-IV clinical diagnoses were established for all of the New York cases as previously described (Keilp et al., 1995), or by psychological autopsy interview (Kelly and Mann, 1996). Brains were excluded if there was a history of abuse or dependence of any substance except tobacco (Dwork et al., 1998), except for one schizophrenia and one control subjects with a history of alcohol abuse. Brains were also excluded if they had clinical or pathological diagnoses of neurological disease. Presence of Alzheimer’s disease was determined by Khachaturian criteria in samples of paraffin embedded cortex from each cortical lobe. Cases were omitted that had a density of neocortical plaques, immunostained with Alz50 (Ksiezak-Reding et al. 1988) or AT8 (Biernat et al. 1992) antibodies to hyperphosphorylated tau protein, that exceeded the age-dependent densities suggested by Khachaturian (1985). The study procedures were approved by the Institutional Review Boards of the New York State Psychiatric Institute, the Nathan Kline Institute, and the School of Medicine, University “Ss. Cyril & Methodius.”
Table 1.
Brain sample A, demographic and descriptive data.
| Schiz | Age (years) | PMI (h) | Form (months) | Weight (g) | Dom. hand | Tissue source | LNE (yr) | Diag. | Cause of death | Contr | Age (years) | PMI (h) | Form. (months) | Weight (g) | Dom. hand | Tissue source | Cause of death |
|---|---|---|---|---|---|---|---|---|---|---|---|---|---|---|---|---|---|
| D37+ | 43 | 19 | 6 | 1363 | R | RM | >10 | PS | 7 | D38+ | 50 | 7 | 8 | 1306 | R | RM | 3 |
| D20 | 53 | 15 | 16 | 1358 | R | RM | >10 | RS | 1 | D14 | 60 | 23 | 17 | 1277 | R | RM | 9 |
| D39 | 58 | 13 | 7 | 1621 | R | RM | >10 | RS | 2 | D16 | 60 | 20 | 7 | 1436 | R | RM | 11 |
| D53 | 33 | 20 | 15 | 1389 | R | RM | >10 | DS | 4 | D52 | 31 | 4 | 15 | 1540 | R | RM | 10 |
| D55 | 49 | 41 | 4 | 1335 | R | RM | >10 | PS | 5 | D54 | 42 | 24 | 7 | 1405 | R | RM | 13 |
| D56 | 73 | 7 | 7 | 1420 | R | RM | >10 | US | 8 | D13 | 80 | 9 | 16 | 1400 | R | RM | 11 |
| D15 | 48 | 7 | 6 | 1395 | R | RM | >10 | SA++ | 8 | D57 | 39 | 13 | 8 | 1230 | R | RM | 9 |
| D44 | 37 | 24 | 111 | 1500 | R | NY | >10 | US | 8 | D12 | 44 | 24 | 111 | 1240 | R | NY | 8 |
| D11 | 79 | 50 | 96 | 1440 | R | NY | >10 | US | 1 | D50 | 80 | 48 | 120 | n.a. | R | NY | 12 |
| D49 | 42 | 24 | 180 | 1450 | R | NY | >10 | PS | 8 | D33 | 42 | 24 | 129 | 1360 | R | NY | 1 |
| D51 | 29 | 24 | 180 | 1540 | n.a. | NY | <5 | US | 6 | ||||||||
| Ave | 49 | 22.2 | 57.1 | 1437 | Ave | 53 | 19.6 | 43.8 | 1355 | ||||||||
| S.D. | 16 | 13.2 | 71.5 | 86 | S.D. | 17 | 12.6 | 52.9 | 102 |
+ alcohol abuse; ++ mild mental retardation.
Abbreviations: Diag. = diagnosis; dom. hand = dominant hand; Form. = formaldehyde; LNE = lifetime neuroleptic exposure; M = mixed handed; n.a.= not available;NY = New York; PMI = postmortem interval; R = right handed; RM = Republic of Macedonia;
Diagnosis: DS = disorganized schizophrenia; PS = paranoid schizophrenia; RS = residual schizophrenia; SA = schizoaffective disorder; US = undifferentiated schizophrenia;
Cause of death: 1=pneumonia, 2=aspiration, 3=accidental electrocution, 4=hypothermia, 5=suicide, pesticide poisining, 6=sucide hanging, 7=suicide jumping, 8=cariorespiratory arrest, 9 =traffic accident, shock traumatic shock, 10=homicide, 11=cerebral contusion, 12=gastrointestinal bleeding, 13=myocarditis, 14=lung cancer and hemmorage, 15=renal failure
Table 2.
Brain sample B, demographic and descriptive data.
| Schiz | Age (yr) | PMI (h) | Form. (months) | Weight (g) | dom. hand | Tissue source | LNE yr | Diag. | Cause of death | Contr | Age (yr) | PMI (h) | Form. (months) | Weight (gr) | Dom. hand | Tissue source | Cause of death |
|---|---|---|---|---|---|---|---|---|---|---|---|---|---|---|---|---|---|
| D22 | 68 | 50 | 96 | 1540 | R | NY | >10 | US | 1 | D29 | 74 | 24 | 132 | 1160 | R | NY | 8 |
| D24 | 87 | 91 | 96 | 1300 | R | NY | >10 | PS | 8 | D30 | 71 | 24 | 132 | 1510 | M | NY | 8 |
| D25 | 67 | 63 | 288 | 1200 | R | NY | >10 | US | 1 | D31 | 52 | 24 | 120 | 1250 | R | NY | 8 |
| D26 | 80 | 21 | 312 | 1100 | R | NY | >10 | US | 1 | D32 | 87 | 24 | 132 | 1260 | n.a. | NY | n.a. |
| D27 | 86 | 48 | 228 | 1250 | n.a. | NY | >10 | US | 1 | D36 | 51 | 72 | 120 | 1600 | R | NY | 15 |
| D28 | 89 | 82 | 240 | 1250 | R | NY | >10 | US | 1 | D45 | 77 | 24 | 120 | 1150 | R | NY | 1 |
| D40 | 75 | 168 | 84 | 1400 | n.a. | NY | >10 | US | 8 | D46 | 74 | 24 | 120 | 1300 | R | NY | 8 |
| D42 | 65 | 168 | 96 | 1400 | R | NY | >10 | US | 14 | D48 | 88 | 48 | 136 | 1450 | R | NY | 8 |
| Ave | 77 | 86 | 180 | 1305 | Ave | 72 | 33 | 127 | 1335 | ||||||||
| S.D. | 10 | 55 | 97 | 138 | S.D. | 14 | 18 | 7 | 166 |
Abbreviations as in Table 1.
A subset of schizophrenia brains had long times in formalin and other confounding variables that could not be matched with similar controls. Therefore, we separated our brains into 2 samples. Sample A (Table 1) included 11 schizophrenia and 10 nonpsychiatric subjects who were matched as closely as possible for source (New York or Macedonia), time in formalin, age, postmortem interval and race. Sample B (Table 2) included 8 schizophrenia and 8 nonpsychiatric brains from older schizophrenia and comparison subjects who could not be matched for time in formalin and postmortem interval. Therefore, diagnostic group comparisons in these brains were limited to the magnitude of hemispheric asymmetries.
2.2. Tissue dissection and processing
For each brain, tissue from the left and right hemispheres was simultaneously dehydrated and plastic-embedded in the same container, and otherwise processed as identically as possible. The complete HG and planum temporale from each hemisphere was processed as previously described (Smiley et al., 2009). Briefly, tissue was embedded in celloidin (nitrocellulose) plastic, sectioned at 80 micron thickness on a sliding microtome, and Nissl-stained with cresylecht violet. During sectioning, video images of the cutting surface were made to record the appearance of every section. These images were used to make 3-dimensional reconstructions, so that all microscopic observations could be precisely located within the original tissue (Fig. 1).
Figure 1.

Examples of the location of Hesch’s gyrus (HG) and the primary auditory cortex (A1) on the superior temporal plane. A–C. Each figure shows both the original tissue and the 3-dimensional reconstruction of the left and right hemispheres. The major borders of HG are indicated by white arrowheads, and the location of A1 is highlighted in white on the 3-dimensional reconstructions. In the reconstructions, the overlying parietal tissue was removed to view fully HG and the adjacent superior temporal plane. The 3-dimensional reconstructions were made from the same series of 0.96mm spaced sections that were used for Nissl staining and cytoarchitectonic delineation of the A1. The location of A1 was determined by microscopic viewing of the Nissl-stained sections.
For delineation of HG boundaries, we used a modified version of the method described by Penhune et al. (Penhune et al., 1996). The identification of HG was confirmed by the presence of cytoarchitectonically identified A1 on its caudal-medial part, and was consistently the first prominent transverse gyrus that originated at the caudal end of the insula, as previously described (Steinmetz et al., 1990). Its border rostral-medially was the fundus of the first transverse sulcus (“HS1” of Fullerton and Pandya (Fullerton and Pandya, 2007)), and caudal-laterally was the fundus of Heschl’s sulcus (“HS2” of Fullerton and Pandya). Delineation of HG was uncomplicated when it was a continuous gyrus that extended across the superior temporal plane. If a sulcus intermedius was found on the surface of HG, then cortex on either side of it was included as HG, unless the sulcus intermedius clearly extended to the medial fundus of the lateral sulcus, or to the rostral-lateral end of HG, in which case the cortex lateral to it was excluded from HG, and considered part of the planum temporale (e.g., Figure 1C, right hemisphere). If HG extended completely across the superior temporal plane, its termination was the crest of the lateral sulcus. In some cases, HG did not fully extend across the sulcus, and its rostal end was usually clearly visible as a ridge, where its surface stepped down to join the rostral temporal plane [(Penhune et al., 1996); e.g. Figure 1B, right hemisphere]. In a few cases the rostral end of HG did not have a clear ridge, and its rostral end was placed at the rostral tip of Heschl’s sulcus. Scale: section spacing = 0.96mm.
As in previous studies of this tissue (Smiley et al., 2009; Smiley et al., 2011), we did not correct our measurements for tissue shrinkage. Total volume shrinkage of 50 +/− 8.4% (mean +/− S.D.) was estimated in 4 brains from sample A by comparison of images of the block faces before dehydration with images of the on-slide Nissl-stained sections. This is similar to previous estimates of 40–50% volume shrinkage during celloidin embedding (Bush and Allman, 2004; Fullerton and Pandya, 2007). Our shrinkage estimate does not include the effect of formalin fixation, because we did not have access to the brains before fixation.
2.3. Measurement of HG and A1 gray matter volumes
The Cavalieri method was used to measure cortical volumes from Nissl-stained sections, as previously described (Smiley et al., 2009). Briefly, a randomly selected series of every 12th 80um thick section through the length of HG and the planum temporale was Nissl-stained, the slide-mounted sections were photographed on a light box with a Nikon Coolpix digital camera, and Object-Image software (http://simon.bio.uva.nl/object-image) was used to superimpose a point grid, and to count the points overlying the region of interest. On average, 23 +/− 6 (S.D.) sections were measured per HG, and 14 +/− 3 sections per A1, with 435 +/−183 grid points counted per measured volume (range 136 to 1,212). The coefficient of error (CE) was < 0.04 for all A1 and HG volume measurements, using an empirically determined shape factor of 5.5 from A1, and the m = 1 smoothness factor (Gundersen et al., 1999; Slomianka and West, 2005). The average section thickness for each hemisphere was determined by measuring every Nissl-stained section through HG with a 50X oil immersion objective and a Heidenhain stage-mounted micrometer. The measured thickness of 75.9 +/4.1 microns (mean +/S.D., N = 74 hemispheres) indicated a slight on-slide shrinkage after cutting at 80 microns on a calibrated microtome. Final volumes were calculated using the measured section thickness.
For delineation of HG boundaries, we used a modified version of the method of Penhune et al. (Penhune et al., 1996); see Figure 1 for details. To identify A1, we used a modifications of the definitions of Fullerton and Pandya (2007; see also Galaburda and Sanides (1980)); see Figures 2 and 3 for details. Our A1 includes the sub-areas of A1 that they named Km1,Km2,Km3, and Kl. However, unlike their description we did not encounter any case in which A1 extended laterally across Heschl’s sulcus. Additionally, we excluded the distinctive area located on the lateral border of A1, typically at the fundus of Heschl’s sulcus (Figure 3). Thus, it is possible that we excluded some lateral cortex that they included in their sub-area Kl.
Figure 2.
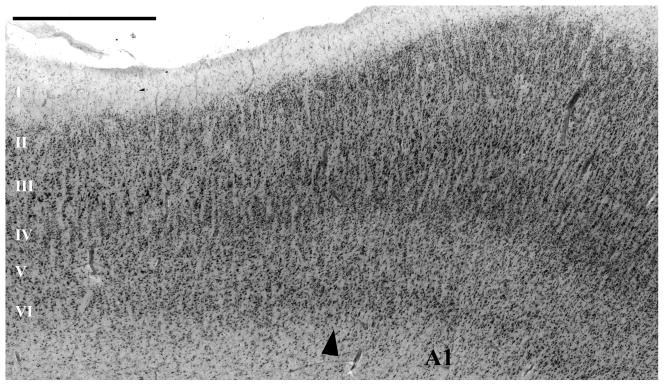
This micrograph, at the medial border of A1, shows the main cytoarchitectonic criteria used to identify its borders. In A1, there was a comparatively high density of small neurons in layers III and IV. At most A1 borders, the layer III–IV border was strikingly less distinct than in the adjacent areas, because of the higher density of small neurons in layers III–IV in A1, and the reduced number of large pyramidal cells at the lower edge of layer III. Additionally, at most borders, A1 is distinguished by its comparatively wide and pale layer V. At its medial border, A1 is usually easily identified because it borders on areas (ProK, PaI, and Reit of (Fullerton and Pandya, 2007)) that have distinctly more large cells in layer V, distinctly less neuron density and more large pyramidal cells in III, and a clearer separation of layers III and IV than in A1. The caudal, and caudal-medial, borders of A1 abut an area on the caudal end of HG that has more pronounced minicolumns due to larger cells in layers III and IV, and better separation of layers III and IV compared to A1. Compared to most other areas surrounding A1, this area maintains a thick and cell dense layer IV. This area corresponds to the retroinsular area (Reit) of Fullerton et al. (Fullerton and Pandya, 2007). Caudal-laterally, A1 borders on area PaAc. The rostral border of A1 abuts area PaAr (Galaburda and Sanides, 1980; Fullerton and Pandya, 2007) that differs from A1 by the separation between layers III and IV, with lower neuron density and larger pyramidal cells in layers III. Scale bar = 1 mm.
Figure 3.

The lateral border of A1, typically near the depth of Heschl’s suclus, bordered on a distinctive area (between arrow-heads). This area is characterized by a highly columnar arrangement of neurons in layers III–IV, with stacks of medium size pyramidal neurons in layer III. It lacks the separation of layers III–IV seen at other areas bordering on A1. This area did not define the entire lateral border of A1. Typically, at the rostral and caudal ends of A1, more conventional association cortex (areas PaAr and PaAc, respectively (Fullerton and Pandya, 2007)) abutted A1 laterally. Previous authors showed that this area is characterized by dense parvalbumin and acetylcholinesterase staining, and have suggested that it may be a distinct type of primary cortex [area LP (Wallace et al., 2002)], an auditory association area [lateral belt (Sweet et al., 2005)], or alternatively that it may be continuous with the larger primary auditory cortex (Galaburda and Sanides, 1980; Rademacher et al., 1993; Morosan et al., 2001). In the present study we excluded this area from our analysis, because it was clearly anatomically distinct from the larger area A1.
2.4. Neuron density and number in A1
The optical disector method was used to sample neuron density in A1, with separate estimates in layers IIIb-c and V–VI in each hemisphere (Figure 4). Layer IIIb-c was defined as the geometric lower half of the area between layers I and IV, which corresponded closely to layers IIIb-c in well-oriented sections. These layers were selected because their borders were easily identified, even in tangentially cut sections, and because previous authors reported that changes in schizophrenia may be greater in lower layer III (Selemon et al., 1995; Sweet et al., 2004; Kolluri et al., 2005). In every section through A1, each laminar border was traced on a high resolution (146 pixels/mm) photomontage of the section. Using Object-Image software a grid pattern of sampling sites was made for each layer, and the pixel coordinates of the photomontages were aligned to the X–Y coordinates of a motorized microscope stage. At each site a Z-stack of 3 um spaced video images was captured, using a 100X 1.3 N.A. objective, with a Pulnix TM-72EX video camera attached to a Scion LG3 imaging board. A counting box was superimposed on each Z-stack with dimensions X=30um, Y= 30um and Z=24um, and the upper guard zone was 9 um. Cells were counted if the nucleolus came into focus while focusing through the counting frame. Counts were done at the microscope, so that ambiguous neurons could be identified by live viewing. Neurons were identified by the presence of well-stained cytoplasm, a thinner nuclear membrane, and a nucleolus, whereas glia typically had poorly stained cytoplasm, thicker nuclear membranes and inhomogeneous chromatin.
Figure 4.

Micrographs illustrating the methods used to measure neuron density in primary auditory cortex. A. Outlines were made of two laminar divisions of primary auditory cortex. This included the lower half of the total area of layers II-and II, which aligned very well with layers IIIb-c, and combined layer V and VI. The black squares indicate the location of optical disectors, which were distributed in the selected layers in a grid pattern. B. Neuron density was measured with the optical disector method. The disector dimensions (black box) were X=30um, Y= 30um and Z=24um. C. The sampled layers of cortex are shown at higher magnification. Scale bars in A and C = 1mm. Box width in B = 30um.
In each hemisphere, 308+/97 (mean +/− S.D.) cells were counted in layer IIIb-c, and 158+/43 in layer V–VI. Neuron density CEs (Dorph-Petersen, 2009) were 0.06+/− 0.01 (layer III) 0.08+/− 0.02 (layer V–VI). To estimate neuron number, the volume fraction of layers IIIb-c and V–VI were the ratio of the area of the traced layer divided by the area of the total A1 in all sections through A1. Neuron numbers were calculated as = neuron density × volume fraction × whole A1 volume. Neuron number CEs, calculated as in Dorph-Petersen (2009) were 0.06+/− 0.02 (layer IIIb-c) and 0.09+/− 0.02 (layer V/VI).
2.5. Statistical analysis
All statistical analyses were done with PASW statistics, release 18. Brains in Sample A were selected to match the schizophrenia and non-psychiatric brains as closely as possible for age, postmortem interval and time in formalin (Table 1). T-tests for independent samples showed that these variables were not significantly different between groups. However, brain weight was unexpectedly 6% larger in the schizophrenia sample, at trend-level significance (p = 0.07, two-tailed t-test). Therefore diagnostic comparisons used brain weight as a covariate in a mixed-model analysis of covariance (ANCOVA) in which between subject comparisons included diagnosis, and within-subject comparisons included the two hemispheres, and the two layers in the case of neuron density. All ANCOVA and t-test comparisons met Kolomograv-Smirnov criteria for normal distribution, with the exception of HG volumes. The latter were evaluated with the semi-parametric Generalized Estimating Equation (GEE), using brain weight as a covariate, and their group differences in hemispheric asymmetry were evaluated by comparing asymmetry indices as described below for sample B. Differences between left and right hemispheres independent of diagnosis were done using paired t-tests.
In sample B, the schizophrenia and nonpsychiatric brains had significantly different postmortem intervals, and times in formalin (Table 2). Therefore, diagnostic comparisons in sample B evaluated only hemispheric asymmetries. Asymmetry was expressed as an asymmetry index defined as = (left−right)/(0.5×(left+right)), and asymmetry indices were compared between diagnostic groups by independent samples t-tests. Percent differences were similarly calculated as = 100 × (A−B)/(0.5×(A+B)), where A and B are the values being compared, with the exception of diagnostic group comparisons that were expressed as = 100 × (schizophrenia − control)/control.
3. Results
Two separate comparison samples were used for anatomical measurements. Sample A was from younger (age = 51 +/− 17 years) schizophrenia and nonpyschiatric subjects that were closely matched for histological and demographic variables (Table 1). In sample B the subjects were older (age = 74 +/− 12 years), and the diagnostic groups were not closely matched for postmortem interval and time in formalin (Table 2). Therefore, diagnostic comparisons in sample B were limited to comparisons of hemispheric asymmetry.
3.1. HG volumes
In every hemisphere, the borders of HG were identified by viewing digital images of the 0.96mm spaced coronal sections, as well as 3-dimensional reconstructions and photographs of the original tissue samples (Figure 1). To assess the reliability of the HG volume measurements, they were made by 2 different raters (J.S. and C.B.). This revealed occasional discrepancies in the placement of the HG borders, usually due to ambiguity in differentiating Heschl’s sulcus from a sulcus intermedius, or with localization of the anterior border of HG in cases where it had a gradual transition to the rostral superior temporal plane. However, in most cases the identification of HG was unambiguous, and the single measure inter-rater correlation coefficient (ICC) revealed good measurement reproducibility in both the left (ICC = 0.92; N = 37) and right (ICC = 0.93) hemispheres.
HG volumes and asymmetries did not differ between schizophrenia and nonpsychiatric samples (Table 3). In brain sample A, the GEE analysis did not show diagnostic differences (p = 0.83), and the asymmetry index was not significantly different (p = 0.21) between schizophrenia (asymmetry index = 0.10 +/− 0.13) and non-psychiatric (asymmetry index = 0.14 +/− 0.28) samples. In sample B, the asymmetry index was not significantly different (p = .63) between the schizophrenia (asymmetry index = 0.37 +/−0 .22) and non-psychiatric samples (asymmetry index = 0.30 +/− 0.33).
Table 3.
Summary of anatomical measurements.
| Variable [Mean %CV*] | Left Hemisphere
|
Right Hemisphere
|
Hemispheric comparisons*** | |||||||
|---|---|---|---|---|---|---|---|---|---|---|
| Cntr | SZ | % diff. ** | Cntr | SZ | % diff. | Asymmetry Index | p-value | |||
| Mean (%CV) | Mean (%CV) | Mean (%CV) | Mean (%CV) | |||||||
|
|
|
|
||||||||
| HG volumes, mm3 [24%] | ||||||||||
| Brain Sample A | 1,006 (30%) | 1,085 (23%) | 8 | 849 (17%) | 986 (24%) | 16 | 0.12 | 0.02 | ||
| Brain Sample B | 812(24%) | 747 (22%) | −8 | 610 (30%) | 510 (23%) | −16 | 0.34 | <0.0001 | ||
| A1 volumes, mm3 [32%] | ||||||||||
| Brain Sample A | 392 (32%) | 379 (36%) | −3 | 387 (32%) | 396 (29%) | 2 | −0.03 | 0.83 | ||
| Brain Sample B | 376 (22%) | 371 (33%) | −1 | 315 (32%) | 290 (38%) | −8 | 0.22 | 0.02 | ||
| A1 Neuron density, cells per cubic millimeter [13%] | ||||||||||
| Sample A, LIIIb-c | 60,497 (12%) | 63,377 (9%) | 5 | 59,663 (11%) | 60,114 (11%) | 1 | 0.03 | 0.29 | ||
| Sample A, LV-VI | 53,951 (19%) | 53,106 (11%) | −2 | 58,396 (13%) | 55,574 (14%) | −5 | −0.06 | 0.06 | ||
| Sample B, LIIIb-c | 77,590 (16%) | 72,224 (11%) | −7 | 74,403 (17%) | 72,096 (15%) | −3 | 0.03 | 0.41 | ||
| Sample B, LV-VI | 66,725 (16%) | 65,186 (17%) | −2 | 65,289 (9%) | 67,261 (9%) | 3 | −0.01 | 0.72 | ||
| A1 Neuron number, cells ×106 [32%] | ||||||||||
| Sample A, LIIIb-c | 4.87 (35%) | 4.99 (37%) | 3 | 4.77 (29%) | 4.94 (29%) | 4 | 0.00 | 0.53 | ||
| Sample A, LV-VI | 5.54 (42%) | 4.98 (36%) | −10 | 5.50 (28%) | 5.56 (32%) | −1 | −0.07 | 0.78 | ||
| Sample B, LIIIb-c | 6.01 (25%) | 5.50 (25%) | −9 | 4.66 (32%) | 4.37 (37%) | −6 | 0.25 | 0.02 | ||
| Sample B, LV-VI | 5.50 (25%) | 5.45 (30%) | −1 | 4.23 (34%) | 4.49 (35%) | 6 | 0.24 | 0.02 | ||
| Approximated total A1 Neuron number, cells × 106 [28%]**** | ||||||||||
| Brain Sample A | 23.6 (37%) | 24.0 (28%) | 2 | 22.8 (29%) | 23.8 (29%) | 4 | 0.01 | 0.78 | ||
| Brain Sample B | 29.0 (24%) | 26.1 (24%) | −10 | 23.2 (33%) | 20.4 (35%) | −12 | 0.25 | 0.01 | ||
%CV = 100* Standard Deviation/Mean.
% diff. = Percent difference between diagnostic groups. Negative values indicate lower value in schizophrenia.
Hemispheric comparisons include brains from both diagnostic groups. Asymmetry index = (left−right)/(0.5×(left+right)). Positive values indicate left>right asymmetry. P-values are left right comparison using paired t-tests. See text for diagnostic comparison p-values.
Neuron number approximated by extrapolating LIIIb-c neuron density to whole cortex.
HG volumes displayed significant left>right asymmetry in both samples A (p = 0.02, paired t-test) and sample B (p<0.0001; Table 3). Like the volumes of A1 (described below), the asymmetry index of HG in sample B (0.34 +/− 0.27) was unexpectedly greater than that of sample A (0.12 +/− 0.21; p < 0.05, independent samples t-test).
3.2. A1 volumes
The boundaries of A1 were identified by cytoarchitectonic features in 0.96mm spaced Nissl-stained sections (see Methods, and Figures 2–3). Ambiguities were sometimes encountered at all borders, and most commonly at the rostral border (i.e., at the border nearest to the rostro-lateral tip of HG), which in some cases was seen as a gradual transition that extended across several millimeters. To assess measurement reproducibility, a single rater (J.S.) marked the borders of A1 and then, after a delay of more than 6 months, repeated the process in 31 of the 37 brains. The final 6 brains were measured only in the second session. The single-measure intra-rater correlation coefficient was 0.68 (N = 31) in the left hemisphere, and 0.79 in the right. Stated differently, the average difference between measurements was 16+/−13 % (mean +/− S.D.), and in about one-fourth of the hemispheres (15 of 62), the difference was greater than 25%. The overall measurement reproducibility was similar in the brains from sample A (17 +/− 13%) and sample B (15 +/− 13%). In the brains that were measured twice, the final analyses of A1 volumes used the average of the first and second measurements.
In both samples A and B, A1 volumes and asymmetries were very similar in the schizophrenia and non-psychiatric brains (Table 3). In sample A, two-way ANCOVA did not show group differences (F(1,18) = 0.07, P = .80) or group × hemisphere interactions (F(1,18) = 0.62, P = .44). In sample B, the asymmetry index was very similar (p = 0.78) in schizophrenia (asymmetry index = 0.25 +/−0 .38) and nonpsychiatric brains (asymmetry index = 0.20 +/− 0.35).
A1 volumes displayed significant left>right asymmetry in samples B (p = 0.02, paired t-test) but not sample A (p<0.83; Table 3). The A1 asymmetry index in sample B (0.22 +/− 0.35) differed significantly from that of sample A (−0.03 +/− 0.34; p < 0.05).
3.3. Neuron density and number in A1
Neuron density and number were measured separately in layers 3b-c and in layers V–VI (Figure 4, Table 3). In sample A, neuron density was not significantly different between diagnostic groups (F(1,18) = 0.32, P = .58; group × layer × hemisphere ANCOVA), and there were no significant interactions with diagnosis. Hemispheric comparisons showed a trend-level right > left asymmetry in layers V–VI (p < 0.06, paired t-test) that was similar in nonpsychiatric and schizophrenia brains (asymmetry indices = 0.05 and 0.08, respectively). In sample B, neuron density did not show significant asymmetry in either layer (Table 3), and the asymmetry index was not different between schizophrenia and nonpsychiatric subjects (p = 0.44 in IIIb-c; p = 0.46 in layers V–VI).
Neuron number in sample A did not show differences between schizophrenia and non-psychiatric brains (F(1,18) = 0.01, P = .92), nor was there significant hemispheric asymmetry (Table 3). In sample B, there was a significant left>right asymmetry of neuron number, consistent with the asymmetry of A1 volumes (Table 3), and the asymmetry index was very similar in schizophrenia and nonpsychiatric subjects (p = 0.43 in IIIb-c; p = 0.49 in layers V–VI).
We did not directly estimate neuron number of total A1, but it is useful to report an approximation, derived by multiplying A1 volumes by layers IIIb-c neuron densities (Table 3). At least in parietal cortex, neuron density in lower layer III provides a good approximation of total neuron density (Smiley et al., 2012). This calculation suggests that human primary auditory cortex in each hemisphere has about 20–30 ×106 neurons.
3.4. Asymmetry differences between samples A and B
In addition to greater asymmetry, sample B had decreased volumes and increased neuron density compared to sample A. Previous studies found that increased neuron density is not caused by advanced age in human cerebral cortex (Pakkenberg et al., 2003). An alternative explanation is that lengthy formalin fixation caused shrinkage of the brains in sample B. However, it is not expected that lengthy fixation would cause greater hemispheric asymmetry in sample B. Indeed, our estimates of neuron density and number indicate that the asymmetry in sample B was not due to differential tissue shrinkage. Another possible explanation is that the greater asymmetry in sample B is caused by age-associated cell loss. Correlation analyses, that compared asymmetry indices (of HG and A1 volumes, neuron density or number) with histological and demographic variables (age, brain weight, postmortem interval and time in formalin) showed a trend-level positive correlation of HG asymmetry with age, but also with time in formalin (p-values < 0.1, N = 37). We were unable to further separate these effects, because age and time in formalin were highly correlated in our sample (p < 0.01).
4. Discussion
4.1. Main findings
Comparisons of schizophrenia and non-psychiatric brains did not show differences in volumes of HG or A1, or neuron density or number in A1. These findings are consistent with previous measurements in these brains, that showed only subtle cortical thinning in the caudal left planum temporale in schizophrenia (Smiley et al., 2009; Smiley et al., 2011). With respect to hemispheric asymmetry, HG was larger in the left than right hemisphere, similar to the asymmetry of the planum temporale (Smiley et al., 2009). A1 volume asymmetry was found in only in our brain sample B, which also had comparatively greater HG asymmetry. The reason for the difference between samples is unclear, but may be related to the advanced age of subjects in sample B. Overall, the findings suggest that A1 asymmetry contributes to HG asymmetry, but may be smaller and less consistent than that of HG.
4.2. Heschl’s gyrus: Normal asymmetry, and comparison to A1
Our finding that the left HG is larger than the right is consistent with a number of previous studies that showed left > right differences, often in the range of 10–30%, using postmortem tissue (Chance et al., 2008) or in vivo MRI (Penhune et al., 1996; McCarley et al., 2002; Sumich et al., 2002; Dorsaint-Pierre et al., 2006; Takahashi et al., 2006; Golestani et al., 2007; Salisbury et al., 2007). Other studies, including some with large sample sizes, did not report hemispheric asymmetry of HG [e.g.. (Kulynych et al., 1995; Frangou et al., 1997; Schneider et al., 2002; Knaus et al., 2006)]. It is likely that this discrepancy can be attributed, at least partially, to the various methods used to define the borders of HG. For example, some studies that did not find HG asymmetry used the method of Steinmetz et al. (Steinmetz et al., 1989). This method always extends the rostral-lateral end of HG to the crest of the lateral suclus, and includes tissue on both sides of a sulcus intermedius when it is near the rostral end of HG. We used a modified version of the method of Penhune (1996). This method in some cases terminates the end of HG when it becomes indistinguishable from the rostral temporal plane, and excludes cortex lateral to the intermediate sulcus if the latter extends to the crest of the lateral sulcus. A previous study that also compared HG and A1 volumes used the method of Steinmetz described above, and this may explain the approximately 2-fold greater HG volumes compared to our (shrinkage corrected) HG volumes (Rademacher et al., 2001b). It should be emphasized that neither definition of HG is known to correspond precisely to functional areas. We selected our method because previous studies that used similar definitions were more likely to report normal hemispheric asymmetry of HG (Penhune et al., 1996; Dorsaint-Pierre et al., 2006; Golestani et al., 2007) and altered volumes in schizophrenia (McCarley et al., 2002; Sumich et al., 2002; Takahashi et al., 2006; Salisbury et al., 2007).
The left > right HG volume could be due to an expansion of existing cytoarchitectonic areas in the left, or inclusion of more areas. HG asymmetry is probably not explained by higher neuron density in the right hemisphere. Our neuron density measurements confined to A1 showed very similar values in the two hemispheres. Although we only measured selected layers, our previous experience suggests that the hemispheric asymmetry of neuron density is unlikely to deviate substantially between layers (Smiley et al., 2011; Smiley et al., 2012). We are aware of two previous studies that compared left and right neuron densities of HG. Morosan et al. (Morosan et al., 2001) used an automated image processing method, and Cotter et al. (Cotter et al., 2004) used 3-dimensional cell counting methods, with left and right hemispheres obtained from different individuals. Neither study found hemispheric differences of neuron density.
The asymmetry of HG volumes is not due to thicker cortex in the left hemisphere, as shown by previous measurements in these same brains (Smiley et al., 2009). Another study also did not find hemispheric asymmetry of cortical thickness in HG (Morosan et al., 2001). This conclusion is further supported by the observation that the asymmetry of HG surface area was proportional to its volume asymmetry (Chance et al., 2008): together, these measurements predict similar cortical thickness in the two hemispheres.
In the present study we queried whether the volume asymmetry of A1 contributes to HG asymmetry. Unexpectedly, we obtained different results in our 2 brain samples. Sample A lacked A1 asymmetry, but in sample B it was striking (21% left>right). Sample A also had less HG asymmetry (13%) than sample B (33%), and in a previous study had less planum temporale asymmetry (6%) compared to sample B [12%; (Smiley et al., 2009)]. We were unable to definitively identify an explanation for the greater asymmetry in sample B. One possibility is that the advanced age of brain donors in sample B (mean age 74 years, compared to 55 in sample A) caused gray matter loss preferentially in the right hemisphere. In whole cortex, neuron loss between these ages could be 10% or more, at least in male brains that were the subject of our study (Pelvig et al., 2008). There is precedence for a hemispheric selectivity of gray matter loss with aging (Raz et al., 2004), but we are unaware of studies that evaluated auditory areas in individuals over 70. In summary, while our measurements of A1 show a large (21%) hemispheric difference in sample B, the lack of a similar asymmetry in sample A suggests that A1 asymmetry is less consistent than HG asymmetry, and may be conditionally dependent on age.
A previous study systematically compared the volumes of A1 and HG in 27 postmortem brains, and concluded that neither structure was consistently asymmetric (Rademacher et al., 2001b). That study differed from ours in several respects. In contrast to our sample of male brains, their sample was about half female, and they showed that A1 volumes were more asymmetric in their male brains (Rademacher et al., 2001a). Additionally, their definition of HG differed from ours (as discussed above), and their definition of the primary auditory cortex (their Te1), identified by an automated image processing method, included a volume (average = 1600 mm3) that was about twice that of our A1 (average shrinkage corrected volume = 774 mm3). Our A1 corresponds more closely to the koniocortex mapped by Fullerton and Pandya (Fullerton and Pandya, 2007), who also reviewed the findings of Rademacher (Rademacher et al., 2001b) and concluded that the central subdivision of Te1 (Te1.0) may corresponds most closely to koniocortex, whereas the rostral and caudal parts (Te1.1 and Te1.2) may partially include association areas. While our methods differ from those of Rademacher et al. (Rademacher et al., 2001b), it is notable that both studies found evidence of A1 asymmetry in male brains.
Besides the different definitions of A1 used by different researchers, measurements of A1 volumes are complicated by inter-individual variability in its cytoarchitectonic appearance. In their classic descriptions, von Economo et al. noted that the appearance of A1 (their area TC) can be quite variable, and in at least some cases TC does not form a completely closed area, but has bands and islands of the surrounding area TB that reach over its boundaries (von Economo and Koskinas, 1925; von Economo and Horn, 1930). More recently, Fullerton and Pandya (Fullerton and Pandya, 2007) divided A1 into 4 sub-areas, oriented roughly into parallel stripes extending along the length of HG. In preliminary mappings, we were able to confirm the features of these sub-area in at least some brains. However, like von Economo et al., we also encountered some brains in which A1 appeared to have a patchy distribution, with islands of non-koniocortex, or cortex with intermediate appearance (referred to as “TBC”, by von Economo et al.). This variability contributed to the poor replication of our A1 volumes, which was pronounced in about one-fourth of the hemispheres. Other authors have employed additional histochemical labels to identify A1, for example including parvalbumin immunolabeling, acetylcholinesterase, and myelin staining [e.g., (Rivier and Clarke, 1997; Hackett et al., 2001; Wallace et al., 2002; Sweet et al., 2005)]. While these labels often confirm the borders identified in Nissl-stain, our experience with these labels is that Nissl staining provides the best resolution for identifying A1 boundaries.
4.3. HG and A1 volume changes in schizophrenia
Several in vivo MRI studies reported decreased volume of HG in schizophrenia (Rojas et al., 1997; Dickey et al., 1999; Hirayasu et al., 2000; McCarley et al., 2002; Sumich et al., 2002; Kasai et al., 2003; Crespo-Facorro et al., 2004; Takahashi et al., 2006; Salisbury et al., 2007). Positive findings included bilateral decreases, but on average the left HG reductions (~16%) were greater than those on the right (~11%) [reviewed in (Smiley, 2009)]. Other MRI studies found unchanged HG volumes in schizophrenia, even though some included large sample sizes (Barta et al., 1997; Frangou et al., 1997; Kwon et al., 1999; Yamasue et al., 2004). We are aware of only one previous postmortem study of HG volumes in schizophrenia, which reported non-significant decreases of about 10% in the left HG, with unchanged volumes in the right HG (Chance et al., 2008). Thus, the more common published finding is reduced HG volume in schizophrenia. It is possible that our finding of unchanged HG reflects a sampling bias, due to high normal variance in HG volumes, and perhaps due to inconsistent volume loss in subtypes of schizophrenia. Alternatively, it is possible that the reduced cortical volume measured in vivo does not fully persist in postmortem preparations.
Our finding of unchanged A1 volume in schizophrenia is consistent with a recent study that measured A1 volumes in the left hemisphere (Dorph-Petersen et al., 2009). Those authors identified A1 using a combination of Nissl staining, parvalbumin immmunolabeling, and acetylcholinesterase histochemistry (Sweet et al., 2005). From their descriptions, it is possible that their study used a more exclusive definition of A1, possibly corresponding more closely to the most granular sub-area Km1 of by Fullerton and Pandya (2007). Nevertheless, like our results, they concluded that the volume of A1 was not significantly altered in schizophrenia.
Consistent with unaltered A1 volumes, neuron density and number in layers IIIb-c and V–VI also were not different in schizophrenia. This is similar to our previous finding of unchanged neuron density in schizophrenia in the planum temporale in these brains (Smiley et al., 2011), and in HG by Cotter et al (Cotter et al., 2004). Another study found increased density of pyramidal-shaped neurons in layer III of A1, and we cannot exclude the possibility that our measurement of all neurons overlooked changes in this neuron subpopulation (Dorph-Petersen et al., 2009).
4.4. Conclusions
In schizophrenia, our measurements did not reveal altered volumes of HG or A1 in either hemisphere, or altered neuron density in A1. With respect to hemispheric asymmetry, measurements of HG demonstrated left > right asymmetry, consistent with previous studies. Parallel measurements of A1 volumes showed asymmetry only in one of two brain samples. When present, the asymmetry of A1 was not explained by differences in neuron density or cortical width, and did correspond to greater neuron number in the left hemisphere. Thus, it is likely that the HG asymmetry partially reflects asymmetry of A1, which occupies nearly half of its cortical volume. Additional studies are needed to define more precisely how age and gender influence the asymmetry of the auditory areas on HG.
Acknowledgments
Supported by the Stanley Medical Research Foundation, and NIH grants DC04318, MH067138, MH64168 and MH085208.
Footnotes
Publisher's Disclaimer: This is a PDF file of an unedited manuscript that has been accepted for publication. As a service to our customers we are providing this early version of the manuscript. The manuscript will undergo copyediting, typesetting, and review of the resulting proof before it is published in its final citable form. Please note that during the production process errors may be discovered which could affect the content, and all legal disclaimers that apply to the journal pertain.
Literature cited
- Barta PE, Pearlson GD, Brill LB, Royall R, McGilchrist IK, Pulver AE, Powers RE, Casanova MF, Tien AY, Frangou S, Petty RG. Planum temporale asymmetry reversal in schizophrenia: replication and relationship to gray matter abnormalities. American Journal of Psychiatry. 1997;154:661–667. doi: 10.1176/ajp.154.5.661. [DOI] [PubMed] [Google Scholar]
- Bendor D, Wang X. Cortical representations of pitch in monkeys and humans. Current Opinion in Neurobiology. 2006;16:391–399. doi: 10.1016/j.conb.2006.07.001. [DOI] [PMC free article] [PubMed] [Google Scholar]
- Bush EC, Allman JM. The scaling of frontal cortex in primates and carnivores. Proceedings of the National Academy of Science U S A. 2004;101:3962–3966. doi: 10.1073/pnas.0305760101. [DOI] [PMC free article] [PubMed] [Google Scholar]
- Chance SA, Casanova MF, Switala AE, Crow TJ. Minicolumnar structure in Heschl’s gyrus and planum temporale: Asymmetries in relation to sex and callosal fiber number. Neuroscience. 2006;143:1041–1050. doi: 10.1016/j.neuroscience.2006.08.057. [DOI] [PubMed] [Google Scholar]
- Chance SA, Casanova MF, Switala AE, Crow TJ. Auditory cortex asymmetry, altered minicolumn spacing and absence of ageing effects in schizophrenia. Brain. 2008;131:3178–3192. doi: 10.1093/brain/awn211. [DOI] [PMC free article] [PubMed] [Google Scholar]
- Cotter D, Mackay D, Frangou S, Hudson L, Landau S. Cell density and cortical thickness in Heschl’s gyrus in schizophrenia, major depression and bipolar disorder. British Journal of Psychiatry. 2004;185:258–259. doi: 10.1192/bjp.185.3.258. [DOI] [PubMed] [Google Scholar]
- Crespo-Facorro B, Kim JJ, Chemerinski E, Magnotta V, Andreasen NC, Nopoulos P. Morphometry of the superior temporal plane in schizophrenia: relationship to clinical correlates. Journal of Neuropsychiatry and Clinical Neurosciences. 2004;16:284–294. doi: 10.1176/jnp.16.3.284. [DOI] [PubMed] [Google Scholar]
- Dickey CC, McCarley RW, Voglemaier MM, Niznikiewicz MA, Seidman LJ, Hirayasu Y, Fischer I, Teh EK, van Rhoads R, Jakab M, Kikinis R, Jolesz FA, Shenton ME. Schizotypal personality disorder and MRI abnormalities of temporal lobe gray matter. Biological Psychiatry. 1999;45:1393–1402. doi: 10.1016/s0006-3223(99)00030-x. [DOI] [PMC free article] [PubMed] [Google Scholar]
- Dorph-Petersen KA, Delevich KM, Marcsisin MJ, Zhang W, Sampson AR, Gundersen HJ, Lewis DA, Sweet RA. Pyramidal neuron number in layer 3 of primary auditory cortex of subjects with schizophrenia. Brain Research. 2009;1285:42–57. doi: 10.1016/j.brainres.2009.06.019. [DOI] [PMC free article] [PubMed] [Google Scholar]
- Dorsaint-Pierre R, Penhune VB, Watkins KE, Neelin P, Lerch JP, Bouffard M, Zatorre RJ. Asymmetries of the planum temporale and Heschl’s gyrus: relationship to language lateralization. Brain. 2006;129:1164–1176. doi: 10.1093/brain/awl055. [DOI] [PubMed] [Google Scholar]
- Dwork A, Liu D, Kaufman M, Prohovnik I. Archival, formalin-fixed tissue: its use in the study of Alzheimer’s type changes. Clinical Neuropathology. 1998;17:45–49. [PubMed] [Google Scholar]
- Formisano E, Kim DS, Di Salle F, van de Moortele PF, Ugurbil K, Goebel R. Mirror-symmetric tonotopic maps in human primary auditory cortex. Neuron. 2003;40:859–869. doi: 10.1016/s0896-6273(03)00669-x. [DOI] [PubMed] [Google Scholar]
- Frangou S, Sharma T, Sigmudsson T, Barta P, Pearlson G, Murray RM. The Maudsley family study 4. Normal planum temporale asymmetry in familial schizophrenia. British Journal of Psychiatry. 1997;170:328–333. doi: 10.1192/bjp.170.4.328. [DOI] [PubMed] [Google Scholar]
- Fullerton BC, Pandya DN. Architectonic analysis of the auditory-related areas of the superior temporal region in human brain. Journal of Comparative Neurology. 2007;504:470–498. doi: 10.1002/cne.21432. [DOI] [PubMed] [Google Scholar]
- Galaburda A, Sanides F. Cytoarchitectonic organization of the human auditory cortex. Journal of Comparative Neurology. 1980;190:597–610. doi: 10.1002/cne.901900312. [DOI] [PubMed] [Google Scholar]
- Golestani N, Molko N, Dehaene S, LeBihan D, Pallier C. Brain structure predicts the learning of foreign speech sounds. Cerebral Cortex. 2007;17:575–582. doi: 10.1093/cercor/bhk001. [DOI] [PubMed] [Google Scholar]
- Gundersen HJ, Jensen EB, Kieu K, Nielsen J. The efficiency of systematic sampling in stereology--reconsidered. Journal of Microscopy. 1999;193:199–211. doi: 10.1046/j.1365-2818.1999.00457.x. [DOI] [PubMed] [Google Scholar]
- Hackett TA. Anatomical organization of the auditory cortex. Journal of the American Academy of Audiology. 2008;19:774–779. doi: 10.3766/jaaa.19.10.5. [DOI] [PubMed] [Google Scholar]
- Hackett TA, Preuss TM, Kaas JH. Architectonic identification of the core region in auditory cortex of macaques, chempanzees, and humans. Journal of Comparative Neurology. 2001;441:197–222. doi: 10.1002/cne.1407. [DOI] [PubMed] [Google Scholar]
- Hirayasu Y, McCarley RW, Salizbury DF, Tanaka S, Kwon JS, Frumin M, Snyderman D, Yurgelun-Todd D, Kikinis R, Jolesz FA, Shenton ME. Planum temporale and Heschl gyrus volume reduction in schziophrenia. Archives of General Psychiatry. 2000;57:692–699. doi: 10.1001/archpsyc.57.7.692. [DOI] [PMC free article] [PubMed] [Google Scholar]
- Howard MA, Volkov IO, Mirsky R, Garell PC, Noh MD, Granner M, Damasio H, Steinschneider M, Reale RA, Hind JE, Brugge JF. Auditory cortex on the human posterior superior temporal gyrus. Journal of Comparative Neurology. 2000;416:79–92. doi: 10.1002/(sici)1096-9861(20000103)416:1<79::aid-cne6>3.0.co;2-2. [DOI] [PubMed] [Google Scholar]
- Kasai K, Shenton ME, Salisbury DF, Hirayasu Y, Lee CU, Ciszewski AA, Yurgelun-Todd D, Kikinis R, Jolesz FA, McCarley RW. Progressive decrease of left superior temporal gyrus gray matter volume in patients with first-episode schizophrenia. American Journal of Psychiatry. 2003;160:156–164. doi: 10.1176/appi.ajp.160.1.156. [DOI] [PMC free article] [PubMed] [Google Scholar]
- Keilp JG, Waniek C, Goldman RG, Zemishlany Z, Alexander GE, Gibbon M, Wu A, Susser E, Prohovnik I. Reliability of post-mortem chart diagnoses of schizophrenia and dementia. Schizophrenia Research. 1995;17:221–228. doi: 10.1016/0920-9964(94)00092-m. [DOI] [PubMed] [Google Scholar]
- Kelly TM, Mann JJ. Validity of DSM-III-R diagnosis by psychological autopsy: a comparison with clinician ante-mortem diagnosis. Acta Psychiatrica Scandinavica. 1996;94:337–343. doi: 10.1111/j.1600-0447.1996.tb09869.x. [DOI] [PubMed] [Google Scholar]
- Knaus TA, Bollich AM, Corey DM, Lemen LC, Foundas AL. Variability in perisylvian brain anatomy in healthy adults. Brain and Language. 2006;97:219–232. doi: 10.1016/j.bandl.2005.10.008. [DOI] [PubMed] [Google Scholar]
- Kolluri N, Sun Z, Sampson AR, Lewis DA. Lamina-specific reductions in dendritic spine density in the prefrontal cortex of subjects with schizophrenia. American Journal of Psychiatry. 2005;162:1200–1202. doi: 10.1176/appi.ajp.162.6.1200. [DOI] [PubMed] [Google Scholar]
- Kulynych JJ, Vladar K, Fantie BD, Jones DW, Weinberger DR. Normal asymmetry of the planum temporale in patients with schizophrenia. British Journal of Psychiatry. 1995;166:742–749. doi: 10.1192/bjp.166.6.742. [DOI] [PubMed] [Google Scholar]
- Kwon JS, McCarley RW, Hirayasu Y, Anderson JE, Fischer IA, Kikinis R, Jolesz FA, Shenton ME. Left planum temporale volume reduction in schizophrenia. Archives of General Psychiatry. 1999;56:142–148. doi: 10.1001/archpsyc.56.2.142. [DOI] [PubMed] [Google Scholar]
- Langers DR, van Dijk P. Mapping the Tonotopic Organization in Human Auditory Cortex with Minimally Salient Acoustic Stimulation. Cerebral Cortex. 2012 doi: 10.1093/cercor/bhr282. [DOI] [PMC free article] [PubMed] [Google Scholar]
- Liegeois-Chauvel C, Musolino A, Chauvel P. Localization of the primary auditory area in man. Brain. 1991;114:139–153. [PubMed] [Google Scholar]
- McCarley RW, Salisbury DF, Hirayasu Y, Yurgelun-Todd DA, Tohen M, Zarate C, Kikinis R, Jolesz FA, Shenton ME. Association between smaller left posterior superior temporal gyrus volume on magnetic resonance imaging and smaller left temporal P300 amplitude in first-episode schizophrenia. Archives of General Psychiatry. 2002;59:321–331. doi: 10.1001/archpsyc.59.4.321. [DOI] [PubMed] [Google Scholar]
- Morosan P, Rademacher J, Schleicher A, Amunts K, Schormann T, Zilles K. Human primary auditory cortex: cytoarchitectonic subdivisions and mapping into a spatial reference system. Neuroimage. 2001;13:684–701. doi: 10.1006/nimg.2000.0715. [DOI] [PubMed] [Google Scholar]
- Pakkenberg B, Pelvig D, Marner L, Bundgaard MJ, Gundersen HJ, Nyengaard JR, Regeur L. Aging and the human neocortex. Experimental Gerontology. 2003;38:95–99. doi: 10.1016/s0531-5565(02)00151-1. [DOI] [PubMed] [Google Scholar]
- Pantev C, Bertrand O, Eulitz C, Verkindt C, Hampson S, Schuierer G, Elbert T. Specific tonotopic organizations of different areas of the human auditory cortex revealed by simultaneous magnetic and electric recordings. Electroencephalography and Clinical Neurophysiology. 1995;94:26–40. doi: 10.1016/0013-4694(94)00209-4. [DOI] [PubMed] [Google Scholar]
- Pelvig DP, Pakkenberg H, Stark AK, Pakkenberg B. Neocortical glial cell numbers in human brains. Neurobiology of Aging. 2008;29:1754–1762. doi: 10.1016/j.neurobiolaging.2007.04.013. [DOI] [PubMed] [Google Scholar]
- Penhune VB, Zatorre RJ, MacDonald JD, Evans AC. Interhemispheric anatomical differences in human primary auditory cortex: probabilistic mapping and volume measurement from magnetic resonance scans. Cerebral Cortex. 1996;6:661–672. doi: 10.1093/cercor/6.5.661. [DOI] [PubMed] [Google Scholar]
- Rademacher J, Caviness VS, Steinmetz H, Galaburda AM. Topographical variation of the human primary cortices: Implications for neuroimaging, brain mapping and neurobiology. Cerebral Cortex. 1993;3:313–329. doi: 10.1093/cercor/3.4.313. [DOI] [PubMed] [Google Scholar]
- Rademacher J, Morosan P, Schleicher A, Freund HJ, Zilles K. Human primary auditory cortex in women and men. Neuroreport. 2001a;12:1561–1565. doi: 10.1097/00001756-200106130-00010. [DOI] [PubMed] [Google Scholar]
- Rademacher J, Morosan P, Schormann T, Schleicher A, Werner C, Freund HJ, Zilles K. Probabilistic mapping and volume measurment of human primary auditory cortex. Neuroimage. 2001b;13:669–683. doi: 10.1006/nimg.2000.0714. [DOI] [PubMed] [Google Scholar]
- Raz N, Gunning-Dixon F, Head D, Rodrigue KM, Williamson A, Acker JD. Aging, sexual dimorphism, and hemispheric asymmetry of the cerebral cortex: replicability of regional differences in volume. Neurobiology of Aging. 2004;25:377–396. doi: 10.1016/S0197-4580(03)00118-0. [DOI] [PubMed] [Google Scholar]
- Rivier F, Clarke S. Cytochrome oxidase, acetylcholinesterase, and NADPHD-diaphorase staining in human supratemporal and insular cortex: Evidence for multiple auditory areas. Neuroimage. 1997;6:288–304. doi: 10.1006/nimg.1997.0304. [DOI] [PubMed] [Google Scholar]
- Rojas DC, Teale P, Sheeder J, Simon J, Reite M. Sex-specific expression of Heschl’s gyrus functional and structural abnormalities in paranoid schizophrenia. American Journal of Psychiatry. 1997;154:1655–1662. doi: 10.1176/ajp.154.12.1655. [DOI] [PubMed] [Google Scholar]
- Salisbury DF, Kuroki N, Kasai K, Shenton ME, McCarley RW. Progressive and interrelated functional and structural evidence of post-onset brain reduction in schizophrenia. Archives of General Psychiatry. 2007;64:521–529. doi: 10.1001/archpsyc.64.5.521. [DOI] [PMC free article] [PubMed] [Google Scholar]
- Schneider P, Scherg M, Dosch HG, Specht HJ, Gutschalk A, Rupp A. Morphology of Heschl’s gyrus reflects enhanced activation in the auditory cortex of musicians. Nature Neuroscience. 2002;5:688–694. doi: 10.1038/nn871. [DOI] [PubMed] [Google Scholar]
- Selemon LD, Rajkowska G, Goldman-Rakic PS. Abnormally high neuronal density in the schizophrenic cortex. Archives of General Psychiatry. 1995;52:805–818. doi: 10.1001/archpsyc.1995.03950220015005. [DOI] [PubMed] [Google Scholar]
- Shenton ME, Dickey CC, Frumin M, McCarley RW. A review of MRI findings in schizophrenia. Schizophrenia Research. 2001;49:1–52. doi: 10.1016/s0920-9964(01)00163-3. [DOI] [PMC free article] [PubMed] [Google Scholar]
- Slomianka L, West MJ. Estimators of the precision of stereological estimates: an example based on the CA1 pyramidal cell layer of rats. Neuroscience. 2005;136:757–767. doi: 10.1016/j.neuroscience.2005.06.086. [DOI] [PubMed] [Google Scholar]
- Smiley JF. Auditory cortex anatomy and asymmetry in schizophrenia. In: Lajtha A, editor. Handbook of Neurochemistry and Molecular Neurobiology. 3. Springer; New York: 2009. pp. 353–382. Schizophrenia. [Google Scholar]
- Smiley JF, Konnova K, Bleiwas C. Cortical thickness, neuron density and size in the inferior parietal lobe in schizophrenia. Schizophrenia Research. 2012;136:43–50. doi: 10.1016/j.schres.2012.01.006. [DOI] [PubMed] [Google Scholar]
- Smiley JF, Rosoklija G, Mancevski B, Mann JJ, Dwork AJ, Javitt DC. Altered volume and hemispheric asymmetry of the superficial cortical layers in the schizophrenia planum temporale. European Journal of Neuroscience. 2009;30:449–463. doi: 10.1111/j.1460-9568.2009.06838.x. [DOI] [PMC free article] [PubMed] [Google Scholar]
- Smiley JF, Rosoklija G, Mancevski B, Pergolizzi D, Figarsky K, Bleiwas C, Javitt DC, Dwork AJ. Hemispheric comparisons of neuron density in the planum temporale of schizophrenia and nonpsychiatric brains. Psychiatric Research: Neuroimaging. 2011;192:1–11. doi: 10.1016/j.pscychresns.2010.11.007. [DOI] [PMC free article] [PubMed] [Google Scholar]
- Steinmetz H, Rademacher J, Huang Y, Heftter H, Zilles K, thron A, Freund HJ. Cerebral asymmetry: MR planimetry of the human planum temporale. J Computer Assisted Tomography. 1989;13:996–1005. [PubMed] [Google Scholar]
- Steinmetz H, Rademacher J, Jancke L, Huang Y, Thron A, Zilles K. Total surface of temporoparietal intrasylvian cortex: Diverging left-right asymmetries. Brain and Language. 1990;39:357–372. doi: 10.1016/0093-934x(90)90145-7. [DOI] [PubMed] [Google Scholar]
- Sumich A, Chitnis XA, Fannon DG, O’Ceallaigh S, Doku VC, Falrowicz A, Marshall N, Matthew VM, Potter M, Sharma T. Temporal lobe abnormalities in first-episode psychosis. American Journal of Psychiatry. 2002;159:1232–1235. doi: 10.1176/appi.ajp.159.7.1232. [DOI] [PubMed] [Google Scholar]
- Sweet RA, Bergen SE, Sun Z, Sampson AR, Pierri JN, Lewis DA. Pyramidal cell size reduction in schizophrenia: evidence for involvement of auditory feedforward circuits. Biological Psychiatry. 2004;55:1128–1137. doi: 10.1016/j.biopsych.2004.03.002. [DOI] [PubMed] [Google Scholar]
- Sweet RA, Dorph-Petersen KA, Lewis DA. Mapping auditory core, lateral belt, and parabelt cortices in the human superior temporal gyrus. Journal of Comparative Neurology. 2005;491:270–289. doi: 10.1002/cne.20702. [DOI] [PubMed] [Google Scholar]
- Takahashi T, Suzuki M, Zhou SY, Tanino R, Hagino H, Kawasaki Y, Matsui M, Seto H, Kurachi M. Morphologic alterations of the parcellated superior temporal gyrus in schizophrenia spectrum. Schizophrenia Research. 2006;83:131–143. doi: 10.1016/j.schres.2006.01.016. [DOI] [PubMed] [Google Scholar]
- von Economo C, Horn L. Uber Windungsrelief, MaBe und Rindenarchitektonik der superatemporalflache, ihre individuellen und ihre seitenunterschiede. Z ges Neurol Psychiatr. 1930;130:678–755. [Google Scholar]
- von Economo C, Koskinas GH. Die cytoarchitektonik der Hirnrinde des Erwachsenen Menschen. Springer; Wien-Berlin: 1925. [Google Scholar]
- Wallace MN, Johnston PW, Palmer AR. Histochemical identification of cortical areas in the auditory region of the human brain. Experimental Brain Research. 2002;143:499–508. doi: 10.1007/s00221-002-1014-z. [DOI] [PubMed] [Google Scholar]
- Yamasue H, Yamada H, Yumoto M, Kamio S, Kudo N, Uetsuki M, Abe O, Fukuda R, Aoki S, Ohtomo K, Iwanami A, Kato N, Kasai K. Abnormal association between reduced magnetic mismatch field to speech sounds and smaller left planum temporale volume in schizophrenia. Neuroimage. 2004;22:720–727. doi: 10.1016/j.neuroimage.2004.01.042. [DOI] [PubMed] [Google Scholar]