Abstract
The predictive value of longitudinal biomarker data (vascular endothelial growth factor (VEGF), soluble VEGF receptor (sVEGFR)-2, sVEGFR-3, and soluble stem cell factor receptor (sKIT)) for tumor response and survival was assessed based on data from 303 patients with imatinib-resistant gastrointestinal stromal tumors (GIST) receiving sunitinib and/or placebo treatment. The longitudinal tumor size data were well characterized by a tumor growth inhibition model, which included, as significant descriptors of tumor size change, the model-predicted relative changes from baseline over time for sKIT (most significant) and sVEGFR-3, in addition to sunitinib exposure. Survival time was best described by a parametric time-to-event model with baseline tumor size and relative change in sVEGFR-3 over time as predictive factors. Based on the proposed modeling framework to link longitudinal biomarker data with overall survival using pharmacokinetic–pharmacodynamic models, sVEGFR-3 demonstrated the greatest predictive potential for overall survival following sunitinib treatment in GIST.
Sunitinib malate (SUTENT, Pfizer, NY) is an oral multitargeted tyrosine kinase inhibitor with antitumor and antiangiogenic properties. Sunitinib acts by inhibition of vascular endothelial growth factor receptors (VEGFR-1, VEGFR-2, and VEGFR-3), platelet-derived growth factor receptors (PDGFR-α and PDGFR-β), stem cell factor receptor (KIT), Fms-like tyrosine kinase-3 receptor (FLT3), colony stimulating factor receptor type 1 (CSF-1 R), and the glial cell line derived neurotrophic factor receptor (RET).1,2,3,4 Sunitinib is currently approved in e.g., the United States and Europe for the treatment of advanced renal cell carcinoma, imatinib-resistant gastrointestinal stromal tumors (GIST), and pancreatic neuroendocrine tumors.
With the introduction of new approaches for treating cancer, i.e., targeted therapies, the need for new approaches to identify an effective dose and to assess treatment response has evolved. Using the traditional concept of maximum-tolerated dose is not appropriate for these agents because clinically effective dose could be achieved in advance of manifest toxicity.5 Furthermore, the use of the standard Response Evaluation Criteria in Solid Tumors6 and tumor shrinkage as criteria for treatment response may be problematic. Antiangiogenic drugs are typically cytostatic in their mechanism of action and consequently tumor reduction may be a less valuable index of efficacy.5
Identification of (causal path) biomarkers could enable dose optimization and monitoring of response based on the changes in levels. The identified biomarker relationships could also be used to increase the understanding of the mechanism of action, demonstrate proof of concept in early phases of drug development, and enable individualization of ongoing treatment.7
Mechanism-based biomarkers known to change with sunitinib treatment are the vascular endothelial growth factor (VEGF) and soluble fragments, generated by proteolytic cleavage, of the KIT (sKIT) and VEGF receptors (sVEGFR-2 and sVEGFR-3).8,9,10,11 Although tumor size at the start of treatment and changes in tumor size from baseline at weeks 7 or 8 have previously been proposed as predictors of survival in various tumor types and treatments,12,13,14,15,16 there is the potential that these tumor measures could serve as mechanism-independent biomarkers in sunitinib-treated patients. However, as stated previously, sunitinib has a cytostatic mechanism of action, and potentially a lower effect on tumor size could be expected.17
To identify clinically relevant outcome predictors and determine their optimal time for measurement, an understanding of the underlying exposure–biomarker–effect relationship over time is essential. The use of pharmacokinetic–pharmacodynamic (PKPD) models can enable simultaneous analysis of both longitudinal biomarker and survival data. The entire time course of individual changes can then be used to assess relationships among biomarkers that may be separated in time.18 In this analysis, exposure–effect relationships were characterized using nonlinear mixed-effects PKPD models to evaluate VEGF, sVEGFR-2, sVEGFR-3, and sKIT as potential predictors of tumor response and subsequent overall survival following sunitinib treatment in GIST (Figure 1).
Figure 1.
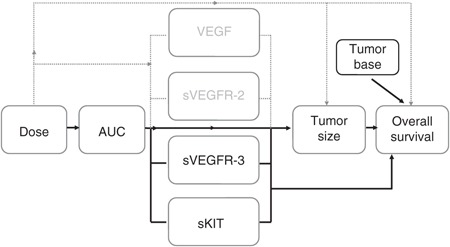
Investigated relationships for the evaluation of vascular endothelial growth factor (VEGF), soluble VEGF receptor (sVEGFR)-2, sVEGFR-3, and soluble stem cell factor receptor (sKIT) as biomarkers of tumor response and overall survival following sunitinib treatment in gastrointestinal stromal tumors (GIST). Solid lines indicate relationships included in the final models, and dashed lines indicate relationships investigated but not included in the final models.
Results
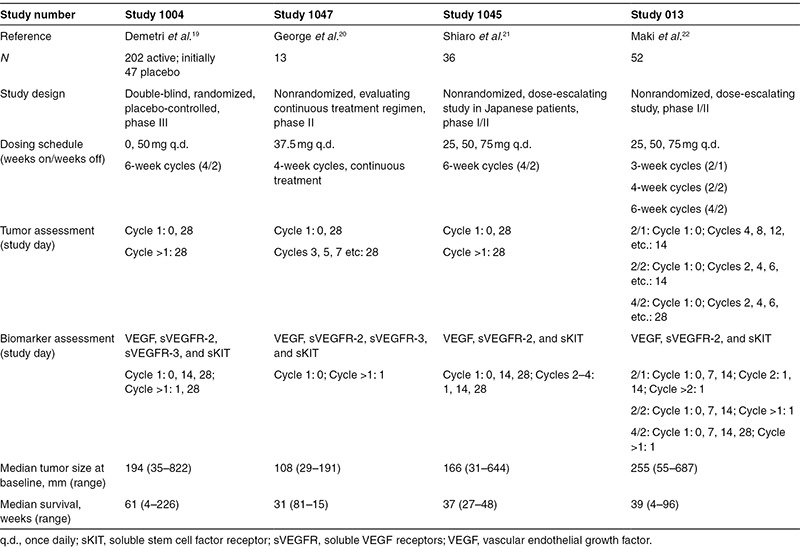
Data on sunitinib exposure (area under the concentration–time curve, AUC), biomarkers, tumor size (sum of longest diameters of target lesions, SLD), and overall survival from four clinical studies, which comprised a total of 303 patients with imatinib-resistant GIST, were available for PKPD analysis (Table 1).The patients had received sunitinib (25–75 mg orally) and/or placebo in a 4/2, 2/2, 2/1 (weeks on/weeks off), or continuous treatment schedule.
Table 1. Data summary of the analyzed studies.
Biomarker models
The plasma concentrations of the biomarkers VEGF, sVEGFR-2, and sVEGFR-3 changed in a cyclic manner in response to therapy, returning to near-baseline levels during off-treatment periods, whereas the levels of sKIT continuously decreased over time. The biomarker time courses (BM(t)) were adequately described by indirect response models with sigmoid Imax (VEGF, sVEGFR-2) or Imax (sKIT, sVEGFR-3) drug effect relationships (Figure 2, Table 2). The maximum inhibitory effect (Imax) was not significantly different from 1 and was fixed to 1 in the subsequent analysis, assuming that maximum receptor inhibition was possible to achieve. Sunitinib acted to decrease the zero-order production rate (Kin) of sVEGFR-2, sVEGFR-3, and sKIT (Eq. 1) and to inhibit the degradation (Kout) of VEGF (Eq. 2). The observed increases from baseline (biomarker at time 0, BM0) in VEGF (change in objective function value or ΔOFV = 52.4) and sKIT (ΔOFV = 31.8) concentrations over time in untreated patients were described by a linear disease progression model dependent on time (DP(t)) with a common parameter (DPslope; Eq. 3).
Figure 2.
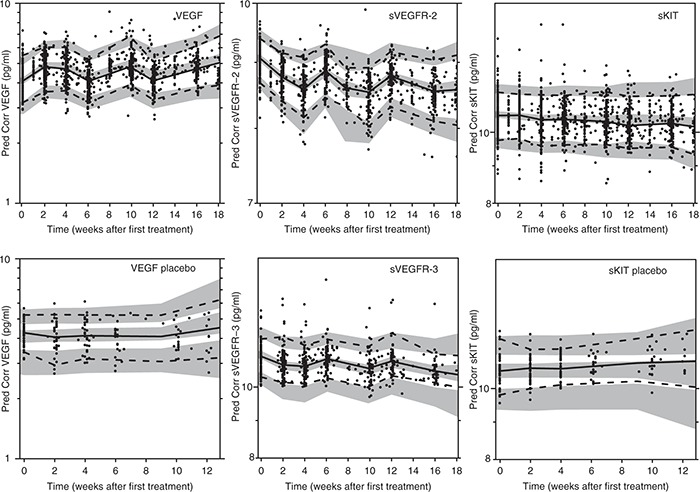
Prediction-corrected visual predictive checks of final biomarker models based on 500 simulations (upper panels: vascular endothelial growth factor (VEGF), soluble VEGF receptor (sVEGFR)-2, and soluble stem cell factor receptor (sKIT); lower panels: VEGF placebo, sVEGFR-3, and sKIT placebo). Observed prediction-corrected biomarker data (open circles (•)), median of the observed data (solid line (—)), 5th and 95th percentiles of the observed data (dashed line (---)), and 95% confidence intervals based on corresponding percentiles of the simulated data (shaded areas).
Table 2. Final biomarker model parameter estimates (relative SEs, %).

The final model was simplified to include a common drug potency parameter (the daily sunitinib AUC resulting in half of the maximum drug effect, IC50) for all the four biomarkers that were found to be highly correlated for VEGF, sVEGFR-2, and sVEGFR-3 (75–92%). The magnitude of interindividual variability in mean residence time (MRT = 1/Kout) for VEGF, sVEGFR-2, and sVEGFR-3 was quantified using a common variability term due to the high correlation (Table 2). Data on sVEGFR-3 was not available for two of the studies, in total 69 patients (Table 1). sVEGFR-2 and sVEGFR-3 were highly correlated for IC50 (92%) and sVEGFR-2, sVEGFR-3, and VEGF were 100% correlated in terms of mean residence time. An individual's VEGF and sVEGF-2 levels therefore provided information on sVEGFR-3 responses if data were missing, i.e., typical values of sVEGFR-3 were not used as predictors for those individuals with missing data. The time course of sKIT was different compared with that of the other evaluated biomarkers with a longer mean residence time (101 days vs. 3.8–23 days), and the variability in IC50 was higher. An adequate predictive performance of the biomarker model is illustrated by a prediction-corrected visual predictive check (VPC) in Figure 2. A slight underprediction at later time points is seen for sKIT in placebo-treated patients, which may be due to drop out of patients with progressing disease.
Model for tumor growth inhibition
The data on longitudinal tumor size following placebo and sunitinib treatment were characterized by a tumor growth inhibition model,12 as described by Eq. 4. The model accounts for the underlying tumor growth dynamics (KG), sunitinib-exposure-driven tumor shrinkage (KDrug), and resistance development/tumor regrowth (R(t)). In this analysis, KBM, which represents the tumor size reduction rate constant related to biomarker response, was also evaluated as predictor in the model. The observed tumor size at baseline (Y0) was incorporated as a covariate acknowledging residual error (ε) in the measurement.19
 |
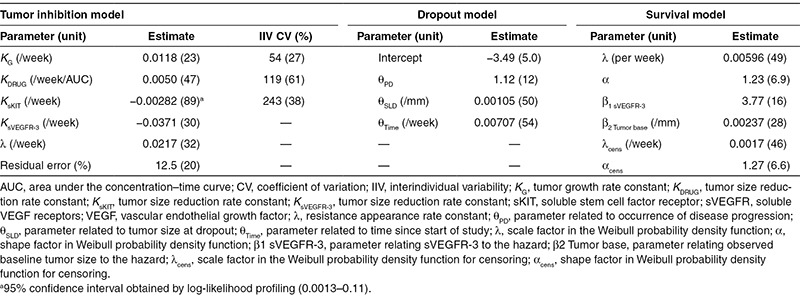
Model-predicted sunitinib daily AUC and relative changes over time of sKIT and sVEGFR-3 were found to be the best descriptors of the change in tumor size (Table 3). In a univariate analysis, the predicted relative change in sKIT over time described the longitudinal tumor size data statistically significantly better than dose, sunitinib daily AUC, or any of the other biomarkers. The univariate model improved significantly when AUC and predicted relative change in sVEGFR-3 were also incorporated as multivariate predictors. The high relative standard error for KsKIT (89%, Table 3) was investigated by log-likelihood profiling to ensure that the 95% confidence interval did not include zero (0.0013–0.11).
Table 3. Final tumor growth inhibition, dropout, and survival model parameter estimates (relative standard errors, %).
Dropout model
A dropout model was developed to enable prospective simulations of tumor response over time because dropout was not completely at random (those with larger tumor sizes and/or a poorer tumor response were more likely to drop out after the measurement). The final logistic regression model describing the probability of dropping out (P) included three significant predictors with the estimated parameters related to time since start of study (ΘTime), observed SLD at dropout (ΘSLD) and a >20% increase in tumor size since nadir (yes/no; ΘPD; Eq. 5, Table 3). P was scaled by the time interval (ΔTIME, typically 6 weeks) to calculate the probability of dropout between two scheduled tumor assessments (PDropout).
 |
The simulation-based model evaluation comparing observed time course of dropout and the model predicted showed a reasonable description of the data (results not shown). A VPC of the final longitudinal tumor growth inhibition model, taking into account dropout in the simulations, is presented in Figure 3 and shows good predictive performance of the tumor growth inhibition model. VPCs stratified for treatment schedule are available in Supplementary Figure S1 online.
Figure 3.
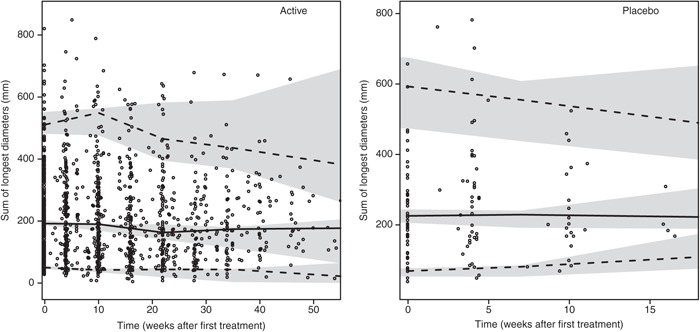
Visual predictive checks based on 500 simulations of the final longitudinal growth inhibition model for actively treated (left) and placebo-treated (right) patients taking into account dropout in the simulations. Observed data (open circles (•)), median of the observed data (solid line (—)), 5th and 95th percentiles of the observed data (dashed line (---)), and 95% confidence intervals based on corresponding percentiles of the simulated data (shaded areas). Visual predictive checks (VPCs) stratified for treatment schedule are available in Supplementary Figure S1 online.
Survival model
All of the investigated biomarkers and tumor size measures were statistically significant predictors of overall survival when tested one by one. However, when the model-predicted relative change from baseline for sVEGFR-3, sVEGFR-3REL (most significant predictor with ΔOFV of 51.6), and baseline tumor size were included, none of the other variables, including AUC, achieved statistical significance (Eq. 6). A Weibull model (λ, hazard coefficient; α shape factor) characterized the underlying baseline hazard that increased with time (α = 1.23, Table 3, Eq. 6). Smaller decreases in sVEGFR-3 and larger baseline tumor size were associated with an increased risk of death. A clear improvement in the model fit, in terms of OFV, was observed when using the predicted time course instead of a (landmark) point estimate of change in biomarker levels or tumor size at 6 or 12 weeks.
Evaluation of the capability to predict survival based on early changes in biomarker response showed that using the model-predicted changes in sVEGFR-3 based on longitudinal biomarker data from only the first 6 or 12 weeks of treatment (on average, 3.1 or 4.4 measurements per individual) resulted in a similar fit of the survival model as when using the full time course of sVEGFR-3 (ΔOFV ≤ 3). These results indicate that few sVEGFR-3 measurements in the first 12 weeks of treatment may be sufficient to predict the probability of survival given the model. The VPC of the survival model with a Kaplan–Meier plot of the observed survival data, stratified by above/below median of baseline tumor size and sVEGFR-3REL, overlaid with the simulated 95% confidence interval, shows a good predictive performance (Figure 4).
Figure 4.
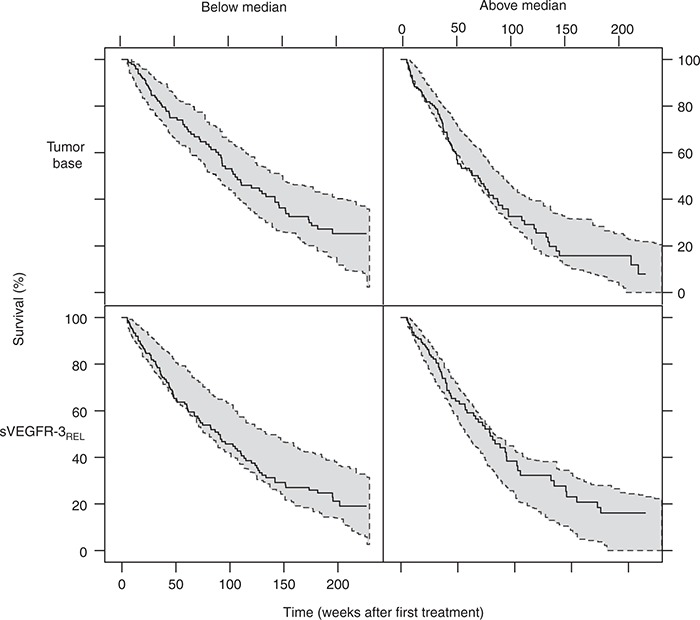
Kaplan–Meier plot of overall survival data (blue line) and 95% prediction intervals (shaded area, 200 simulations) of the Kaplan–Meier plot stratified by above- and below-median baseline tumor size (upper panel) and sVEGFR-3REL (lower panel). Median baseline tumor size: 195 mm, median decrease at steady state in soluble vascular endothelial growth factor receptor (sVEGFR)-3REL: −0.32. Censoring was described by a Weibull model (λ = 0.0017, α = 1.3) and applied in the simulations.
Discussion
This PKPD analysis investigated drug exposure–biomarker–tumor size and survival relationships following sunitinib treatment in imatinib-resistant GIST with the aim of identifying relevant predictors of tumor response and overall survival. The soluble proteins sKIT and sVEGFR-3 were found to be most predictive of tumor size, whereas sVEGFR-3 and baseline tumor size were predictive of overall survival.
The biomarker time courses were successfully characterized empirically by indirect response models where sunitinib inhibited the production of sVEGFR-2, sVEGFR-3, and sKIT and inhibited degradation of VEGF. The mechanistic rationale behind these biomarker modulations following sunitinib treatment is not fully understood. A proposed mechanism that is supported by this model is the reduction in VEGF clearance from blood, resulting in an increase in VEGF levels.20 Other hypotheses include release of VEGF from existing pools in tissue or an increased production of VEGF in response to hypoxia.20 GIST patients are predominantly KIT positive and the observed decrease in sKIT levels could be a result of a reduced number of viable tumor cells in treated patients.9 The reduced levels of circulating soluble receptor VEGFR-2 has been demonstrated by in vitro experiments as a result of VEGF-mediated downregulation of VEGFR-2,21 a putative mechanism also supported by this model.
Lindauer et al.22 described an indirect response model with inhibition of Kin for sVEGFR-2 response in healthy volunteers treated with 50 mg of sunitinib for five consecutive days. In the current analysis, the baseline levels of sVEGFR-2 appear to be similar in healthy volunteers and patients, but the estimated mean residence time was four times longer, which may be a result of the longer treatment period.
The tumor size dynamics following sunitinib treatment were characterized using a previously developed tumor growth inhibition model.12 The model has been applied to a wide range of clinical data.13,14,16 In this example, data from placebo-treated patients were also described. The tumor model was part of a modeling framework developed to predict survival in phase III oncology trials based on the predicted change in tumor size phase II data.12 The change in tumor size at week 7 and the tumor size at baseline were identified as predictors of overall survival in colorectal cancer. In addition, a relationship between survival and the model-predicted change in tumor size at 8 weeks and baseline tumor size has been established in non-small-cell lung carcinoma.15 Our analysis is an extension to the previous efforts in the area. Here, the dynamic change in the predictors was accounted for, in contrast to the models proposed by Wang15 and Claret,12 where constant value predictors were adopted. In our analysis, the change in tumor size was also a significant predictor of overall survival. However, the studied biomarkers provided a statistically improved description of the survival data. When sVEGFR-3 was related to survival, there was no additional improvement by incorporation of tumor size. Sunitinib primarily exhibits a cytostatic rather than a cytotoxic effect,17 and change in tumor size not being an important predictor of survival is not surprising. This may also explain why sKIT was the most significant descriptor of tumor size when biomarker response was linked to longitudinal tumor data but was not found to be a good predictor of overall survival.
The finding that sVEGFR-3 response was the most important predictor of survival in this longitudinal model-based approach differs from a previous report where sKIT was shown to be the most important biomarker of time to progression and overall survival in sunitinib-treated GIST.23 However, the previous results were based on a traditional statistical analysis using discrete (landmark) time points. The time course of sVEGFR-2, sVEGFR-3, and VEGF are schedule dependent and vary widely within a treatment schedule. Consequently, the time point chosen to study the biomarker relationship will be highly influential on the eventual findings. In this example, we developed a modeling framework that allowed integration of the whole biomarker time course and the response. Furthermore, the use of a parametric time-to-event model also allowed simulations of the clinical outcome. The developed model enables predictions of survival for different doses and schedules. To evaluate the strengths and weaknesses of these alternative schedules, side effects should also be considered. In a companion article, we expand this framework to also include PKPD models of important side effects.24 The established relationship may also enable monitoring of clinical response and facilitate dose individualization because few sVEGFR-3 measurements in the first 6 or 12 weeks of therapy appear to be required to predict survival given the reported model. Further prospective studies are, however, needed to validate the findings and to determine whether sVEGFR-3 can be a relevant biomarker in other sunitinib indications, such as renal cell carcinoma, and in treatments with other tyrosine kinase inhibitors.
Furthermore, the developed framework may be also applied to other molecules and indications, but the “best” predictors may vary and will depend on the disease and the mechanism of drug action. Such a framework is currently being constructed in renal cell carcinoma following administration of axitinib.25
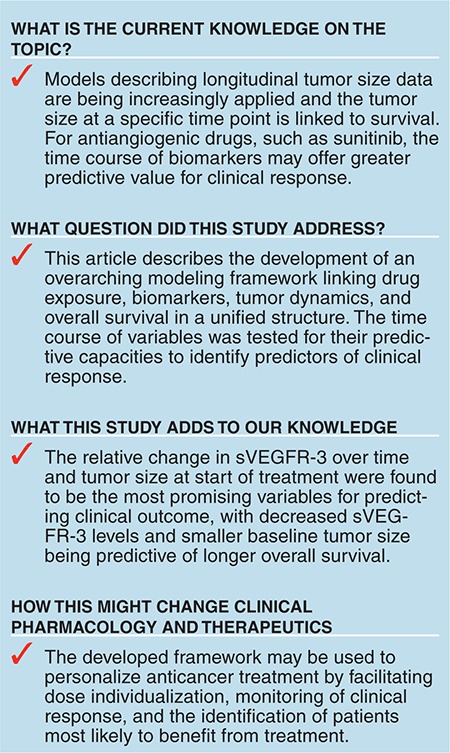
In summary, an overarching modeling framework was developed linking exposure, biomarkers, tumor dynamics, and overall survival in a unified structure. sVEGFR-3 was found to be the most promising variable for predicting clinical outcome in terms of overall survival following sunitinib treatment in GIST.
Methods
Patients and study design. The analysis included biomarker, tumor, and treatment outcome data obtained from four clinical trials in phases I–III comprising 303 patients with imatinib-resistant malignant GIST treated with single-agent sunitinib26,27,28,29 (Table 1). Only patients with biomarker and tumor data available after screening were included. Sunitinib doses ranged from 25 to 75 mg orally once daily and were administered according to one of four different treatment schedules: 4/2, 2/2, 2/1 (weeks on/weeks off), and continuous treatment. The largest study (1,004) was a randomized placebo-controlled trial, where patients receiving placebo (n = 47) were offered sunitinib on development of disease progression as defined by Response Evaluation Criteria in Solid Tumors.6 Measurements of biomarkers and tumor sizes were collected for up to 1 year of treatment or until no clinical benefit. All studies were conducted according to the Declaration of Helsinki and approved by the local ethics committees. Signed informed consent was obtained from all patients before enrollment.
Model development. The population PKPD analysis was performed using the nonlinear mixed-effects modeling approach in NONMEM (version 7.2, gFortran version 4.5.0 Gnu compiler collection).30 The first-order conditional estimation method with interaction and, when appropriate, the Laplacian estimation method were used for parameter estimation. The R-based software Xpose (version 4)31 was applied for graphical diagnostics, and the PsN toolkit (version 3)32,33 was used for postprocessing of results and execution of simulations.
Interindividual variability was assumed to be log-normally distributed with a mean of zero and a variance of ω2. Unexplained residual variability was explored using additive, proportional, and combined (additive + proportional) residual error models or additive and combined error models on log-transformed scale (biomarkers). Model discrimination included comparison of the OFV and inspection of graphical diagnostics. A significance level of P < 0.01 was applied corresponding to a decrease in OFV of at least 6.63 when an extra parameter was added.
The predictive performance of the final biomarker and tumor model were evaluated using (prediction-corrected) VPCs.34 Prediction intervals with 95% confidence intervals were derived from 500 simulated data sets and compared with the observed data. The dropout and survival model were evaluated by creation of Kaplan–Meier plots of observed data overlaid with a 95% confidence interval calculated from 200 simulations of the studies. Imprecision (defined as standard errors) in model parameter estimates were obtained from a nonparametric bootstrap with 200 samples.
The PKPD model–building process resulting in the final model linking the predictors to overall survival was developed in a sequential manner. The different steps are described below.
Pharmacokinetics. Individual parameter estimates or, when no PK information was available (57 patients), typical population parameters obtained from a previously developed PK model35 were used to describe the concentration–time profiles of sunitinib (no data for the equipotent metabolite SU1266 was available) Information on protein binding was also not available. Dose, daily AUC with AUC = 0 during off-treatment periods, or predicted concentration–time profiles were evaluated as exposure measures. AUC was calculated as Dose/(CL/F), where CL/F is the apparent oral plasma clearance.
Biomarker models. Biomarker modulations in placebo-treated patients due to the natural history of the disease were explored and characterized using linear or nonlinear disease progression models. Changes in biomarker concentrations over time were related to sunitinib exposure by indirect response models with linear, inhibitory Emax (Imax), and sigmoid Imax drug effect relationships.36 Modeling was performed on log-transformed biomarker data.
Models for each of the biomarkers were initially developed separately and finally combined into a joint model to explore correlations between the biomarkers and to simplify the model structure (where appropriate). For the joint model, AUC was used as a measure of drug exposure because the complexity of the model resulted in long computational run times. Because the independent parameter estimates for disease progression (DPslope) and the drug exposure resulting in half of Imax (IC50) were similar among the biomarkers when estimated separately, they were evaluated as shared (common) parameters (see Supplementary Data).
Tumor growth inhibition model. The relationship between the biomarkers and tumor size (SLD) was characterized by a tumor growth inhibition model.12 Other tumor growth models were evaluated, including models with Gompertz equation and zero-order tumor growth, but they did not provide a better description of the data. Sunitinib dose, sunitinib daily AUC, the individual model–predicted relative or absolute change from baseline over time, and the absolute value for the different biomarkers (BM(t)) were tested separately or in combination to describe the response.
Dropout model. Prospective tumor model simulations required the frequency and time course of patient dropout from tumor measurements to be taken into account. The exact date of dropout was not available (unless because of death) and was therefore assumed to occur at the time of last available tumor assessment. Observed and predicted baseline SLD, SLD at time of dropout, difference in SLD to baseline, and the change in SLD at dropout since the last assessment were evaluated as factors affecting the probability to drop out over time in a logistic regression model. In addition, a >20% increase in SLD since nadir, time since start of study, dose, AUC, and study were tested for significance. In the simulation-based model evaluation, dosing records were imputed according to protocol until the time of the last observed tumor assessments in each substudy (see Supplementary Data).
Overall survival model. A parametric time-to-event model was developed to explore the relationships between the four biomarkers, tumor size, and overall survival. The exponential, Weibull, log-logistic, extreme value, and Gompertz probability density functions were compared to best describe the observed survival data. Dose, AUC, model-predicted baseline levels of the biomarkers and tumor size, and the relative change over time in tumor size and biomarkers were evaluated as predictors of overall survival. Although there would have been potential value in using the full PK profile as driver for efficacy, the complexity of the framework and the resultant run times severely limited the practicalities of such an approach. The predictors were extrapolated based on developed models until time of death/censoring. Furthermore, a point estimate of the relative change in biomarker levels, in addition to the tumor size at treatment week 6 or 12 (i.e., after completion of one or two treatment cycles), was evaluated to be related to the survival data. In the simulations, censoring, e.g., because of a short follow-up period, was described by a Weibull model (see Supplementary Data).
Author contributions
E.K.H., M.A.A., P.A.M., J.F., M.O.K., and L.E.F. wrote the manuscript. E.K.H., M.A.A., P.A.M., B.E.H., J.F., M.O.K., and L.E.F. designed the research. E.K.H., M.A.A., P.W., J.F., M.O.K., and L.E.F. performed the research. E.K.H. and P.W. analyzed the data.
Conflict of Interest
M.A.A., B.E.H., and P.A.M. are employees of Pfizer Ltd. At the time the work was carried out, J.F. was an employee at Pfizer Ltd. L.E.F. and M.O.K. have acted as paid consultants to Pfizer Ltd. P.W. was supported by a research grant from Pfizer Ltd. As Deputy Editor-in-Chief for CPT: Pharmacometrics & Systems Pharmacology, L.E.F. was not involved in the review or decision process for this article. The other authors declared no conflict of interest.
Study Highlights
Acknowledgments
E.K.H. was supported by the Swedish Cancer Society, Sweden. Parts of the computations were performed on resources provided by the Swedish National Infrastructure for Computing (SNIC) at UPPMAX. Martin Agback at UPPMAX is acknowledged for assistance concerning technical aspects in making NONMEM run on the UPPMAX resources.
Supplementary Material
References
- Abrams T.J., et al. Preclinical evaluation of the tyrosine kinase inhibitor SU11248 as a single agent and in combination with “standard of care” therapeutic agents for the treatment of breast cancer. Mol. Cancer Ther. 2003;2:1011–1021. [PubMed] [Google Scholar]
- Mendel D.B., et al. In vivo antitumor activity of SU11248, a novel tyrosine kinase inhibitor targeting vascular endothelial growth factor and platelet-derived growth factor receptors: determination of a pharmacokinetic/pharmacodynamic relationship. Clin. Cancer Res. 2003;9:327–337. [PubMed] [Google Scholar]
- O'Farrell A.M., et al. SU11248 is a novel FLT3 tyrosine kinase inhibitor with potent activity in vitro and in vivo. Blood. 2003;101:3597–3605. doi: 10.1182/blood-2002-07-2307. [DOI] [PubMed] [Google Scholar]
- Kim D.W., et al. An orally administered multitarget tyrosine kinase inhibitor, SU11248, is a novel potent inhibitor of thyroid oncogenic RET/papillary thyroid cancer kinases. J. Clin. Endocrinol. Metab. 2006;91:4070–4076. doi: 10.1210/jc.2005-2845. [DOI] [PubMed] [Google Scholar]
- Jubb A.M., Oates A.J., Holden S., Koeppen H. Predicting benefit from anti-angiogenic agents in malignancy. Nat. Rev. Cancer. 2006;6:626–635. doi: 10.1038/nrc1946. [DOI] [PubMed] [Google Scholar]
- Eisenhauer E.A., Verweij J. New response evaluation criteria in solid tumors: RECIST Guideline Version 1.1. EJC Supplements. 2009;7:5. doi: 10.1016/j.ejca.2008.10.026. [DOI] [PubMed] [Google Scholar]
- Atkinson A.J., et al. Biomarkers and surrogate endpoints: preferred definitions and conceptual framework. Clin. Pharmacol. Therapeut. 2001;69:89–95. doi: 10.1067/mcp.2001.113989. [DOI] [PubMed] [Google Scholar]
- Norden-Zfoni A., et al. Blood-based biomarkers of SU11248 activity and clinical outcome in patients with metastatic imatinib-resistant gastrointestinal stromal tumor. Clin. Cancer Res. 2007;13:2643–2650. doi: 10.1158/1078-0432.CCR-06-0919. [DOI] [PubMed] [Google Scholar]
- DePrimo S.E., Bello C. Surrogate biomarkers in evaluating response to anti-angiogenic agents: focus on sunitinib. Ann. Oncol. 2007;18 suppl. 10:x11–x19. doi: 10.1093/annonc/mdm409. [DOI] [PubMed] [Google Scholar]
- Kontovinis L.F., Papazisis K.T., Touplikioti P., Andreadis C., Mouratidou D., Kortsaris A.H. Sunitinib treatment for patients with clear-cell metastatic renal cell carcinoma: clinical outcomes and plasma angiogenesis markers. BMC Cancer. 2009;9:82. doi: 10.1186/1471-2407-9-82. [DOI] [PMC free article] [PubMed] [Google Scholar]
- Motzer R.J., et al. Activity of SU11248, a multitargeted inhibitor of vascular endothelial growth factor receptor and platelet-derived growth factor receptor, in patients with metastatic renal cell carcinoma. J. Clin. Oncol. 2006;24:16–24. doi: 10.1200/JCO.2005.02.2574. [DOI] [PubMed] [Google Scholar]
- Claret L., et al. Model-based prediction of phase III overall survival in colorectal cancer on the basis of phase II tumor dynamics. J. Clin. Oncol. 2009;27:4103–4108. doi: 10.1200/JCO.2008.21.0807. [DOI] [PubMed] [Google Scholar]
- Claret L., Lu J.F., Sun Y.N., Bruno R. Development of a modeling framework to simulate efficacy endpoints for motesanib in patients with thyroid cancer. Cancer Chemother. Pharmacol. 2010;66:1141–1149. doi: 10.1007/s00280-010-1449-z. [DOI] [PubMed] [Google Scholar]
- Bruno R., Lu J.F., Sun Y.N., Claret L. A modeling and simulation framework to support early clinical drug development decisions in oncology. J. Clin. Pharmacol. 2011;51:6–8. doi: 10.1177/0091270010376970. [DOI] [PubMed] [Google Scholar]
- Wang Y., et al. Elucidation of relationship between tumor size and survival in non-small-cell lung cancer patients can aid early decision making in clinical drug development. Clin. Pharmacol. Ther. 2009;86:167–174. doi: 10.1038/clpt.2009.64. [DOI] [PubMed] [Google Scholar]
- Lu J.F., et al. Population pharmacokinetic/pharmacodynamic modeling for the time course of tumor shrinkage by motesanib in thyroid cancer patients. Cancer Chemother. Pharmacol. 2010;66:1151–1158. doi: 10.1007/s00280-010-1456-0. [DOI] [PubMed] [Google Scholar]
- Rock E.P., et al. Food and Drug Administration drug approval summary: Sunitinib malate for the treatment of gastrointestinal stromal tumor and advanced renal cell carcinoma. Oncologist. 2007;12:107–113. doi: 10.1634/theoncologist.12-1-107. [DOI] [PubMed] [Google Scholar]
- Ibrahim J.G., Chu H., Chen L.M. Basic concepts and methods for joint models of longitudinal and survival data. J. Clin. Oncol. 2010;28:2796–2801. doi: 10.1200/JCO.2009.25.0654. [DOI] [PMC free article] [PubMed] [Google Scholar]
- Dansirikul C., Silber H.E., Karlsson M.O. Approaches to handling pharmacodynamic baseline responses. J. Pharmacokinet. Pharmacodyn. 2008;35:269–283. doi: 10.1007/s10928-008-9088-2. [DOI] [PubMed] [Google Scholar]
- Bocci G., et al. Increased plasma vascular endothelial growth factor (VEGF) as a surrogate marker for optimal therapeutic dosing of VEGF receptor-2 monoclonal antibodies. Cancer Res. 2004;64:6616–6625. doi: 10.1158/0008-5472.CAN-04-0401. [DOI] [PubMed] [Google Scholar]
- Ebos J.M., et al. Vascular endothelial growth factor-mediated decrease in plasma soluble vascular endothelial growth factor receptor-2 levels as a surrogate biomarker for tumor growth. Cancer Res. 2008;68:521–529. doi: 10.1158/0008-5472.CAN-07-3217. [DOI] [PubMed] [Google Scholar]
- Lindauer A., et al. Pharmacokinetic/pharmacodynamic modeling of biomarker response to sunitinib in healthy volunteers. Clin. Pharmacol. Ther. 2010;87:601–608. doi: 10.1038/clpt.2010.20. [DOI] [PubMed] [Google Scholar]
- Deprimo S.E., et al. Circulating levels of soluble KIT serve as a biomarker for clinical outcome in gastrointestinal stromal tumor patients receiving sunitinib following imatinib failure. Clin. Cancer Res. 2009;15:5869–5877. doi: 10.1158/1078-0432.CCR-08-2480. [DOI] [PMC free article] [PubMed] [Google Scholar]
- Hansson E.K., et al. PKPD modeling of predictors for side effects and overall survival in sunitinib treated patients with gastro intestinal stromal tumor. CPT Pharmacometrics Syst. Pharmacolin press). [DOI] [PMC free article] [PubMed]
- Schindler E., Amantea M., Milligan A.P., Karlsson M.O., Friberg E.L.PKPD-Modeling of VEGF, sVEGFR-1, sVEGFR-2, sVEGFR-3 and tumor size following axitinib treatment in metastatic renal cell carcinoma (mRCC) patientshttp://www.page-meeting.org/?abstract=2859> (2013
- Demetri G.D., et al. Efficacy and safety of sunitinib in patients with advanced gastrointestinal stromal tumour after failure of imatinib: a randomised controlled trial. Lancet. 2006;368:1329–1338. doi: 10.1016/S0140-6736(06)69446-4. [DOI] [PubMed] [Google Scholar]
- George S., et al. Clinical evaluation of continuous daily dosing of sunitinib malate in patients with advanced gastrointestinal stromal tumour after imatinib failure. Eur. J. Cancer. 2009;45:1959–1968. doi: 10.1016/j.ejca.2009.02.011. [DOI] [PubMed] [Google Scholar]
- Shirao K., et al. Phase I/II study of sunitinib malate in Japanese patients with gastrointestinal stromal tumor after failure of prior treatment with imatinib mesylate. Invest. New Drugs. 2010;28:866–875. doi: 10.1007/s10637-009-9306-9. [DOI] [PubMed] [Google Scholar]
- Maki R.G., et al. Results from a continuation trial of SU11248 in patients (pts) with imatinib (IM)-resistant gastrointestinal stromal tumor (GIST). 41 st Annual meeting of the american society of Clinical oncology, Orlando, FL, 13–17 May 2005http://www.asco.org> (2005
- Beal S., Sheiner L.B., Boekmann A., Bauer R.J. NONMEM User's Guides (1989–2006). USA Icon Development Solutions; Ellicott City, MD; 2009. [Google Scholar]
- Jonsson E.N., Karlsson M.O. Xpose–an S-PLUS based population pharmacokinetic/pharmacodynamic model building aid for NONMEM. Comput. Methods Programs Biomed. 1999;58:51–64. doi: 10.1016/s0169-2607(98)00067-4. [DOI] [PubMed] [Google Scholar]
- Lindbom L., Ribbing J., Jonsson E.N. Perl-speaks-NONMEM (PsN)–a Perl module for NONMEM related programming. Comput. Methods Programs Biomed. 2004;75:85–94. doi: 10.1016/j.cmpb.2003.11.003. [DOI] [PubMed] [Google Scholar]
- Lindbom L., Pihlgren P., Jonsson E.N., Jonsson N. PsN-Toolkit–a collection of computer intensive statistical methods for non-linear mixed effect modeling using NONMEM. Comput. Methods Programs Biomed. 2005;79:241–257. doi: 10.1016/j.cmpb.2005.04.005. [DOI] [PubMed] [Google Scholar]
- Bergstrand M., Hooker A.C., Wallin J.E., Karlsson M.O. Prediction-corrected visual predictive checks for diagnosing nonlinear mixed-effects models. AAPS J. 2011;13:143–151. doi: 10.1208/s12248-011-9255-z. [DOI] [PMC free article] [PubMed] [Google Scholar]
- Houk B.E., Bello C.L., Kang D., Amantea M. A population pharmacokinetic meta-analysis of sunitinib malate (SU11248) and its primary metabolite (SU12662) in healthy volunteers and oncology patients. Clin. Cancer Res. 2009;15:2497–2506. doi: 10.1158/1078-0432.CCR-08-1893. [DOI] [PubMed] [Google Scholar]
- Dayneka N.L., Garg V., Jusko W.J. Comparison of four basic models of indirect pharmacodynamic responses. J. Pharmacokinet. Biopharm. 1993;21:457–478. doi: 10.1007/BF01061691. [DOI] [PMC free article] [PubMed] [Google Scholar]
Associated Data
This section collects any data citations, data availability statements, or supplementary materials included in this article.


