Abstract
Diffraction imaging of polystyrene spheres and B16F10 mouse melanoma cells embedded in gel has been investigated with a microscope objective. The diffraction images acquired with the objective from a sphere have been shown to be comparable to the Mie theory based projection images of the scattered light if the objective is translated to defocused positions towards the sphere. Using a confocal imaging based method to reconstruct and analyze the 3D structure, we demonstrated that genetic modifications in these cells can induce morphological changes and the modified cells can be used as an experimental model for study of the correlation between 3D morphology features and diffraction image data.
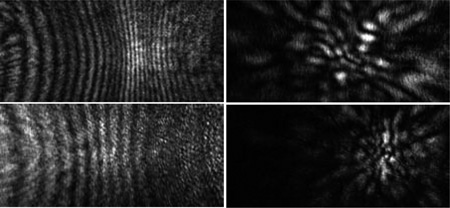
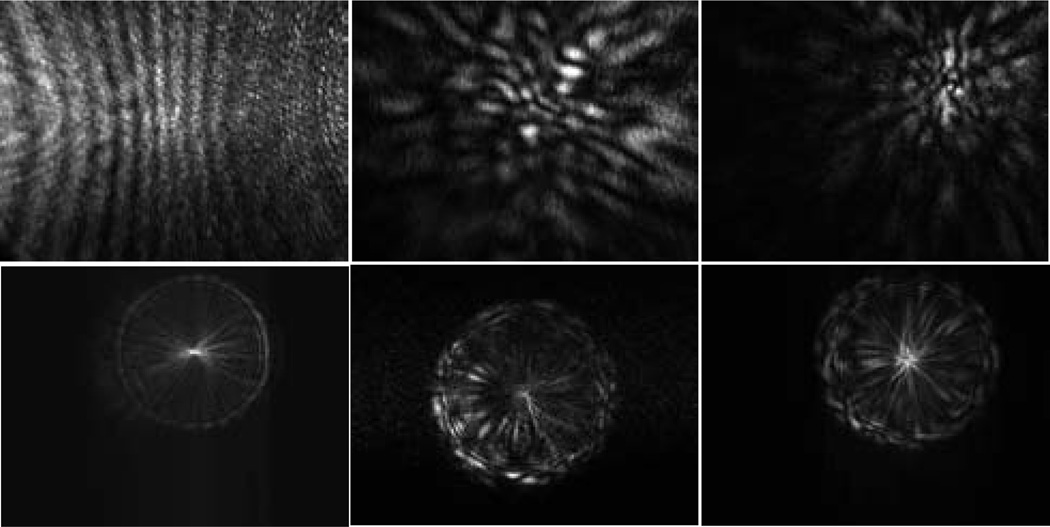
Diffraction images of spheres (left column) and melanoma cells (right column) acquired with an objective.
Keywords: diffraction imaging, light scattering, melanoma cells, cell morphology
1. Introduction
Current flow cytometry technology relies on integrated light signals to extract molecular and limited morphological information for cell differentiation, which requires cell staining. Despite development of angle-resolved scanning and non-coherent imaging methods [1, 2], which is based on two-dimensional (2D) projection of a 3D structure, it remains a challenge to quantitatively extract 3D morphological features from cells with a flow cytometer for characterization and classification. An approach to achieve the desired goal is to extract 3D morphological features of a cell from the spatial distribution of elastically scattered light when a flowing cell is excited by a coherent light beam, typically from a laser. With an imaging detector to record far-field distribution of scattered light intensity, this method shares the same foundation with optical diffraction tomography (ODT) [3]. In ODT multiple diffraction images are acquired at different incident angles with scattered light near the forward direction. For this reason, we term the method of acquiring elastically scattered light as image data in a desired angular region as the diffraction imaging method here. In both cases, the fringe patterns contained in the diffraction images depend on the 3D structure of the specimen, and thus provide the basis for extraction of 3D morphological features. A significant difference, however, lies in the approaches to obtain 3D morphology information. In ODT, the specimen is required to contain weak scatterers or be of low optical density so that the first Born approximation can be used for rapid inversion of multiple diffraction images for 3D reconstruction. By contrast, the diffraction imaging method implemented with a flow cytometer is not aimed at 3D reconstruction. Rather, extraction of 3D features can be realized from one or two diffraction images formed with light scattered in large angles from the forward direction that is expected to strongly correlate with the intracellular structures or optical heterogeneity. Since the size parameters for most mammalian cells are of moderate values, establishing a database of 3D structures and numerically generated diffraction images becomes practical given the availability to accurately model light scattering using efficient algorithms such as the parallel finite-difference-time-domain (FDTD) or parallel discrete dipole approximation methods [4–8]. Under these conditions, pattern recognition algorithms trained by accurate modelling results can be developed for rapid extraction of 3D morphological features from diffraction image data acquired with a flow cytometer.
To develop a diffraction imaging flow cytometer, several hurdles have to be crossed such as acquisition of high-quality diffraction images with an easy-to-align imaging system, development of accurate modelling tools and pattern analysis algorithms. In a conventional flow cytometer, an incident light beam typically propagates through interfaces between the host medium of either air or flow chamber material and the fluid before reaching the target cell carried by the fluid. These interfaces are of large curvatures with mismatched indices of refraction which cause strong spurious scatters coexisting with those due to the cell in a diffraction image. Recently, a beam-in-flow design has been reported in which a laser beam is coupled longitudinally into a waveguide channel acting also as a microfluidic channel [9, 10]. In this approach the laser beam excites the particle carried by a fluid flowing in the waveguide with diffraction image acquisition achieved through an optical window that couples the side scatters directly into a CCD camera. While the beam-in-flow design provides an interesting means to eliminate the spurious scattering noise, several potential problems remain to be solved. One issue relates to a low throughput because diffraction imaging of single particles requires only one particle carried by the longitudinally illuminated flow. Further, the double use of the optical waveguide as a microfluidic channel may present design dilemmas when particle excitation at multiple wavelengths is desired.
We have developed a jet-in-fluid method to obtain high-quality diffraction images with a microscope objective [11]. In this design, a water based laminar flow carrying specimens in the core fluid is injected into a water reservoir held in a glass cuvette before it is collected by an exit needle. The gap space between the injection nozzle and exit needle contains no optical heterogeneity near the specimen. One or more laser beams can be introduced from the plane side surfaces of the cuvette to excite the specimen. A microscope objective and a camera are used to collect and record scattered light distribution from another side of the cuvette with a field-of-view (FOV) far from the cuvette side surfaces. The jet-in-fluid design eliminates the index-mismatched interfaces close to the flowing specimen while preserves the essential features of a conventional flow cytometer that allows high throughput assay and multiple excitation beams.
The use of a microscope objective to relay the scattered light from the flowing specimen to camera enables alignment of the imaging system without an additional microscope. The objective, however, adds considerable complexity in image analysis since modelling of its effect on scattered light distribution requires design parameters which are typically not provided by the objective vendor. More importantly, it is not clear on how to position the objective relative to the focused position defined for non-coherent imaging for acquiring diffraction images that are comparable to theoretical modelling. In this paper we report our investigation of diffraction imaging of single spheres embedded in gel with a microscope objective and comparison with calculated results based on Mie theory. In addition, results of study on two types of B16F10 cells are also presented through diffraction imaging and 3D structure analysis to demonstrate that the morphological changes induced by genetic modifications in these cells can serve as a good model for investigation of the correlation between diffraction images and 3D morphological features.
2. Experimental
2.1 Cell Preparation and Confocal Imaging
The B16F10 cells were derived from a spontaneous melanoma of C57BL/6 mouse [12] and contain large numbers of mitochondria and melanin particles which can have significant effect on distribution of scattered light. Genetic modification of B16F10 cells can lead to cell morphological change and variation in melanin content in the cells, providing an interesting experimental model for study of correlation between diffraction image data and morphological features of the cells. B16F10 cells originally from the American Type Culture Collection (ATCC) were cultured in DMEM medium with 10% fetal bovine serum in a tissue culture incubator. Genetic modification of B16F10 cells was done by stably transducing the cells with the GPR4 gene (B16/GPR4) or the MSCV-IRES-GFP expression vector (B16/vector). After the cells reach 70–80% confluence, they were detached and re-suspended in the DMEM medium. The cells were separated into two different groups with one for diffraction imaging without staining and the other double stained for confocal imaging using one dye for nuclei (SYTO 61, Invitrogen) and one for mitochondria (Mito-Tracker Orange, Invitrogen). After incubation in culture media with the two dyes for 30 minutes, the cells were brought to a confocal microscope (LSM510, Zeiss) for imaging.
We have acquired stacks of confocal images from cells randomly selected from the cultured B16/GPR4 and B16/vector cells to study their morphology features including volumes of cytoplasm, nucleus and mitochondria. Care was taken to ensure that the cells were settled in the media between glass covers before images were taken to reduce possible cell motion during imaging. Each image stack consists of about 40 slices with 0.5 µm step size along the z-axis. A 3D reconstruction software has been developed based on our previous work [6]. The software can generate the 3D structure of the cells in a compressed data format for numerical modeling of light scattering and in standard stl format for viewing. Details of the 3D reconstruction techniques and statistical analysis of morphological features will be reported elsewhere.
2.2 Diffraction Imaging of Single Particles
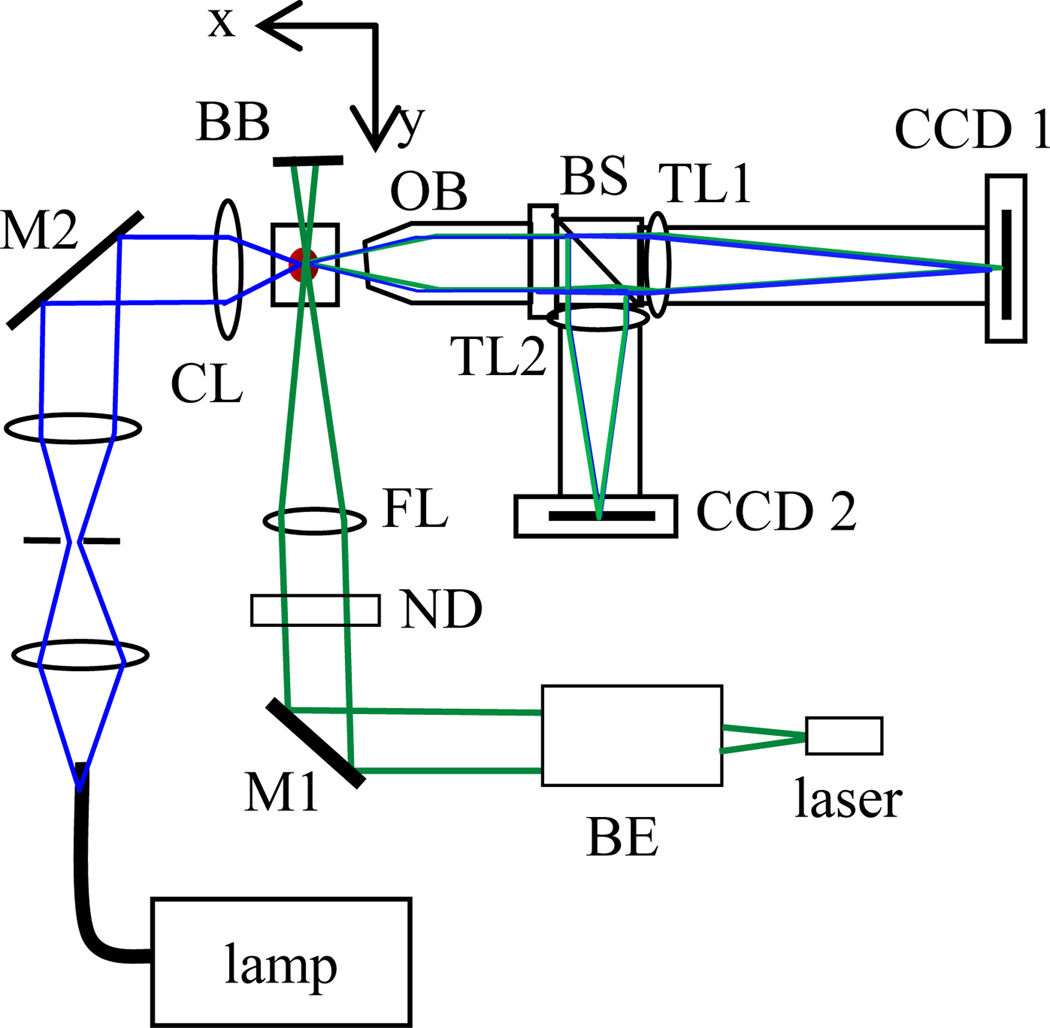
The B16F10 cells were removed from culture and immobilized in a 1:3 mixture of the culture medium with a clear gel in a glass cuvette. Vitality of the cells embedded in the medium-gel mixture has been examined with trypan blue staining and we found that almost all cells remain viable within one hour after embedding at a room temperature of about 22°C. All subsequent diffraction imaging were carried out under the above condition after centrifuging the gel sample to remove most air bubbles. The glass cuvette filled with the gel sample was placed on a stage which can be translated in three directions of x, y and z, as shown in Fig. 1. To validate the system, we started our study with polystyrene spheres (Duke Scientific) embedded in clear gel consisting of water, glycerol, and hydroxyethyl cellulose.
Fig. 1.
(online colour at: www.biophotonics-journal.org) The schematic of light sources and a split-view imaging system: BE: beam expander, M1/M2: mirrors, CL/FL: condenser/focusing lenses, ND: neutral density filter, BB: beam block, OB: objective, BS: beam splitter, TL1/TL2: tube lenses.
We designed and built a split-view imaging system to acquire diffraction images of specimens carried by a flowing fluid or embedded in clear gel. The imaging system consists of the objective, beam splitter, tube lenses and cameras and the assembly can be translated along the x-and z-axis. An infinity-corrected microscope objective (M Plan Apo 50×, Mitutoyo) of 13mm in working distance and 0.55 in NA was used to relay the scattered light from an illuminated specimen to a beam splitter in an angular region centered at 90° from the direction of the incident light along the y-axis. Images were acquired with a thermoelectrically cooled camera (CCD1) (U2000, Apogee) while a video camera (CCD 2) was used for alignment. This arrangement makes it easy to align the imaging system relative to the specimen with a non-coherent light source as described below.
As displayed in Fig. 1, two light sources were used for different imaging purposes. A diode-pumped solid state laser (SCL532CW, Snake Creek Lasers) was used to produce a linearly polarized, 45° from the horizontal direction, and cw laser beam with the wavelength λ=532nm. A 10× beam expander and a spherical lens of 100mm in focal length were used to collimate, expand and focus the laser beam at the selected specimen in the gel. The incident power at the specimen was varied between 1 and 5mW using neutral density filters as the excitation source for diffraction imaging. We constructed a Kohler setup with a fiber-coupled tungsten lamp illuminator to provide a uniform and non-coherent white light source for bright-field imaging with CCD1 or system alignment with CCD2. With the white light source, finding the target cell in the gel with the objective aligned into the focused position can be done without the laser beam to eliminate possible damage to cells.
3. Results and discussion
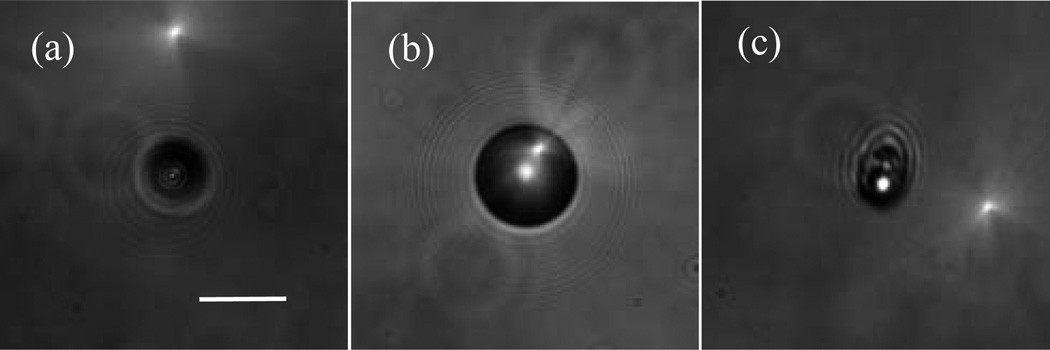
In the first part of study, we investigated the effect of the objective location on the diffraction imaging. Once the specimen had been located, the objective was first aligned into the focused position under white light illumination. This position was employed for later image acquisition as the reference position or x=0. Fig. 2 presents examples of these non-coherent bright-field images.
Fig. 2.
The bright-field images acquired with the objective positioned at x=0: (a) a sphere of d=9.6µm; (b) a sphere of d=25µm, and (c) a B16/GPR4 cell. Bar=20µm.
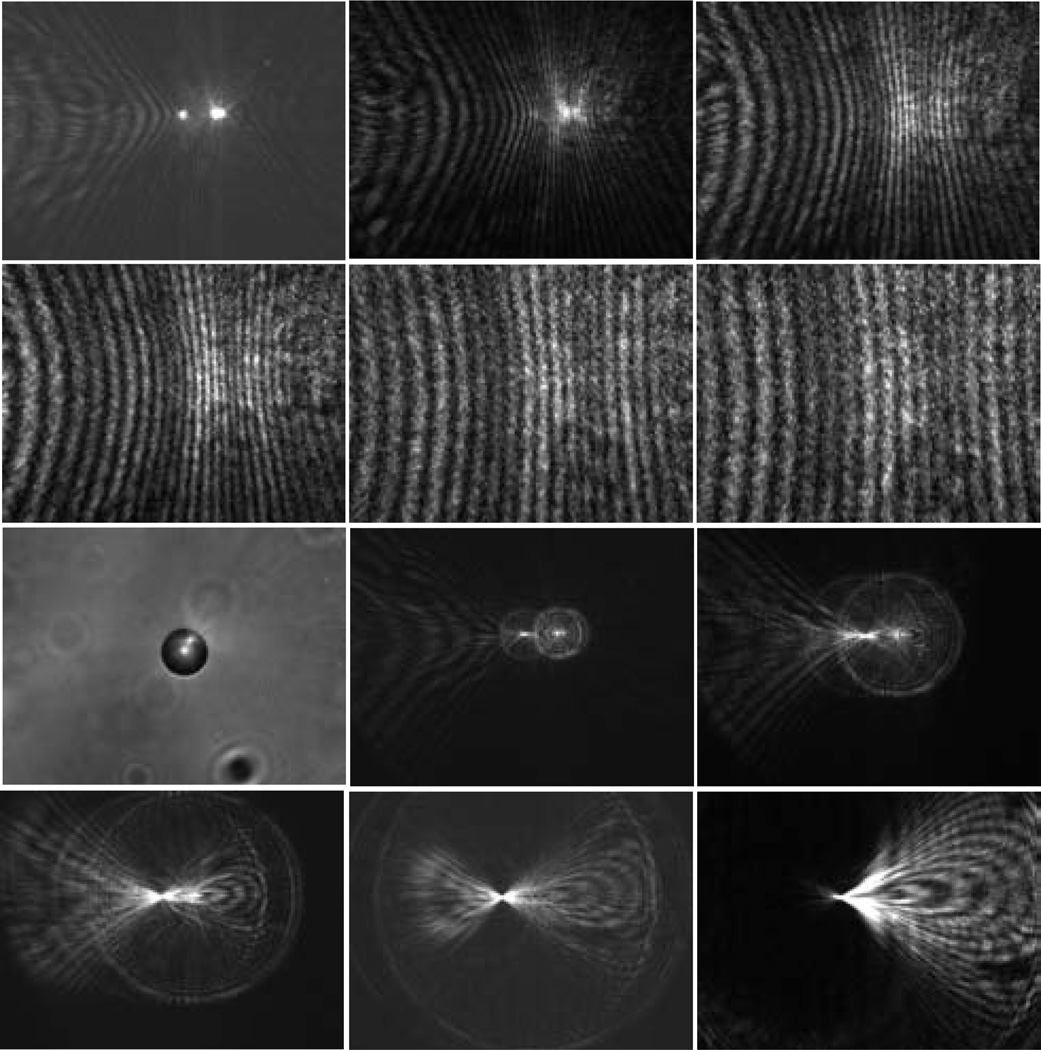
After the system alignment, the laser beam was introduced for diffraction imaging and the imaging system was translated from the reference position of x=0 and diffraction images were taken at each stop with exposure times ranging from 50µs to 3s. The direction of x > 0 refers to moving the objective towards the specimen. Fig. 3 displays a set of diffraction images acquired at x between −500µm and +500µm from a sphere of 25µm in diameter. These image data exhibit two features. First the images acquired at x > 0 present the characteristic vertical fringe pattern one expects from the Mie theory of light scattering by single spheres [13]. Further, and counterintuitively, the images acquired at increasing x values exhibit expanded fringes in the FOV of the camera. Second the images acquired at x < 0 contain fringe patterns that are largely independent of the specimen’s structure as the objective is moved away from the specimen.
Fig. 3.
The diffraction images and one bright-field image of a polystyrene sphere of 25µm in diameter. The diffraction images were acquired with a laser beam of λ=532nm in wavelength and the objective at different x positions and the bright-field image were acquired with a non-coherent white light. From left to right, 1st row: x=0µm, 100µm, 200µm; 2nd row: x=300µm, 400µm, 500µm; 3rd row: x=0µm (bright-field image), x=−100µm, −200µm; 4th row: −300µm, −400µm, −500µm.
In addition to the sphere of 25µm in diameter, we also carried out imaging of polystyrene spheres of 9.6µm in diameter and 4 melanoma cells using the same sequence of translating the objective at different × positions. The dependence of the diffraction images exhibit similar features as discussed above on the two sides of x=0. After analysis of the sphere image data, we determined that the diffraction images acquired at x=200µm correlate strongly with the particle morphology and examples of these images are presented in Fig. 4 together with those acquired at x=−200µm as comparison.
Fig. 4.
The diffraction images of a polystyrene sphere of 9.6µm in diameter in the left column and two melanoma cells: B16/vector (cell #1) in the middle column and B16/GPR4 (cell #3) in the right column. 1st row: x=200µm; 2nd row: x=−200µm.
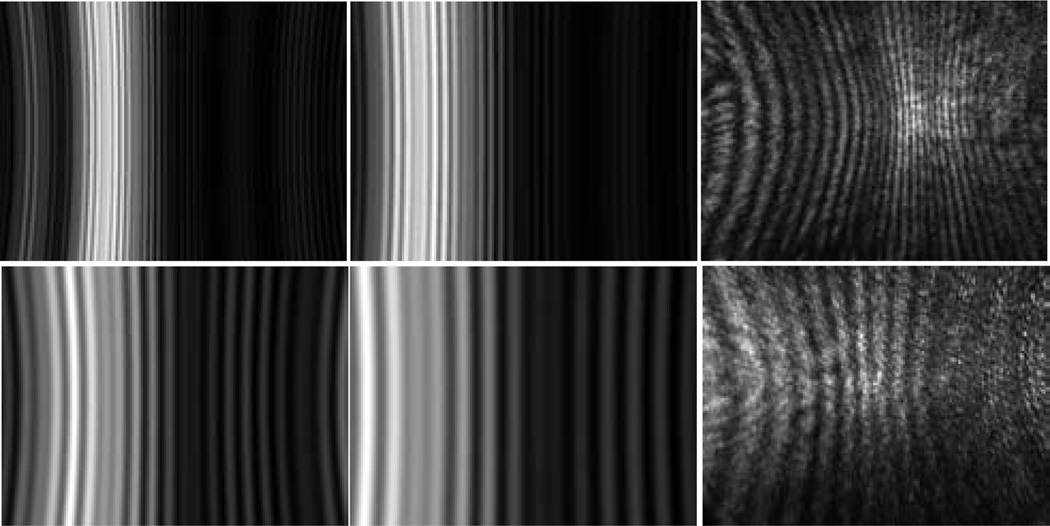
To understand these diffraction image data, we calculated the angle-resolved scattered light distribution based on the Mie theory [13] and projected the results on a y–z plane as calculated diffraction images without consideration of the objective and tube lens. The refractive indices of 1.59 and 1.40 were used for the sphere and host medium of clear gel, respectively, for the wavelength of λ=532nm. Different values of the angular distance Θ were used in the calculated diffraction images, which corresponds to the half-width angular distance of FOV along the horizontal direction or y-axis. The calculated and measured diffraction images are shown in Fig. 5 for spheres of the two different diameters.
Fig. 5.
The projection images calculated from angle-resolved scattered light distribution by the Mie theory with Θ=24° for images in the left column and Θ=16° in the middle column. The images in the right column are measured diffraction images of the spheres with x=200µm. 1st row: d=25µm; 2nd row: d=9.6µm.
In obtaining the calculated images, the microscope objective was not included in the modeling and the only variable was the angular distance Θ, with decreasing Θ corresponding to expanded fringes in FOV. Comparing of the calculated images at different Θ with the measured images acquired at x=200µm, as shown in Fig. 5, shows that a best fit is achieved with Θ=16° if we use the number of fringes in FOV as the criterion. Note that the half cone angle θ corresponding to the objective placed at the focused position (x=0) is 23° based on the objective’s NA (=0.55) and the refractive index of the gel (n=1.40). So the result of Θ=16° for the calculated image to be comparable to the diffraction image acquired with the objective moved towards the sphere from x=0 by 200µm, is unexpected and should be due to the defocused objective. We note also that the fringes in the calculated images do not curl near the edges of FOV as those in the measured one which may be attributed to the effect of the objective as well. The disagreement between the measured and calculated images may be resolved by incorporating the effect of the microscope objective into the modelling of light scattering using the point-spread function.
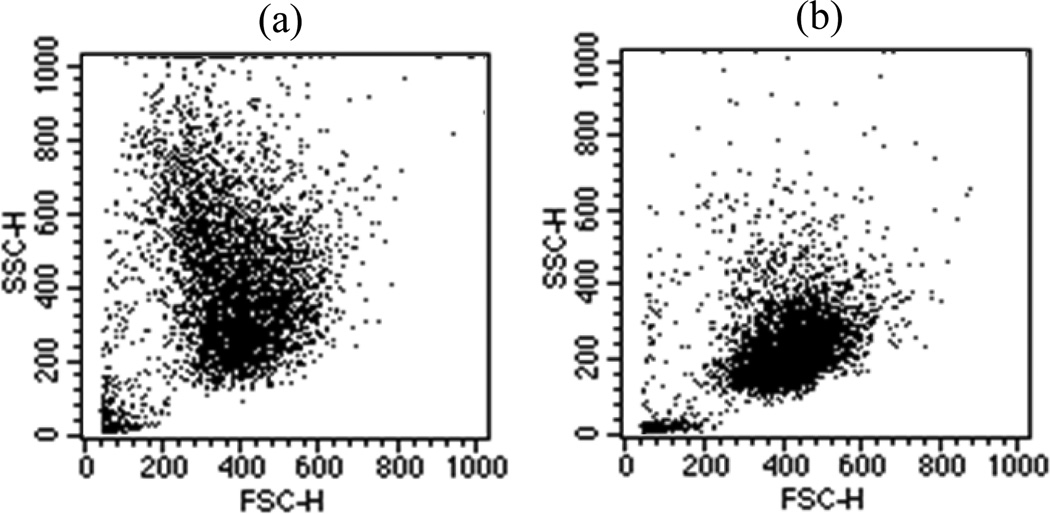
In the second part of the study, we examined the morphological changes induced in the B16F10 cells to examine if these cells can be used as a model for study of the correlation between diffraction images and 3D morphological features. We observed that the expression of the G protein-coupled receptor, GPR4, in B16F10 cells increased the formation of dendrites and led to changes in morphology. Furthermore, it has been found that GPR4 expression increased melanin content by 4 fold by direct measurement of melanin concentration with a spectrophotometer (L.V. Yang et al. unpublished data) due to the increased production of melanin particles, which are markers of melanocyte differentiation [14]. An assay of 10,000 cells has been performed with a conventional flow cytometer (FACScan, Becton Dickinson) for each of the two cell types and the plots of light scatter are presented in Fig. 6. From these data, one can observe that the mean value of the foward scatters by the B16/vector cells (mean value=391) are slightly larger than that by the B16/GPR4 cells (mean value=375) while the relation in side scatters is reversed (228 vs 414).
Fig. 6.
The plots of side scatter channel (SSC) versus forward scatter channel (FSC) obtained from 10,000 B16F10 cells: (a) B16/GPR4; (b) B16/vector.
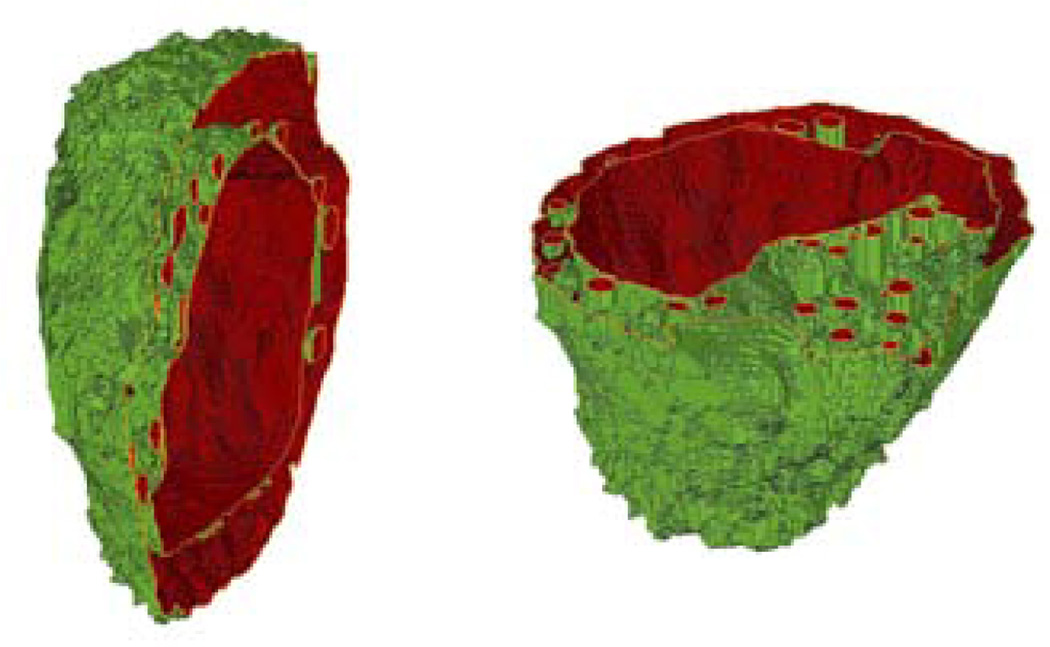
To quantitatively investigate the morphological changes, 3D reconstruction of melanoma cells has been performed with an in-house developed software through confocal imaging. The pixels in the confocal image stacks were first sorted into three groups: cytoplasm, nucleus and mitochondria according to the intensity and wavelength of fluorescence emission. Then the contours of related organelles between neighbouring slices were connected for 3D structure and volume calculation. One example of 3D structure for a B16/GPR4 cell is presented in Fig. 7 in two sectional views. Five cells from each of the two cell types were randomly selected to acquire confocal image stacks for 3D reconstruction. The extracted volume data are listed in Table 1. Further study of the molecular mechanisms and functional significance of GPR4-induced morphological change and melanin production and differentiation in B16F10 cells are currently under investigation.
Fig. 7.
(online colour at: www.biophotonics-journal.org) Two cross-sectional views of the 3D structure of a B16/GPR4 cell.
Table 1.
The volume parameters of B16F10 cells (µm3)
| B16/GPR4 | B16/vector | |
|---|---|---|
| nuclear * | 1103±307 | 1164±533 |
| mitochondria * | 206±63 | 297±107 |
| cell *# | 3586±892 | 4910±2170 |
| N/C ^ | 31% | 24% |
| mean radius (µm) | 9.50 | 10.5 |
in the form of mean±std with 5 cells in each group.
equal to the volume sum of cytoplasm, nucleus and mitochondria.
mean volume ratio of nucleus-to-cell.
It is interesting to note that the cytoplasm volumes of the two cell types appear to be different while the volumes of the nucleus and mitochondria between the two types are close in values. The fact that B16/vector cells have larger cytoplasm volume may be used to explain the feature revealed by the plots of light scatters in Fig. 6, which can be interpreted as the B16/vector cells having larger cell volume and less intracellular heterogeneity. Furthermore, the variation in cytoplasm volume, induced by the GPR4 receptor, may suggest a significant difference between the cytoskeletons of these cells which can have important consequences in cells’ ability for adhesion and migration. While a conventional flow cytometer can be used to acquire light scattering data as shown in Fig. 6, one can clearly see that these data provide very limited quantitative information on 3D morphology. In contrast, the diffraction images presented in this report demonstrate large difference between spheres of different sizes and spheres and cells of similar sizes and thus can be used to extract 3D morphological features as we discussed in the introduction. A study of different B16F10 cell populations with a diffraction imaging flow cytometer and comparison with FDTD numerical modelling is in preparation and results are expected to appear soon.
4. Conclusion
Even though research related to flow cytometry can be dated back to 1930s [15], wide use of this technology as a high-throughput method of cell assay did not appear until half a century later after significant progress in fluidic technology and cell optics. Flow cytometry is now the method of choice for rapid analysis and sorting of cells in large populations on single cell basis. One significant disadvantage of the current technology based on integrated light signals lies in its very limited capability in extracting morphological features which carry rich information on cells.
In this report we presented experimental results concerning the effect of microscope objective on diffraction imaging of single specimen embedded in gel. Our results show that diffraction images acquired with an objective correlate strong correlation with the 3D morphology of the specimen if these images are taken at a defocused position towards the specimen. We have also investigated the 3D structures of tumorigenically transformed B16F10 melanoma cells and established that these cells can be used as a model for study of 3D morphology with the diffraction imaging method. With a recently developed flow-in-fluid flow chamber, the method of diffraction imaging with a microscope objective, as reported in this paper, has been implemented in a flow cytometer to acquire rapidly image data for extraction of 3D morphological features. It is worth noting that the diffraction images acquired from single spheres and cells embedded in gel have fairly large background noise due to the presence of other particles, including air bubbles in the laser beam path. We found that the diffraction images acquired from flowing spheres and cells are of much higher signal-to-noise ratio than presented here with the special flow chamber if the objective is placed at the defocused position of x=200µm [11].
Acknowledgments
We thank Dr. D.A. Weidner for assistance on confocal imaging and Dr. R. S. Brock for 3D reconstruction. This research was supported in part by a NIH grant (1R15GM70798-01).
Biographies
Kenneth M. Jacobs studied physics at Rennselaer Polytechnic Institute and East Carolina University, received his M.S. degree in applied physics in 1997. He is completing his Ph.D. degree in biomedical physics and is interested in microfabrication and microfluidics.
Li V. Yang is an Assistant Professor at Department of Internal Medicine, East Carolina University. He earned his Ph.D. in Molecular Biology and Genetics at Wayne State University and did his postdoctoral fellowship at University of California, Los Angeles. His current research interests include tumor biology, angiogenesis, and G protein-coupled receptors.
Junhua Ding is an assistant professor of computer science at East Carolina University. He received his Ph.D. in 2004. His research interests include software engineering, data mining, and cellular image processing.
Andrew E. Ekpenyong is a PhD student in the biomedical physics program at East Carolina University. He earned his M.S. degree in physics in 2007 from Creighton University in Nebraska.
Reid Castellone is a graduate student with a concentration in Cell Biology at East Carolina University. He received his B.S. from Boston College and his research interests are tumor micro-environments and G protein-coupled receptors.
Jun Q. Lu received her B.S. and M.S. from Nankai University in China and Ph.D. degree from University of California at Irvine, all in physics. She is currently an associate professor of physics at East Carolina University and her research areas include theoretical modelling and numerical simulations of light scattering in turbid media.
Xin-Hua Hu received his B.S. and M.S. degrees from Nankai University in China, M.S. degree in physics from Indiana University at Bloomington and Ph.D. degree from University of California at Irvine, all in physics. After a short period of working in industry, he joined the physics faculty at East Carolina University in 1995 and established the Biomedical Laser Laboratory (http://bmlaser.physics.ecu.edu) in 1996. He is a professor of physics and his research interests include tissue and cell optics, optical imaging, flow cytometry and cancer treatment.
References
- 1.Maltsev VP. Scanning flow cytometry for individual particle analysis. Rev. Sci. Instruments. 2000;71:243–255. [Google Scholar]
- 2.George TC, Basiji DA, Hall BE, Lynch DH, Ortyn WE, Perry DJ, Seo MJ, Zimmerman CA, Morrissey PJ. Distinguishing modes of cell death using the ImageStream multispectral imaging flow cytometer. Cytometry A. 2004;59:237–245. doi: 10.1002/cyto.a.20048. [DOI] [PubMed] [Google Scholar]
- 3.Maleki MH, Devaney AJ, Schatzberg A. Tomographic reconstruction from optical scattered intensities. J. Opt. Soc. Am. A. 1992;9:1356–1363. [Google Scholar]
- 4.Brock RS, Hu XH, Yang P, Lu JQ. Evaluation of a parallel FDTD code and application to modeling of light scattering by deformed red blood cells. Opt. Express. 2005;13:5279–5292. doi: 10.1364/opex.13.005279. [DOI] [PubMed] [Google Scholar]
- 5.Lu JQ, Yang P, Hu XH. Simulations of Light Scattering from a Biconcave Red Blood Cell Using the FDTD method. J. Biomed. Opt. 2005;10:024022. doi: 10.1117/1.1897397. [DOI] [PubMed] [Google Scholar]
- 6.Brock RS, Hu XH, Weidner DA, Mourant JR, Lu JQ. Effect of Detailed Cell Structure on Light Scattering Distribution: FDTD study of a B-cell with 3D Structure Constructed from Confocal Images. J. Quant. Spectrosc. Radiat. Transfer. 2006;102:25–36. [Google Scholar]
- 7.Yurkin MA, Hoekstra AG. The discrete dipole approximation: an overview and recent developments. J. Quant. Spectrosc. Radiat. Transfer. 2007;106:558–589. [Google Scholar]
- 8.Yurkin MA, Hoekstra AG, Brock RS, Lu JQ. Systematic comparison of the discrete dipole approximation and the finite difference time domain method for large dielectric scatterers. Opt. Express. 2007;15:17902–17911. doi: 10.1364/oe.15.017902. [DOI] [PubMed] [Google Scholar]
- 9.Singh K, Su X, Liu C, Capjack C, Rozmus W, Backhouse CJ. A miniaturized wide-angle 2D cytometer. Cytometry A. 2006;69:307–315. doi: 10.1002/cyto.a.20199. [DOI] [PubMed] [Google Scholar]
- 10.Su XT, Singh K, Capjack C, Petracek J, Backhouse C, Rozmus W. Measurements of light scattering in an integrated microfluidic waveguide cytometer. J. Biomed. Opt. 2008;13:024024. doi: 10.1117/1.2909670. [DOI] [PubMed] [Google Scholar]
- 11.Jacobs KM, Lu JQ, Hu XH. Development of a diffraction imaging flow cytometer. Opt. Lett. 2009 doi: 10.1364/OL.34.002985. submitted to. [DOI] [PMC free article] [PubMed] [Google Scholar]
- 12.Fidler IJ. Selection of successive tumour lines for metastasis. Nat. New Biol. 1973;242:148–149. doi: 10.1038/newbio242148a0. [DOI] [PubMed] [Google Scholar]
- 13.Bohren CF, Huffman DR. Absorption and scattering of light by small particles. New York: Wiley; 1983. p. 477. [Google Scholar]
- 14.Busca R, Bertolotto C, Abbe P, Englaro W, Ishizaki T, Narumiya S, Boquet P, Ortonne JP, Ballotti R. Inhibition of Rho is required for cAMP-induced melanoma cell differentiation. Mol Biol Cell. 1998;9:1367–1378. doi: 10.1091/mbc.9.6.1367. [DOI] [PMC free article] [PubMed] [Google Scholar]
- 15.Moldavan A. Photo-electric technique for the counting of microscopical cells. Science. 1934;80:188–189. doi: 10.1126/science.80.2069.188. [DOI] [PubMed] [Google Scholar]


