Abstract
Cell adhesion to extracellular matrix (ECM) is fundamental to many distinct aspects of cell biology, and has been an active topic for label-free biosensors. However, little attention has been paid to study the impact of receptor signaling on the cell adhesion process. We here report the development of resonant waveguide grating biosensor-enabled label-free and fluorescent approaches, and their use for investigating the adhesion of an engineered HEK-293 cell line stably expressing green fluorescent protein (GFP) tagged β2-adrenergic receptor (β2-AR) onto distinct surfaces under both ambient and physiological conditions. Results showed that cell adhesion is sensitive to both temperature and ECM coating, and distinct mechanisms govern the cell adhesion process under different conditions. The β2-AR agonists, but not its antagonists or partial agonists, were found to be capable of triggering signaling during the adhesion process, leading to an increase in the adhesion of the engineered cells onto fibronectin-coated biosensor surfaces. These results suggest that the dual approach presented is useful to investigate the mechanism of cell adhesion, and to identify drug molecules and receptor signaling that interfere with cell adhesion.
Keywords: β2-adrenergic receptor, cell adhesion, extracellular matrix protein, G protein-coupled receptor, resonant waveguide grating biosensor, total internal reflection fluorescence
1. Introduction
Cell adhesion to extracellular matrix (ECM) is critical to many different aspects of cell biology and human physiology, ranging from cell differentiation, migration, proliferation, and survival to tissue development and morphogenesis. Cell adhesion to the ECM is mediated through adhesion complexes that consist of specific integrin receptors, cytoskeletal elements and many distinct adaptor and signaling proteins (Giancotti and Ruoslahti, 1999; Schewartz and Ginsberg, 2002; Zaidel-Bar et al., 2007). These adhesion complexes permit cells to sense the composition, organization, density, rigidity, and biochemical and rigidity gradients of the ECM (Discher, et al., 2005; Engler et al., 2006; Mrksich, 2002; Plotnikov et al., 2013). Abnormal cell adhesion has been implicated in many diseases including arthritis, cancer, cardiovascular diseases, inflammation, and osteoporosis (Parsons et al., 2010; Ulbrich et al., 2003).
Cell adhesion to a surface is also essential to the development of biomaterials for tissue engineering and of novel cell culture vessels for cell therapy and other applications (Liu et al., 2012; Lutolf et al., 2009; Trappmann et al., 2012). The ability to examine the spatial and temporal dynamics of cell adhesion to a surface is important to understand the biochemical, biological and physical aspects of cell adhesion (Stevens and George, 2005). Owing to their non-invasiveness and high temporal resolution in measurements various label-free biosensors have been used to characterize cell adhesion (Fang, 2010b, 2011b; Giaever and Keese, 1993; Ramsden and Horvath, 2009; Saitakis and Gizeli, 2012; Wegener et al., 2000). Optical biosensors including surface plasmon resonance imaging (SPRi) offers high spatial resolution, so it is possible to estimate the cell/substrate distance. For cultured primary goldfish glial cells, the cell/substrate distance was estimated using SPRi to be about 160nm for most parts of the cells, and about 25nm for the cell peripheral lamellipodia (Giebel et al., 1999). Optical biosensors including SPR and resonant waveguide grating (RWG) biosensor are to large degree sensitive to the changes in local mass density, so it is possible to examine the remodeling of sensor surfaces (Fang et al., 2006). For vascular smooth muscle cells cultured on fibronectin, it was found that the cells secret and deposit proteins as much as 120 ng/cm2 overnight (Peterson et al., 2009) and undergo dynamic membrane ruffling with nanometer precision (Peterson et al., 2010). Both surface plasmon-based infrared spectroscopy (Yashunsky et al., 2012) and resonant waveguide grating (RWG) biosensor (Fang et al., 2006; Horvath et al., 2008) enable cell sensing with multiple sampling depths, so it is possible to resolve the multi-staged process of the adhesion and monolayer formation of Madin-Darby canine kidney (MDCK) cells (Yashunsky et al., 2012), and to detect the inhomogeneity in refractive index within the distinct layers of a fibroblast cell perpendicular to the biosensor surface during cell adhesion (Horvath et al., 2008). Furthermore, these biosensors are also useful to study receptor signaling that leads to alteration in adhesion pattern of cultured cells (Chen et al., 2012; Fang et al., 2005; Fang, 2010a; Garcia et al., 2013), and to decode the impact of ECM coatings on receptor signaling and drug pharmacology (Tran et al., 2012). However, few studies have been attempted to study the impact of the external stimuli-induced intracellular signaling, in particular, G protein-coupled receptor (GPCR) signaling, on the cell adhesion process per se.
We here report the development of RWG biosensor-enabled label-free and fluorescence detection, and its use to characterize the adhesion of an engineered human embryonic kidney HEK293 cell line on distinct ECM coated surfaces. HEK293 is one of the most widely used model cell line for basic research and drug discovery. We found that the activation of β2-adrenergic receptor (β2-AR) enhances cell adhesion.
2. Material and methods
2.1 Materials
Carvedilol, collagen Type IV from human cell culture, epinephrine, fibronectin from human plasma, isoproterenol, pindolol, salbutamol, and salmeterol were obtained from Tocris Chemical Co. (St. Louis, MO, USA). Cytochalasin D, nocodazole, RGD peptide (Arg-Gly-Asp), and vinblastine were purchased from Sigma Chemical Co. (St. Louis, MO, USA). Except for two ECM proteins which were freshly dissolved in the assay buffer (1×Hank’s balanced salt buffer, 20mM Hepes, pH 7.1; HBSS), all compounds were stocked in dimethyl sulfoxide (DMSO) at 100 mM, and were diluted using the assay buffer to the indicated concentrations. Epic® 384-well biosensor cell culture compatible (tissue culture treated, TCT) and Epic® 384-well biosensor fibronectin-coated microplates were obtained from Corning Incorporated (Corning, NY, USA). Collagen IV coated biosensor microplates were freshly made by overnight drying 10μl 20μg/ml collagen IV solution per well under nitrogen inside an incubator.
2.2 Generation and culture of HEK-β2AR-GFP stable cell line
The parental HEK293 cell line was obtained from American Type Cell Culture (Manassas, VA, USA), and cultured in minimum essential medium having 2mM glutamine, 4.5 g/L glucose, 2mMglutamine, 10% fetal bovine serum (FBS), and antibiotics.
The engineered HEK-β2AR-GFP cells were made in house. Briefly, HEK293 cells were transfected with human pCMV-β2AR-GFP plasmid (OriGene Technologies, Inc., Rockville, MD, USA) using Lipofectamine™ LTX and Plus Reagent (Invitrogen) in a 6-well cell culture plate. The cells were treated with 500μg/ml G418 Geneticin® (Invitrogen, Grand Island, NY, USA) the next day. After transfection for 7 days in total, the survived cells were then diluted to 2 to 3 cell/well in a 96well cell culture plate to allow clones derive from single cell. Stable clones with homogeneous expression level of β2AR-GFP were selected by visualizing the GFP signal under a fluorescence microscope. The β2AR protein function of these stable cell lines were verified by using dynamic mass redistribution (DMR) assays. The stable cell lines were maintained in the complete medium (that is, DMEM medium containing 10% FBS, penicillin/streptomycin, L-glutamine, and 500μg/ml G418). The cells were passaged at 37°C with 5% CO2. Except for cell adhesion studies which used physical scrapping approach to avoid damage of cell surface β2ARs, these cells were passed with trypsin/ethylenediamine-tetraacetic acid when approaching 90% confluence to provide new maintenance culture on T-75 flasks and experimental culture on the biosensor microplates.
2.3 Quantitative real time PCR
Total RNA was extracted from HEK293 cells using an RNeasy mini kit (Qiagen, Cat#74104). On-column DNase digestion was performed using RNase-free DNase set from Qiagen (Valencia, CA) to eliminate genomic DNA contamination. The concentration and quality of total RNA were determined using a Nanodrop 8000 from Thermo Scientific. Customized PCR-array plates for 352 GPCR genes and reagents were ordered from SABiosciences (Frederick, MD). About 1 μg total RNA was used for each 96-well PCR-array. The PCR-array was performed on an ABI 7300 Real-Time PCR System following the manufacturer’s instructions.
2.4 DMR assays
Label-free DMR assays enabled by RWG biosensor were performed using Corning® Epic® BT system, a swept wavelength interrogation system that is capable of imaging whole RWG biosensor microplates with a spatial resolution of 90μm (Ferrie et al., 2010). This system uses a light beam from a tunable light source to illuminate whole 384well biosensor microplate, and a high speed complementary metal-oxide semiconductor (CMOS) digital camera to record the escaped and reflected resonant lights from the whole plate. The tunable light source sweeps the wavelength range from 825 to 840 nm in a stepwise fashion to identify the resonant wavelength at each location. Total 150 spectral images were acquired within a single sweeping cycle (3 sec), and were then processed into sensor resonant wavelength or DMR image in real time. This system, due to its small footprint, enables cell assays inside a typical cell culture incubator.
For receptor signaling using DMR assays, cells were first harvested from T75 flask using trypsin/ethylenediamine-tetraacetic acid, and re-suspended in the completed medium. Cells were seeded onto the fibronectin coated biosensor microplates using a seeding density of 12, 000 cells per well in 40 μl the complete medium, and cultured at 37°C with 5% CO2 inside a cell culture incubator for about 22hrs to reach a confluency of ~95%. Afterwards, the cells were washed three times using a plate washer (Bio-Tek Microplate Washers ELx405™, Bio-Tek, Winooski, VT), and maintained in the assay buffer (HBSS) for about one hour to reach equilibrium at 26°C. After establishing a 2min baseline, DMR assays were then initiated by adding the HBSS buffered compound solution and the compound-induced DMR was recorded in real time.
For cell adhesion studies, the biosensor surface was first coated with a specific ECM protein, and pre-incubated with the complete medium solution (25μl per well) in the absence and presence of a compound until it reaches an equilibrium state. After a 2min baseline, 25μL the cell suspension in the same medium in the presence of the same compound at equal amount were introduced to each well using a 384well liquid handling device (Epic®). The biosensor response is monitored over time. The cells were mechanically scraped off from T75 flask to avoid damage cell surface receptors, and then re-suspended in the completed medium. For inhibitors, the cells were pretreated with the inhibitors for about one hour. For the β2-AR ligands, the cells were premixed with the ligand 1min before added into the biosensor microplate. All studies were carried out with at least four replicates unless specifically mentioned.
2.5 Fluorescence microscopy
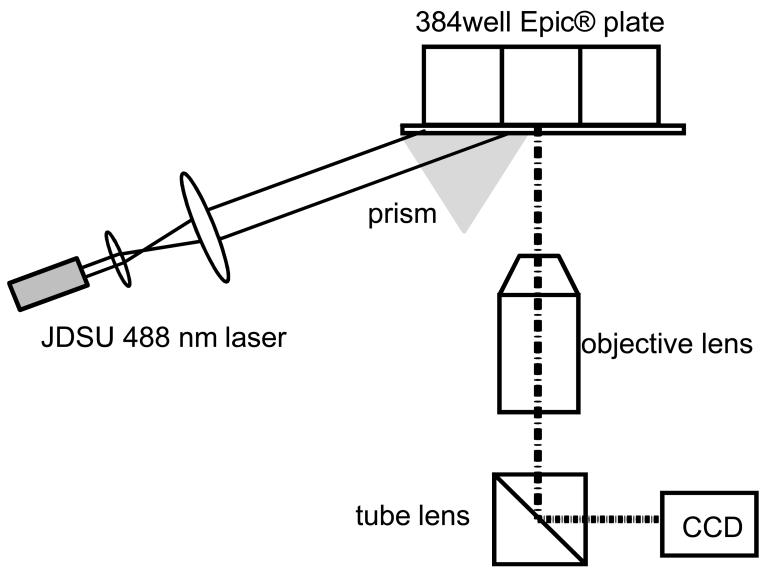
Epi-fluorescence microscopic imaging was obtained a Zeiss Axioplan fluorescence microscope. Total internal reflection fluorescence (TIRF) microscopic imaging was obtained using an in-house TIRF microscope. Briefly, a 488nm diode laser (Continuous Wave 488 nm Solid-State Laser, JDSU, Milpitas, CA, USA) is used to launch a light beam into the glass substrate of an Epic® biosensor microplate through a right angle prism (5mm BBAR Coated Right Angle Prism, VIS 0° Coated, Edmund Optics Inc., Barrington, NJ, USA). When the laser incident angle exceeds the total internal reflection critical angle, total internal reflection is observed and the evanescent wave is obtained and used to excite green fluorescent protein-tagged β2-ARs located at the cell surface. Immersion oil is applied to fill the gap between the prism and the plate substrate. A Nikon 20× (0.4 NA) objective, a tube lens with a 200 mm effective focal length, and a regular cooled CCD camera are used to record the TIRF images. The TIRF microscopy is calibrated by measuring the transmission image of an US Air Force target (USAF), showing that the imaging system has a field of view of 192 × 144μm and a 1.38μm spatial resolution.
2.6 Statistic analysis
DMR data were analyzed by using GraphPad Prism 5.0 (GraphPad Software Inc., San Diego, CA, USA). The EC50 or IC50 values were obtained by fitting the dose DMR response curves with nonlinear regression. The kinetic cell adhesion data were analyzed using paired student’s t test.
3. Results
3.1 RWG biosensor-enabled fluorescence microscopy
We combined RWG biosensor-enabled label-free with fluorescence imaging approach to characterize cell adhesion. The label-free measurement was performed using a recently reported whole plate RWG imager (Ferrie et al., 2010). The instrument setup for the RWG-enabled TIRF microscopy is illustrated in Fig.1. This TIRF system uses a 488nm diode laser to illuminate the RWG biosensors within a 384well biosensor microplate. The light is coupled into the biosensor substrate with the help of a right angle prism and the RWG diffractive grating when the laser incident angle exceeds the total internal reflection critical angle. The evanescent wave obtained is then employed to excite the GFP tagged to the C-terminal of the β2-AR within the sensing sampling depth. A CCD camera, coupled with an objective and a tube lens, is used to record the TIRF images of cells with a spatial resolution of 1.38μm. The label-free and fluorescence measurements were performed independently.
Figure 1.
Schematic drawing showing the setup of a resonant waveguide grating biosensor-enabled total internal reflection fluorescence microscopy. Here, a 488nm laser light is used to illuminate the biosensor within a well of 384well microplate with the aid of a right angle prism and the biosensor diffractive grating. The evanescent wave excited fluorescence is collected using an objective lens, and focused via a tube lens onto a CCD camera.
3.2 Characterization of GFP tagged β2-ARs
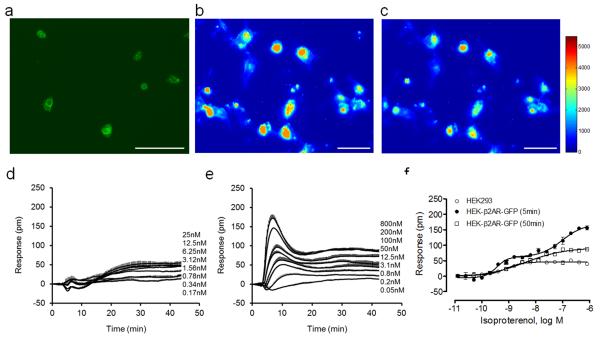
To utilize the dual detection approach to characterize cell adhesion, we constructed an engineered HEK293 cell line that stably expresses GFP tagged β2-AR fusion protein (β2AR-GFP). Conventional fluorescence microscopic imaging showed that the fusion protein is primarily located at the cell plasma membrane and the epi-fluorescence intensity is mostly concentrated at the peripheral area of the cells (Fig.2a). RWG biosensor-enabled TIRF imaging showed that the TIRF intensity was higher in the center area of most individual cells than their peripheral area (Fig.2b). Given that cell adhesion complexes are known to mostly locate at the cell peripheral area, this result suggests that the β2AR-GFPs are uniformly distributed in most parts of cells that are outside the adhesion complexes. The TIRF imaging also showed that stimulating the cultured cells with epinephrine led to marked reduction of fluorescence (Fig.2c), suggesting that once activated the β2AR-GFP become internalized and move outside the TIRF sampling depth. DMR profiling showed that isoproterenol triggered a small DMR in the parental HEK293 cells (Fig.2d), but a more robust DMR with distinct characteristics in the engineered cells (Fig.2e). Isoproterenol is a full agonist for β-adrenergic receptors. Quantitative RT-PCR showed that the parental HEK293 cells predominately express the β2-AR, as evidenced by the cycle threshold value which was 34.4, 30.2, 33.3, 29.2, 31.3, 26.5, 27.2, 26.0, and 38.3 for α1A, α1B, α1D, α2A, α2B, α2C, β1, β2 and β3-adrenergic receptor, respectively. The cycle threshold for the control gene, hypoxanthine phosphoribosyltransferase 1, was found to be 20.1. The isoproterenol DMR in both cell lines was completely blocked by the β-blocker propranolol, but not by the α2-AR-selective blocker yohimbine or the α1-AR selective blocker prazosin, suggesting that the isoproterenol DMR in both cell lines are primarily due to the activation of the β2-AR. Furthermore, isoproterenol gave rise to a single EC50 of 0.78±0.10nM (n = 4) in the parental cells (Fig.2f). In contrast, in the engineered cells isoproterenol displayed an assay time dependent potency; that is, the potency to reach the early peak response was found to be biphasic with two well-separated EC50 (0.36±0.03nM, and 94.0±7.6nM, respectively; n=4), while the potency to reach the late plateau response was monophasic with an EC50 of 4.05±0.34nM (Fig.2f). Epinephrine also behaved similarly; it gave rise to a single EC50 of 11.4±1.2nM (n=4) in the parental cells, and of 124±11nM (n=4) in the engineered cells when the DMR amplitudes at 50min poststimulation were analyzed. However, when the DMR amplitudes at 5min poststimulation was analyzed, a biphasic dose response was also evident, leading to two separated EC50s (0.58±0.04, and 69.5±7.1nM, n=4). Several possibilities may contribute to this; Overexpression of a GPCR may result in altered G protein coupling, receptor organization, and/or signaling pathways (Fang, 2011a; Prinster et al., 2005), as well as increased numbers of spontaneously (unliganded) active and inactive receptors (Tubio et al., 2010). Nonetheless, these results suggest that when overexpressed in HEK293 cells the β2AR-GFP is functional.
Figure 2.
Characterization of the engineered HEK-β2AR-GFP cells. (a-c) Representative fluorescence microscopic images of the engineered cells after overnight culture: (a) epifluorescence image; (b) TIRF image before any treatment; (c) TIRF image after treatment with 1μM isoproterenol for 1hr. For (a-c) the image scale bar is 50 μm. (d-f) The DMR dose responses of isoproterenol in cells after overnight culturing to form monolayer: (d) the parental HEK293 cells; (e) the engineered cells; (f) comparison of the dose-dependent responses of isoproterenol in both types of cells, wherein for the parental cells the DMR amplitude at 50min post stimulation was plotted as a function of isoproterenol dose, and for the engineered cells the DMR amplitudes at both 5min and 50min post stimulation were plotted. For (d-f), the data represents mean±s.d. (n =4).
3.3 Temperature and ECM coating sensitive cell adhesion
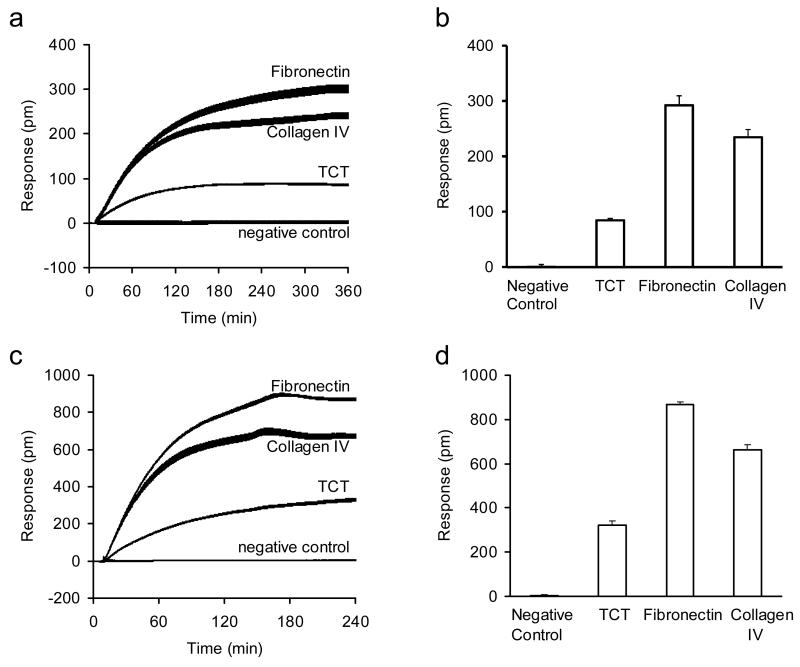
The adhesion of the HEK-β2AR-GFP cells onto three distinct surfaces, tissue culture treated (TCT), fibronectin and collagen IV coated, was monitored in real time using the whole plate RWG imager under two different conditions. Results showed that under ambient condition the HEK-β2AR-GFP cells preferably attached onto the fibronectin coated surface with the fastest kinetics and the largest signal (Fig.3a and b). Almost identical trend was found under physiological condition (Fig.3c and d). Furthermore, regardless of surface chemistry cell adhesion became faster under physiological condition than that under ambient condition. Interestingly, once reaching equilibrium state during the assay time, the total signal arising from the adhesion of the same number of cells under physiological condition was found to be almost two folds higher than that under ambient condition for all surfaces. These results suggest that the adhesion of the HEK-β2AR-GFP cells is dependent on temperature and ECM coating, and the temperature effect seems to be intrinsic to cell physiology and independent on ECM coating.
Figure 3.
DMR characterization of HEK-β2AR-GFP cell adhesion. (a, b) The DMR of the engineered cells adherent onto different surfaces under ambient condition: (a) real-time; (b) the DMR amplitudes at 5hr after cell seeding. (c,d) The DMR of the engineered cells adherent onto different surfaces under physiological condition: (c) real-time; (d) the DMR amplitudes at 4hr after cell seeding. The medium only was used as the negative control. For all, the total number of cells added were the same (18,000 cells per well). The data represents mean±s.d. (n =12).
3.4 Mechanisms of cell adhesion under different conditions
To explore the cellular mechanisms governing adhesion process under different conditions, we examined the effects of a panel of inhibitors on the responses of cell adhesion. Cytochalasin D is a potent actin filament disrupting agent by binding to G-actin and thus preventing polymerization of actin monomers (May et al., 1998). Vinblastine is a microtubule disrupter by binding to tubulin, and can strongly depolymerize microtubules at minus ends, but does not significantly depolymerize microtubules at plus ends (Panda et al., 1999). Nocodazole is a microtubule inhibitor that causes overall decrease in microtubule turnover without net microtubule disassembly (Vasquez et al., 1997). Soluble RGD peptide is an integrin agonist that mimics the binding motif of common ECM proteins including fibronectin and collagen IV (Jin et al., 2010).
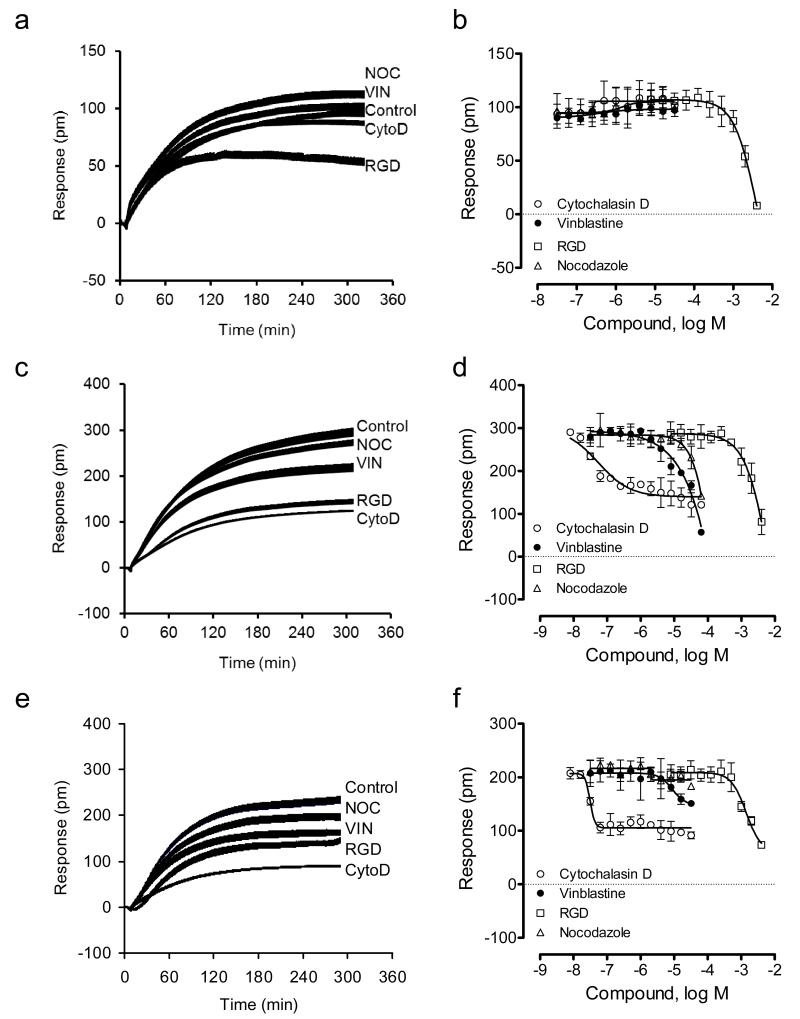
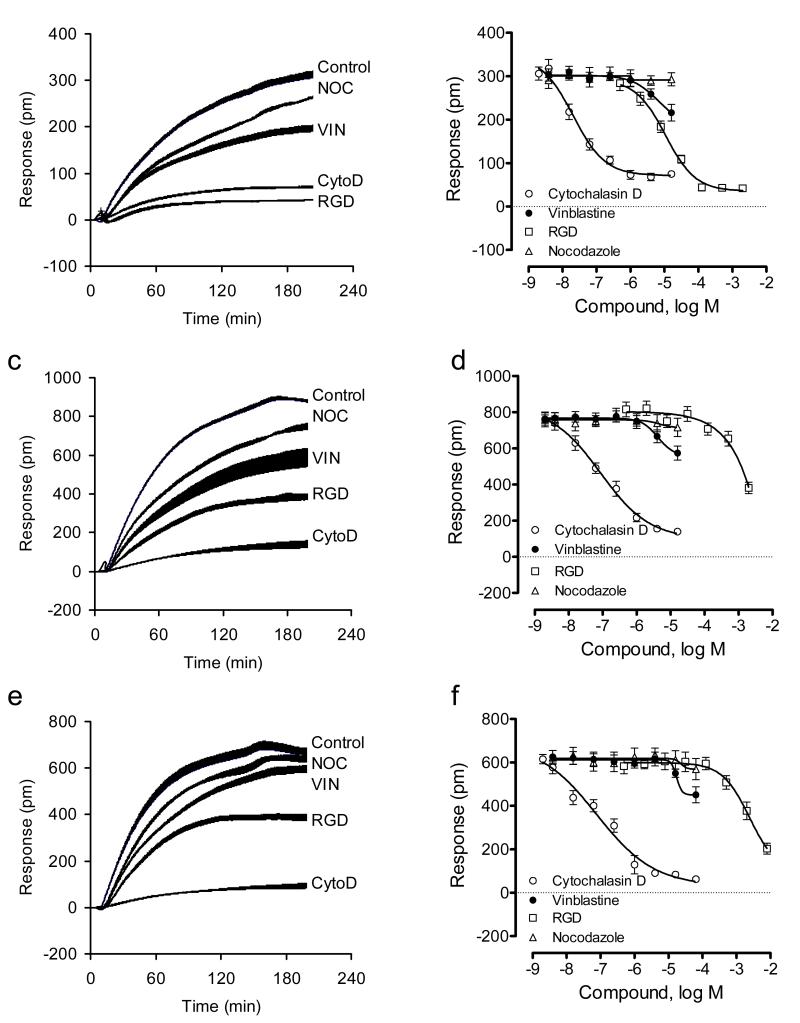
We first examined the cell adhesion mechanism under ambient condition. DMR inhibitor assays showed that on the TCT surface only RGD dose-dependently inhibited the adhesion signal, while the two microtubule inhibitors slightly increased the signal, and cytochalasin D had no effects (Fig.4a and b). The little effect of cytochalasin D on the cell adhesion onto the TCT surface under ambient condition suggests that actin remodeling is not essential to cell adhesion to the TCT surface. Cytochalasin D is known to be capable of disrupting cell adhesion (both cell-substrate and cell-cell) under ambient temperature. This result, together with the sensitivity to RGD treatment, suggests that the engineered cells may interact with the TCT surface through a simple integrin-mediated binding but without active actin remodeling under ambient temperature. This is also consistent with the low DMR signal obtained for the cell attachment to the TCT surface. However, on fibronectin-coated surfaces all inhibitors dose-dependently attenuated the cell adhesion (Fig.4c and d). Cytochalasin D displayed the highest potency but only partially suppressed the adhesion. In contrast, on collagen IV coated surfaces, only cytochalasin D and RGD peptides partially suppressed the adhesion, while vinblastine had small effect, and nocodazole had not effect (Fig.4e and f).
Figure 4.
DMR characterization of HEK-β2AR-GFP cell adhesion in the presence of different inhibitors under ambient condition. (a-f) The DMR of the engineered cells adherent onto different sensor surfaces: tissue culture treated (a, b), fibronectin coated (c,d), and collagen IV coated (e,f). (a,c,e) real-time DMR; (b,d,f) the DMR amplitudes at 5hr after cell seeding as a function of inhibitor dose. For all, the total number of cells added were the same; that is, 18,000 cells per well. For (a,c,e), the inhibitor dose was fixed to be 10μM, 10μM, 10μM and 1mM for nocodazole, vinblastine, cytochalasin D, and RGD peptide, respectively. The data represents mean±s.d. (n=12 for a, c, and e; n =4 for b, d, and f).
We then examined the cell adhesion mechanism under physiological condition. DMR inhibitor assays showed that on all three surfaces examined, similar modulation patterns were observed. In general, both cytochalasin D and RGD peptide dose-dependently and strongly attenuated the adhesion, whereas vinblastine had small effect, and nocodazole decreased the adhesion kinetics but had little on the total adhesion response (Fig.5). Notably, the RGD tripeptide displayed quite different potency to suppress cell adhesion; and the potency order was found to be tissue culture treated > collagen IV > fibronectin.
Figure 5.
DMR characterization of HEK-β2AR-GFP cell adhesion in the presence of different inhibitors under physiological condition. (a-f) The DMR of the engineered cells adherent onto different sensor surfaces: tissue culture treated (a, b), fibronectin coated (c,d), and collagen IV coated (e, f). (a, c, e) real-time DMR; (b, d, f) the DMR amplitudes at 4hr after cell seeding as a function of inhibitor dose. For all, the total number of cells added were the same; that is, 18,000 cells per well. For (a, c, e), the inhibitor dose was fixed to be 10μM, 10μM, 10μM and 1mM for nocodazole, vinblastine, cytochalasin D, and RGD peptide, respectively. The data represents mean±s.d. (n=12 for a, c, and e; n =4 for b, d, and f).
We further examined the TIRF images of HEK-β2AR-GFP cells 2hrs after adhesion onto the fibronectin coated sensor surface at room temperature. Results showed that the TIRF of cells in the absence of any inhibitors tend to be more diffusive with relatively lower intensity than that in the presence of 1μM cytochalasin D, or 1mM RGD peptide (Fig.6). The presence of RGD peptide resulted in a TIRF pattern that has the highest intensity, the most uniform and the smallest size per cells. It is noting that the physical scrapping often leads to certain portions of cell clusters, rather than completely individual cells. Together, these results suggest that both surface chemistry and temperature influence the degree of cell attachment, and distinct mechanisms govern cell adhesion under different conditions. Specifically, integrin binding is involved in cell adhesion under all conditions. Except for the TCT surface under ambient condition, actin remodeling is also involved in the cell attachment under all other conditions. Furthermore, the contribution of integrin binding and actin remodeling to the overall cell attachment appears to be sensitive to both surface chemistry and temperature.
Figure 6.

TIRF images of HEK-β2AR-GFP cells on the fibronectin coated surface under ambient condition. The images were taken 2hrs after cell adhesion onto the fibronectin-coated biosensor surface in the absence and presence of an inhibitor. (a) no any inhibitor; (b) 10μM cytochalasin D; (c) 1mM RGD peptide. The inhibitors were present throughout the cell adhesion process. Image scale bar: 50 μm.
3.5 The impact of β2-AR signaling on cell adhesion
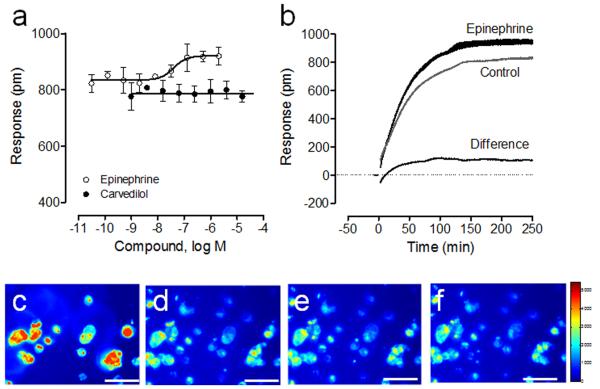
To investigate the effect of β2-AR signaling on the adhesion of HEK-β2AR-GFP cells, we chose a panel of β2-AR ligands including its full agonist epinephrine, partial agonist salbutamol and salmeterol, and antagonist pindolol and carvedilol. DMR assays showed that pre-mixing of cells with the β2AR ligand, one minute before cell adhesion, had distinct effect on the cell adhesion process (Fig.7a). Salbutamol, salmeterol, pinodol and carvedilol had little effect on both the kinetics and total amount of cell adhesion signal. However, the full agonist epinephrine dose-dependently increased the total amount of cell adhesion signal, with an apparent EC50 of 40.0±3.6nM (n=4) (Fig.7a), which is similar to its EC50 to trigger DMR signal in pre-cultured cell monolayer. Student’s t test suggests that the difference in the kinetic cell adhesion responses in the absence and presence of epinephrine is significant with a p value of <0.0001 (Fig.7b). The net difference, by subtracting the adhesion DMR in the absence of epinephrine from its DMR in the presence of epinephrine, closely mimics the classic Gs-type DMR (Fang et al., 2005; Fang et al., 2007; Ferrie and Fang, 2008; Tran and Fang, 2008). These results suggest that the activation of the β2AR may increase cell adhesion through classic Gs-pathway mediated signaling, a possibility worthy of further examination. Furthermore, TIRF imaging showed that the presence of 1μM epinephrine caused a time-dependent decrease in fluorescence intensity (Fig.7c to f), mostly due to epinephrine-induced internalization of the β2AR-GFP fusion proteins. Together, these results suggest that epinephrine activates the β2AR-GFP, thereby causing receptor internalization during the cell adhesion process, but also resulting in an increase in cell adhesion.
Figure 7.
Impact of the β2AR signaling on cell adhesion on the fibronectin coated surface under physiological condition. (a) Dose-dependent responses arising from the cell adhesion in the presence of different ligands (epinephrine or carvedilol) at different doses. (b) Comparison in real-time DMR arising from the cell adhesion in the absence and presence of 1 μM epinephrine. (c-f) Representative time series TIRF images of the engineered cells in the presence of 1 μM epinephrine throughput the cell adhesion: (c) 5min; (d) 30min; (e) 60min; (f) 120min post cell adhesion. Image scale bar: 50 μm. For (a, b) the data represents mean±s.d. (n=4 for a; n = 12 for b).
4. Discussion
Cell adhesion to a surface is an active and dynamic process. Cells use their adhesion receptors to recognize and bind to molecules in the existing ECM. Cells can also secret and deposit their own ECM proteins to remodel the surface during cell adhesion. Cell signaling is part of cell adhesion process. The binding of cells to the ECM can activate signaling via integrins, resulting in an “outside-in” signal transduction so the cells can sense the composition, organization, density, rigidity, and biochemical and rigidity gradients of the ECM (Discher, et al., 2005; Engler et al., 2006; Mrksich, 2002; Plotnikov et al., 2013). On the other hand, receptor signaling can occur during the cell adhesion process in vivo; certain signaling mediated through receptors such as GPCRs can also cause remodeling of cell adhesion, resulting in an “inside-out” signal transduction (Raymond et al., 2007; Walsh et al. 2008). Here we used RWG biosensor-enabled label-free DMR assay and TIRF imaging approaches to show that the activation of the β2AR during cell adhesion process increases the adhesion of the engineered HEK293 cells onto the fibronectin coated sensor surface under physiological condition. The engineered cell line stably expresses human native β2-AR whose C-terminal is fused with GFP. The β2AR-GFP fusion protein was used as a cell surface marker not only to examine the cell adhesion process, but also to validate the receptor signaling and its impact on cell adhesion. The receptor activation in the presence of epinephrine was evidenced by the receptor internalization during the cell adhesion, as well as after cells form a monolayer.
Using RWG-enabled label-free DMR and TIRF imaging, we also showed that the cell adhesion is sensitive to both temperature and ECM coating, and distinct cellular mechanisms govern the cell adhesion under different conditions. Given that the complete serum media contains trace amount of ECM proteins such as fibrinogen, collagen, vitronectin, and fibronectin, and the cells can secret and deposit their own ECM proteins during cell adhesion process, it is no surprise that under all conditions the RGD peptide displayed the greatest effect among all inhibitors examined. Furthermore, we also observed temperature and surface dependent inhibition potency of the RGD peptide which may be indicative of the density of RGD binding motif presenting by different surfaces. The lower potency the RGD peptide is the higher density is for the RGD binding motif on the surface. On the other hand, the modulation pattern of different inhibitors also suggest that under ambient condition the adhesion of HEK-β2AR-GFP cells onto the tissue culture treated surface is unique in that it does not involve actin and microtubule remodeling, meaning no or minimal active adhesion process taking place. Under all other conditions both actin and microtubule remodeling are required for cell adhesion, and actin remodeling is at least more important in early cell adhesion process.
5. Conclusions
We had developed a RWG biosensor-enabled TRIF microscopy with moderate spatial resolution. Together with RWG biosensor enabled label-free DMR assays, we had found that the adhesion of an engineered cell line containing fluorescent β2ARs at the cell surface is dependent on ECM coating and temperature, and the activation of the β2ARs during the cell adhesion process increases the cell adhesion.
Acknowledgements
This work was partially supported by the National Institutes of Health Grant 5U54MH084691.
Biography
Ye Fang is the Research Director and Research Fellow of Biochemical Technologies in the Science & Technology Division at Corning Incorporated in New York (NY, USA). He received his BSc in Chemistry from the Hubei University (Hubei, China), MSc in Physical Chemistry from the Wuhan University (Hubei, China), and Ph.D in Physical Chemistry from the Institute of Chemistry, Chinese Academy of Sciences (Beijing, China). Following postdoctoral research at the University of Vermont from 1995 to 1996 and at the Johns Hopkins University School of Medicine from 1996 to 2000, he joined Corning Incorporated as a Senior Research Scientist. He was later appointed Research Associate, Research Manager, Senior Research Manager, and Research Fellow prior to taking his current position in 2013. He is an editorial board member of Sensors, Current Drug Discovery Technologies, Chemical Sensors, Journal of Biochips and Tissue Chips, and Journal of Integrated Omics. He has published 1 book, 18 book chapters, and more than 105 journal articles. He holds 23 US granted patents and 66 patent applications.
Footnotes
Publisher's Disclaimer: This is a PDF file of an unedited manuscript that has been accepted for publication. As a service to our customers we are providing this early version of the manuscript. The manuscript will undergo copyediting, typesetting, and review of the resulting proof before it is published in its final citable form. Please note that during the production process errors may be discovered which could affect the content, and all legal disclaimers that apply to the journal pertain.
References
- Chen JY, Shahid A, Garcia MP, Penn LS, Xi J. Biosens. Bioelectron. 2012;38:375–381. doi: 10.1016/j.bios.2012.06.018. [DOI] [PubMed] [Google Scholar]
- Discher DE, Janmey P, Wang YL. Science. 2005;310:1139–1143. doi: 10.1126/science.1116995. [DOI] [PubMed] [Google Scholar]
- Engler AJ, Sen S, Sweeney HL, Discher DE. Cell. 2006;126:677–689. doi: 10.1016/j.cell.2006.06.044. [DOI] [PubMed] [Google Scholar]
- Fang Y. Expert Opin. Drug Discov. 2010a;5:1237–1248. doi: 10.1517/17460441.2010.533652. [DOI] [PMC free article] [PubMed] [Google Scholar]
- Fang Y, 2010b J. Adhesion Sci. Technol. 24:1011–1021. [Google Scholar]
- Fang Y. Expert Opin. Drug Discov. 2011a;6:1285–1298. doi: 10.1517/17460441.2012.642360. [DOI] [PubMed] [Google Scholar]
- Fang Y. Intl. J. Electrochem. 2011b;2011:e460850. [Google Scholar]
- Fang Y, Ferrie AM. FEBS Lett. 2008;582:558–564. doi: 10.1016/j.febslet.2008.01.021. [DOI] [PubMed] [Google Scholar]
- Fang Y, Ferrie AM, Fontaine NH, Mauro J, Balakrishnan J. Biophys. J. 2006;91:1925–1940. doi: 10.1529/biophysj.105.077818. [DOI] [PMC free article] [PubMed] [Google Scholar]
- Fang Y, Ferrie AM, Fontaine NH, Yuen PK. Anal. Chem. 2005;77:5720–5725. doi: 10.1021/ac050887n. [DOI] [PubMed] [Google Scholar]
- Fang Y, Li G, Ferrie AM. J. Pharmacol. Toxicol. Methods. 2007;55:314–322. doi: 10.1016/j.vascn.2006.11.001. [DOI] [PubMed] [Google Scholar]
- Fang Y, Li G, Peng J. FEBS Lett. 2005;579:6365–6374. doi: 10.1016/j.febslet.2005.10.019. [DOI] [PubMed] [Google Scholar]
- Ferrie AM, Wu Q, Fang Y. Appl. Phys. Lett. 2010;97:223704. doi: 10.1063/1.3522894. [DOI] [PMC free article] [PubMed] [Google Scholar]
- Garcia MP, Shahid A, Chen JY, Xi J. Anal. Bioanal. Chem. 2013;405:1153–1158. doi: 10.1007/s00216-012-6558-6. [DOI] [PubMed] [Google Scholar]
- Giaever I, Keese CR. Nature. 1993;366:591–592. doi: 10.1038/366591a0. [DOI] [PubMed] [Google Scholar]
- Giancotti FG, Ruoslahti E. Science. 1999;285:1028–1032. doi: 10.1126/science.285.5430.1028. [DOI] [PubMed] [Google Scholar]
- Giebel K-F, Bechinger C, Herminghaus S, Riedel M, Leiderer P, Weiland U, Bastmeyer M. Biophys. J. 1999;76:509–516. doi: 10.1016/s0006-3495(99)77219-x. [DOI] [PMC free article] [PubMed] [Google Scholar]
- Horvath R, Cottier K, Pedersen HC, Ramsden JJ. Biosens. Bioelectron. 2008;24:799–804. doi: 10.1016/j.bios.2008.06.059. [DOI] [PubMed] [Google Scholar]
- Jin Z-H, Furukawa T, Waki A, Akaji K, Coll J-L, Saga T, Fujibayshi Y. Biol. Pharmacol. Bull. 2010;33:370–378. doi: 10.1248/bpb.33.370. [DOI] [PubMed] [Google Scholar]
- Liu J, Tan Y, Zhang H, Zhang Y, Xu P, Chen J, Poh Y-C, Tang K, Wang N, Huang B. Nat. Materials. 2012;11:734–741. doi: 10.1038/nmat3361. [DOI] [PMC free article] [PubMed] [Google Scholar]
- Lutolf MP, Gilbert PM, Blau HM. Nature. 2009;462:433–441. doi: 10.1038/nature08602. [DOI] [PMC free article] [PubMed] [Google Scholar]
- May JA, Ratan H, Glenn JR, Lösche W, Spangenberg P, Heptinstall S. Platelets. 1998;9:227–232. doi: 10.1080/09537109876744. [DOI] [PubMed] [Google Scholar]
- Mrksich M. Curr. Opin. Chem. Biol. 2002;6:794–797. doi: 10.1016/s1367-5931(02)00362-9. [DOI] [PubMed] [Google Scholar]
- Panda D, Jordan MA, Chu KC, Wilson L. J. Biol. Chem. 1996;271:29807–29812. doi: 10.1074/jbc.271.47.29807. [DOI] [PubMed] [Google Scholar]
- Parsons JT, Horwitz AR, Schwartz MA. Nat. Rev. Mol. Cell Biol. 2010;11:633–643. doi: 10.1038/nrm2957. [DOI] [PMC free article] [PubMed] [Google Scholar]
- Peterson AW, Halter M, Tona A, Bhadriraju K, Plant AL. BMC Cell Biol. 2009;10:16. doi: 10.1186/1471-2121-10-16. [DOI] [PMC free article] [PubMed] [Google Scholar]
- Peterson AW, Halter M, Tona A, Bradriraju K, Plant AL. Cytometry A. 2010;77A:895–903. doi: 10.1002/cyto.a.20938. [DOI] [PubMed] [Google Scholar]
- Plotnikov SV, Pasapera AM, Sabass B, Waterman CM. Cell. 2012;151:1513–1527. doi: 10.1016/j.cell.2012.11.034. [DOI] [PMC free article] [PubMed] [Google Scholar]
- Prinster SC, Hague C, Hall RA. Pharmacol. Rev. 2005;57:289–298. doi: 10.1124/pr.57.3.1. [DOI] [PubMed] [Google Scholar]
- Ramsden JJ, Horvath R. J. Recept. Signal Transduct. 2009;29:211–223. doi: 10.1080/10799890903064119. [DOI] [PubMed] [Google Scholar]
- Raymong DR, Wilson LS, Carter RL, Maurice DH. Cell Signaling. 2007;19:2507–2518. doi: 10.1016/j.cellsig.2007.08.005. [DOI] [PubMed] [Google Scholar]
- Saitakis M, Gizeli E. Cell. Mol. Life Sci. 2012;69:357–371. doi: 10.1007/s00018-011-0854-8. [DOI] [PMC free article] [PubMed] [Google Scholar]
- Schwartz MA, Ginsberg MH. Nat. Cell Biol. 2002;4:E65–E68. doi: 10.1038/ncb0402-e65. [DOI] [PubMed] [Google Scholar]
- Stevens MM, George JH. Science. 2005;310:1135–1138. doi: 10.1126/science.1106587. [DOI] [PubMed] [Google Scholar]
- Tran E, Fang Y. J. Biomol. Screen. 2008;13:975–985. doi: 10.1177/1087057108326141. [DOI] [PubMed] [Google Scholar]
- Tran E, Sun H, Fang Y. Assay Drug Dev. Technol. 2012;10:37–45. doi: 10.1089/adt.2011.0392. [DOI] [PMC free article] [PubMed] [Google Scholar]
- Trappmann B, Gautrot JE, Connelly JT, Strange DGT, Li Y, Oyen ML, Stuart MAC, Boehm H, Li B, Vogel V, Spatz JP, Watt FM, Huck WTS. Nat. Materials. 2012;11:642–649. doi: 10.1038/nmat3339. [DOI] [PubMed] [Google Scholar]
- Tubio MR, Fernandez N, Fitzsimons CP, Copsel S, Santiago S, Shayo C, Davio C, Monczor F. J. Biol. Chem. 2010;285:14990–14998. doi: 10.1074/jbc.M109.099689. [DOI] [PMC free article] [PubMed] [Google Scholar]
- Ulbrich H, Eriksson EE, Lindbom L. Trends Pharmacol. Sci. 2003;24:640–647. doi: 10.1016/j.tips.2003.10.004. [DOI] [PubMed] [Google Scholar]
- Vasquez RJ, Howell B, Yvon AM, Wadsworth P, Cassimeris L. Mol. Biol. Cell. 1997;8:973–985. doi: 10.1091/mbc.8.6.973. [DOI] [PMC free article] [PubMed] [Google Scholar]
- Walsh CT, Stupack D, Brown JH. Mol. Interv. 2008;8:165–173. doi: 10.1124/mi.8.4.8. [DOI] [PMC free article] [PubMed] [Google Scholar]
- Wegener J, Keese CR, Giaever I. Exp. Cell Res. 2000;259:158–166. doi: 10.1006/excr.2000.4919. [DOI] [PubMed] [Google Scholar]
- Yashunsky V, Lirtsman V, Zilbershtein A, Bein A, Schwartz B, Aroeti B, Golosovsky M, Davidov D. J. Biomed. Optics. 2012;17:081409. doi: 10.1117/1.JBO.17.8.081409. [DOI] [PubMed] [Google Scholar]
- Zaidel-Bar R, Itzkovitz S, Ma’ayan A, Iyengar R, Geiger B. Nat. Cell Biol. 2007;9:858–867. doi: 10.1038/ncb0807-858. [DOI] [PMC free article] [PubMed] [Google Scholar]


