

Abstract
Projections from auditory cortex (AC) affect how cells in both inferior colliculi (IC) respond to acoustic stimuli. The large projection from the AC to the ipsilateral IC is usually credited with the effects in the ipsilateral IC. The circuitry underlying effects in the contralateral IC is less clear. The direct projection from the AC to the contralateral IC is relatively small. An unexplored possibility is that the large ipsilateral cortical projection contacts the substantial number of cells in the ipsilateral IC that project through the commissure to the contralateral IC.
Apparent contacts between cortical boutons and commissural cells were identified in the left IC after injection of different fluorescent tracers into the left AC and the right IC. Commissural cells were labeled throughout the left IC, and many (23–34%) appeared to be contacted by cortical axons. In the central nucleus, both disc-shaped and stellate cells were contacted. Antibodies to glutamic acid decarboxylase (GAD) were used to identify GABAergic commissural cells. The majority (>86%) of labeled commissural cells were GAD-immunonegative. Despite low numbers of GAD-immunopositive commissural cells, some of these cells were contacted by cortical boutons. Nonetheless, most cortically-contacted commissural cells were GAD-immunonegative (i.e., presumably glutamatergic).
We conclude that auditory cortical axons contact primarily excitatory commissural cells in the ipsilateral IC that project to the contralateral IC. These corticocollicular contacts occur in each subdivision of the ipsilateral IC, suggesting involvement of commissural cells throughout the IC. This pathway – from AC to commissural cells in the ipsilateral IC - is a prime candidate for the excitatory effects of activation of the auditory cortex on responses in the contralateral IC. Overall this suggests that the auditory corticofugal pathway is integrated with midbrain commissural connections.
Keywords: auditory cortex, commissure of the inferior colliculus, corticofugal pathways, sound localization, modulation
1. INTRODUCTION
The auditory cortex (AC) is the source of a large projection to the inferior colliculus (IC), a major midbrain center of auditory integration. Stimulation or inactivation of this cortico-collicular pathway can alter the responses of many neurons in the ipsilateral IC (Massopust and Ordy, 1962; Amato et al., 1969; Syka and Popelar, 1984; Sun et al., 1989). The alterations include changes in frequency, amplitude and duration tuning (Suga, 2008), rate-level functions (Popelar et al., 2003), spatial sensitivity (Jen et al., 1998; Nakamoto et al., 2008), selectivity for harmonic complexes (Nakamoto et al., 2010) and stimulus-specific adaptation (Anderson and Malmierca, 2013). The AC projects directly to the lateral cortex1 (IClc), rostral cortex (ICrc), dorsal cortex (ICd) and central nucleus (ICc) of the ipsilateral IC (Saldaña et al., 1996; Winer et al., 1998), and it is assumed that these projections are directly responsible for many of the effects described above (Winer, 2005).
The AC can also excite or inhibit responses in the contralateral IC (Torterolo et al., 1998; Ma and Suga, 2001, unpublished observations). In guinea pigs, over two-thirds of ICc cells showed changes in sound-evoked activity as a result of electrical stimulation of the contralateral primary AC (Torterolo et al., 1998). The circuitry underlying these effects is not clear. The AC projects directly to the contralateral IC, but this projection is much smaller than the ipsilateral one, and terminates exclusively in the cortical areas of the contralateral IC (Bajo and Moore, 2005; Bajo et al., 2007; Coomes Peterson and Schofield, 2007). There is no evidence of a cortical projection to the contralateral ICc, so both the excitatory and inhibitory effects of the AC on the contralateral ICc must depend on a disynaptic or multisynaptic pathway.
Moore (1988) has shown that the contralateral IC contains the largest number of labeled cells (compared to other hindbrain nuclei) after injection of a retrograde tracer into the IC. Similar results in other species confirm the large number of cells in the commissural pathway, and studies with anterograde tracers demonstrate widespread terminations of the commissural pathway (reviewed by Saldaña and Merchan, 2005). Stimulation or suppression of the commissural pathway affects the majority of IC cells (Smith, 1992; Moore et al., 1998; Reetz and Ehret, 1999; Malmierca et al., 2003; Malmierca et al., 2005; Du et al., 2009), suggesting that inputs to the commissural pathway could have widespread effects in the contralateral IC. Furthermore, stimulation of the commissure leads to both excitation and inhibition of IC cells (Moore et al., 1998; Reetz and Ehret, 1999). The excitation and inhibition is thought to be mediated exclusively by glutamate and GABA (Smith 1992; Moore et al., 1998). The majority of the commissural cells are believed to be glutamatergic, consistent with direct excitation of target cells. The remaining commissural cells are GABAergic, and presumably account for inhibition of commissural targets (González-Hernández et al., 1996; Hernández et al., 2006). It is possible that the large projection from the AC to the ipsilateral IC contacts commissural cells that project throughout contralateral the IC. Commissural cells in the ICc and ICd project to all parts of the contralateral IC and thus could convey cortical effects throughout the contralateral IC (Saldaña and Merchan, 2005). Another major subdivision of the IC, the IClc, also contains commissural cells, but apparently few of these project to the contralateral ICc (Malmierca et al., 2009) so they are less likely to relay cortical influences to the opposite side. Whether cortical axons contact excitatory or inhibitory commissural cells is unknown. Given the sizes of the cortico-collicular pathway and the commissural pathway, a disynaptic pathway from AC to IC commissural cells could represent the largest route for one AC to excite or inhibit the contralateral IC. The present study was designed to identify connections consistent with this hypothesis. The results support the existence of primarily excitatory disynaptic pathways from auditory cortex to the contralateral IC and suggests that different IC subdivisions contribute to differing degrees.
2. MATERIALS AND METHODS
2.1 Subjects
Tracing experiments were performed on 6 adult pigmented guinea pigs of either gender weighing 410 to 867 g (Elm Hill Breeding Laboratories, Chelmsford, MA, USA). Tissue from one additional animal was used for Western blot analysis. All procedures were approved by the Institutional Animal Care and Use Committee and administered following the National Institutes of Health guidelines for the care and use of laboratory animals. In accordance with these guidelines, all efforts were made to minimize the number of animals used and their suffering.
2.2 Surgery and perfusion
Each guinea pig was anesthetized prior to surgery with isoflurane (4–5% for induction, 1.75–3% for maintenance) in oxygen. The animal was given atropine sulfate (0.08g mg/kg, i.m.) to reduce bronchial secretions. The eyes were kept moist with a coating of antibiotic ointment (Neosporin Ophthalmic). The animal’s head was shaved and disinfected. The animal was placed on a feedback-controlled heating pad to maintain body temperature. An incision was made in the scalp and the margins of the incision were injected with a long-lasting local anesthetic (0.25% bupivacaine; Sensorcaine; Astra USA, Inc., Westborough, MA, USA). Stereotaxic coordinates or skull landmarks were used to guide all injections. A dental drill was used to open the skull at appropriate locations.
Five different fluorescent tracers were used: FluoroRuby (FR, 10% solution in saline; tetramethylrhodamine dextran, 10,000 molecular weight, Invitrogen, Eugene, OR); fluorescein dextran (FD, 10% in saline, 10,000 molecular weight, Invitrogen. Eugene, OR); Fast Blue (FB, 5% aqueous solution; EMS-Chemie GmbH, Gross-Umstadt Germany); FluoroGold (FG, 4% in distilled water, FluoroChrome, Inc., Englewood, CO); green IX RetroBeads (“green beads”, GB, Lumafluor Inc., Naples, FL)(Table 1). Each tracer was injected with a microsyringe dedicated for use only with that tracer.
Table 1.
List of tracers injected into the auditory cortex (AC) and inferior colliculus (IC) in the cases used in this study.
| Case | Tracer in left AC | Tracer in right IC |
|---|---|---|
| GP 566 | FR | FB |
| GP 596 | FD | FR |
| GP 606 | FR | GB |
| GP 608 | FR | GB |
| GP 613 | FR | FD |
| GP 622 | FR | FG |
FB – Fast Blue; FD – fluorescein dextran; FG – FluoroGold; FR – FluoroRuby; GB – green beads.
FR or FD was injected into the AC because these tracers are highly effective in labeling the corticocollicular pathway (Coomes Peterson and Schofield, 2007). Two methods were used to deposit tracer across a wide expanse of the AC. In the first method (used in 3 animals), a 10 μl Hamilton microsyringe was oriented approximately perpendicular to the cortical surface. Six to eighteen injections were made across an area covering 1 to 6 mm caudal to Bregma and ventrolateral to the pseudosylvian sulcus (this region is centered on the core AC areas; Wallace et al., 2000). For each injection, the microsyringe was inserted 1 mm into the AC. At each site 0.2 μl of tracer was injected, for a total 1.2–3.6 μl of tracer across the AC. For the second method of injecting cortex (3 animals), a 10 μl microsyringe was rotated in the transverse plane to an angle roughly parallel to the surface of the AC. It was then inserted into the cortex at a point dorsomedial to the AC and advanced ventro-laterally until resistance was met, indicating the syringe tip had reached the bone ventro-lateral to the AC. The microsyringe was then withdrawn and multiple injections of 0.2 μl of FD or FR were made during withdrawal. The syringe was inserted 2–3 times along the rostral-caudal extent of the AC, for a total of 4 – 6 μl of tracer injected across the AC.
Five different tracers were used for labeling the commissural cells (Table 1). Stereotaxic coordinates were used to guide injections into the right IC (contralateral to the cortical injection). Each injection was made with a 1μl Hamilton microsyringe inserted into the IC using a vertical approach. An injection of 0.15 – 0.2 μl was made into 2–4 different sites within the IC. Each injection was made over a 3 to 5 minute period.
Following all injections, the exposed brain was covered with Gelfoam and the scalp was sutured. After surgery the animal was placed in a clean cage and monitored until it was ambulatory. At that point, it was transported in its cage to the animal facility.
After 10–15 days, the animal was sacrificed by inhalation of isoflurane until cessation of breathing and loss of withdrawal reflex. The animal was perfused through the aorta with approximately 100 ml of Tyrode’s solution (pH 7.4), followed by 350 ml of 4% paraformaldehyde in 0.1M phosphate buffer, pH 7.4 (PB) and then 350 ml of 4% paraformaldehyde with 10% sucrose in PB. The brain was then removed and stored at 4°C in 4% paraformaldehyde with 25–30% sucrose in PB overnight. The brain was frozen and cut on a sliding microtome into 50-μm thick transverse sections. Sections were collected in six series. Series were mounted on gelatin-coated slides, processed for immunohistochemistry (described below) or stored in freezing buffer at −20°C for future processing.
2.3 Tissue Preparation
An immunostain for glutamic acid decarboxylase (GAD) was used to label GABAergic cells in the IC. Staining was accomplished with mouse antibody to GAD 67 (Millipore Cat. No MAB5406), biotinylated goat–anti-mouse secondary antibody (diluted 1:100; Vector Laboratories Cat. No BA-9200), and streptavidin Alexa Fluor 647 (Molecular Probes Cat. No S21374) or Alexa Fluor 488 (Molecular Probes Cat. No A21202). For optimizing the staining, a 25-fold dilution series was employed with the anti-GAD antibody tested at dilutions ranging from 1:100 through 1:2500. All tested dilutions produced staining compatible with known patterns of GABAergic neuron distribution in the brainstem (e.g., González-Hernández et a., 1996; Merchan et al., 2005). An intermediate concentration (1:500 or 1:1000) was chosen for routine use because these dilutions produced robust staining with minimal background fluorescence. Stained sections were mounted on slides, dried overnight and then coverslipped with DPX (Aldrich Chemical Company, Inc., Milwaukee, WI, USA). Western blot analysis showed a single band of staining at the expected molecular weight.
A stain for nicotinamide adenine dinucleotide phosphate diaphorase (NADPH) or brain nitric oxide synthase (bNOS) was used on one series of sections to identify IC subdivisions (NADPH: Dawson et al., 1991; bNOS: Coote and Rees, 2008). Reagents for the bNOS stain included mouse monoclonal antibody to bNOS (Sigma Cat. No N2280), biotinylated goat-anti-mouse secondary antibody (Vector Laboratories Cat. No BA-9200), and avidin-biotin-peroxidase kit (ABC Elite kit, Vector Laboratories). All sections were mounted on slides, dried overnight and then coverslipped with DPX (Aldrich Chemical Company, Inc., Milwaukee, WI, USA).
2.4 Data Analysis
Labeled structures were examined with a Zeiss Axioplan 2 fluorescence microscope attached to a Neurolucida computer-microscope plotting system (MBF Bioscience, Williston, VT). Potential contacts between labeled cortical boutons and labeled commissural or GABAergic commissural cells were identified under careful examination with a 63x oil-immersion objective (NA = 1.4). Boutons were readily identified along the axonal trunk or at the end of axonal branches labeled with either FR or FD. Such swellings were presumed to be sites of synapses between cortical axons and IC cells, consistent with electron microscopic descriptions of cortical boutons in the IC (Saldaña et al., 1996; Nakamoto et al., 2013). Boutons in close apposition to a labeled cell body or dendrite were considered putative synapses. The examination included carefully focusing through the full depth of the bouton and ensuring that presumptive pre- and post-synaptic components were in focus in the same plane. Detection of a gap between the labeled bouton and the retrogradely-labeled profile suggested that the pair did not form a synapse and the bouton was excluded from further analysis. The location of a labeled structure or contact was assigned to a particular IC subdivision by comparison with a nearby section stained with NADPH or bNOS and criteria described by Coote and Rees (2008).
Six cases were examined for contacts between cortical boutons and commissural cells. Putative contacts were documented photographically in all cases. Two cases (GP 596, GP 608) with extensive labeling were chosen for quantitative analysis. The Neurolucida system was used to plot commissural cells in every sixth section through the IC in each case (50 μm sections). The cell body of every labeled commissural cell, with visible appendages or internal processes, was outlined and the cross sectional area calculated (in sq μm). Each cell was assessed for GAD immunolabel and for cortical contacts onto the soma or labeled dendrites. The GAD staining was generally robust, with straightforward distinction between immunopositive and immunonegative cells. Borderline cases, in which the level of GAD staining was difficult to assess, were rare and should not have affected our results substantially. The soma outline was then color-coded to indicate whether that cell received contacts from labeled AC axons. The results provide several quantitative assessments of commissural cells. First, the percentage of commissural cells that were contacted by AC boutons was calculated for each IC subdivision (# of cortically-contacted, tracer-labeled cells in the subdivision/total # of tracer-labeled cells in the subdivision). Second, the percentage of GAD-immunopositive commissural cells that were contacted by AC boutons was calculated for each IC subdivision. In some cases, the GAD immunolabel did not penetrate completely through the tissue, producing a “sandwich” of tissue in the middle of the section that lacked immunostaining. These regions were excluded from quantitative analysis by carefully measuring of the depth of immunostaining and counting only those cells at depths that had successful immunostain. To be included in the analysis the soma of the cell needed to be located within the immunostained area. Third, the distribution of soma areas of cortically-contacted GAD-positive and GAD-negative commissural cells was compared to the distribution of soma areas for all the labeled commissural cells. Graphing was accomplished with Microsoft Excel (Microsoft, Redmond, WA, USA).
2.5 Photography
Photomicrographs of contacts between cortical boutons and commissural cells were taken with a 63x oil immersion objective (NA = 1.4) on a Zeiss AxioImager Z1m fluorescence microscope equipped with an Axiocam HRm digital camera and Axiovision 4 software. In some cases, a Zeiss Apotome was used to provide structured illumination and optical sectioning (providing an image “z-stack”, similar to those obtained with confocal microscopy). For subsequent presentation of the images, the z-stacks were flattened (using the Axiovision software) to facilitate a wider depth of focus and thus easier recognition of labeled structures (axons, boutons, cell bodies and dendrites). In all cases, potential contact between a bouton and labeled cell was assessed before the compression of the z-stack. Monochrome images were colorized by merging the gray-scale layer with a color fill layer in Adobe Photoshop.
Prior to sectioning, surface photographs of the cortical injection sites were taken with a Nikon SMZ1500 dissecting microscope (Nikon Inc., Melville, NY, USA) equipped with an Excite 120 light source (Exfo, Quebec, Canada) for fluorescence imaging and a Retiga 2000R digital camera (Q Imaging, Surrey, BC, Canada) for photography. Images were collected with both natural lighting and fluorescence lighting/filtering. The two images were overlaid to show the fluorescent injection sites relative to the whole cortex. After the brain was sectioned, additional photomicrographs of the cortical and collicular injection sites were taken with a Zeiss Axiocam HRc camera attached to a Zeiss AxioImager Z1 microscope (Carl Zeiss, Inc., Thornwood, NY, USA). Initial image processing (e.g. contrast adjustment) was done with the Axiovision software. The photographs of the IC injection site and adjacent bNOS or NADPH stained section were overlaid in Adobe Photoshop (Adobe Systems, Inc., San Jose, CA, USA) and the subdivisions of the IC were then identified. Adobe Photoshop was used to make final adjustments of image size, levels and color balance. Photoshop and/or Adobe Illustrator were used to arrange and label photographs and figures. Plots were exported from Neurolucida to Adobe Illustrator for final production of line drawings.
3. RESULTS
3.1 Injections into the left auditory cortex
We injected FluoroRuby (FR) or fluorescein dextran (FD) across a wide swath of auditory cortex in order to label a large number of corticocollicular axons. Figure 1A shows a surface view of a FluoroRuby injection in a representative case. FR was deposited along 3 parallel, tangential penetrations (arrows), extending ventrolaterally from the pseudosylvian sulcus (approaching, but not reaching, the rhinal sulcus; Fig. 1A). In the antero-posterior dimension, the deposits spread over a distance of nearly 4 mm. By comparison with published physiological maps of the AC in guinea pigs (Wallace et al., 2000, 2002), one can conclude that the majority of the FR was deposited into the two large, tonotopically-organized core fields, the primary AC and the dorsocaudal area. Given the dorsal spread of tracer, approaching the pseudosylvian sulcus, it is possible that one or more belt areas (the “small area” and the dorsorostral belt) were also injected. It is unlikely that the injections included all of the AC; for example, the dorsocaudal field and some of the belt areas surrounding it extend much more caudally than the injected area (these fields extend 7 mm or more caudal to the skull landmark “Bregma”, whereas our injections were focused on the region 1–6 mm caudal to Bregma). Retrograde labeling in the thalamus extended throughout the medial geniculate, consistent with a large injection in the AC. Examination of transverse cortical sections through the injection sites showed that the deposits typically included multiple cortical layers, but did not spread into the subcortical white matter (Fig. 1B). It is unlikely, then, that the subcortical labeling resulted from labeling axons of passage. There was no evidence, in the extent of cortical or thalamic labeling, that the tracer deposits spread beyond the AC areas defined by Wallace et al. (2000; 2002).
Figure 1.
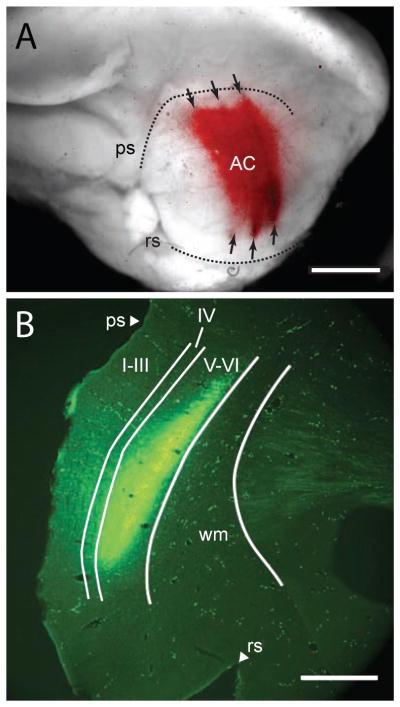
Representative injection sites in left auditory cortex (AC). (A) A photograph taken with a fluorescence macroscope showing the lateral surface of the left hemisphere with FluoroRuby (FR, red) deposits along three tangential penetrations (arrows) that traversed the left AC. GP 622. Caudal is right, dorsal is up. Scale bar = 4 mm. Dotted lines indicate the pseudosylvian sulcus (ps) and rhinal sulcus (rs). (B) Transverse section showing a long deposit of fluorescein dextran resulting from a series of deposits in a tangential penetration in the left auditory cortex. GP 596. Medial is right, dorsal is up. Scale bar = 1 mm. I–VI – cortical layers I through VI; ps – pseudosylvian sulcus; rs – rhinal sulcus; wm – white matter.
Labeled axons were present bilaterally in the IC; the present report will consider only axons in the larger corticocollicular projection, ipsilateral to the injected cortex. Labeled axons were very numerous in the IClc, ICrc and ICd. Notably fewer axons were visible in the ICc. These axons were more numerous in the dorsal part of the ICc, though they were present throughout the subdivision. The axons in the ICc were generally very thin (approximately 0.2–0.4 μm in diameter; Fig. 2B), which contrasted with the labeled axons in the surrounding regions, where axons ranged from thin to thicker than those seen in the ICc (0.2–0.8 μm in diameter; Fig. 2A, C). Of particular significance for the present study is that boutons were recognizable in all subdivisions of the IC (Fig. 2, small arrowheads).
Figure 2.

Photomicrographs showing labeled axons and boutons in the lateral cortex (A), dorsal cortex (B), rostral cortex (C), and central nucleus (D) of the left IC after a FluoroRuby injection in the left AC. In the cortical areas (IClc, ICd and ICrc, panels A–C), both large diameter axons (>0.4 μm, large arrowheads) and small diameter axons (<0.4 μm, arrows) were labeled. In the ICc (panel D), only small diameter axons (<0.4μm, arrows) were labeled. Labeled boutons (small arrowheads) were present in all subdivisions. Scale bar = 20 μm.
3.2 Injections into the right inferior colliculus
We injected a second fluorescent tracer (different from that injected into the AC) into the right IC, which is contralateral to the AC injection, in order to label commissural cells in the left IC. In general, we attempted to make large injections involving as much of the IC as possible in order to maximize labeling of commissural cells and thus maximize opportunities for identifying AC inputs to the commissural system. Typically, the injection site included parts of all major IC subdivisions (Fig. 3A). The tracer frequently spread to the dorsal, caudal or lateral border of the IC. Some injections also spread rostrally to include parts of the ICrc, but none of the injections spread into the rostrally adjacent superior colliculus. Finally, none of the injections spread ventrally beyond the border of the IC, or medially into the periaqueductal gray or across the midline into the left IC. In no one case was the entire IC injected, but across cases the injection sites included all but the most dorsomedial part of the IC. In one case, an injection of FluoroRuby was completely confined to the ICc (Fig. 3B), so the majority of labeled cells are likely to have axons that terminate within the ICc. Observations in this case were particularly relevant for comparison with the physiological studies of cortical effects on the contralateral IC (described in the Introduction), which drew their conclusions from recordings of neuronal activity in the ICc. In the following sections, we will describe the results from the large injections, and then provide data from the case with the injection confined to the ICc.
Figure 3.
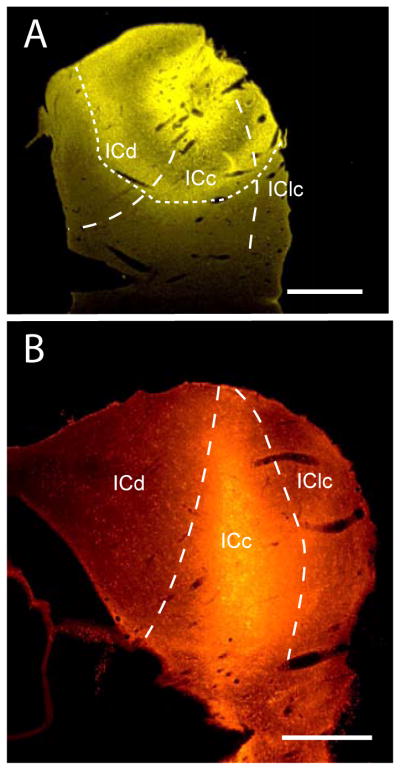
Representative injection sites in the right inferior colliculus (IC). (A) Transverse section through a FluoroGold deposit site (dotted lines) that included all major subdivisions of the right IC. Borders between IC subdivisions (solid lines) could not be determined near the center of the injection site due to tissue damage caused by the injection. GP 622. Lateral is right, dorsal is up. Scale bar = 1 mm. (B) Transverse section through a FluoroRuby deposit site that was centered on the ICc. GP 596. Lateral is right, dorsal is up. Scale bar = 1 mm. ICc – central nucleus of the IC; ICd – dorsal cortex of the IC; lClc– lateral cortex of the IC.
The injections into the right IC labeled cells in many areas, including the left IC and numerous sub-collicular nuclei. The latter included auditory nuclei (e.g., cochlear nucleus, nuclei in the superior olivary complex and lateral lemniscus) and, in cases in which the IClc or ICrc were injected, somatosensory nuclei (spinal trigeminal nuclei, dorsal column nuclei). For the remainder of this report, we will focus on the commissural cells located in the left IC. Briefly, the largest injections labeled the most commissural cells. Smaller injections labeled fewer cells that were most numerous in the same IC subdivisions in which the injections were focused. All injections labeled commissural cells in all subdivisions of the left IC.
3.3 Identification of cortical contacts on commissural cells in the left IC
Figure 4 shows results from an experiment in which FR was injected into the left AC and FB was injected into the right IC. Numerous contacts between FR-labeled boutons and FB-labeled commissural cells were found in the left IC (Fig. 4). Contacts were found on cell bodies (arrows, Fig. 4) and on dendrites (arrowheads, Fig. 4A, E). Similar results were obtained with the other combinations of tracers. Despite the large number of contacts observed, the vast majority of labeled cortical boutons were located in neuropil without obvious association with commissural cells. The retrograde tracers rarely labeled the dendrites beyond the first branch point, so contacts onto more distal dendritic locations would not have been identifiable in our material. Consequently, it was not possible to determine whether many boutons contacted non-commissural cells, or contacted commissural cells that were labeled incompletely (or not at all) by the tracer injection.
Figure 4.
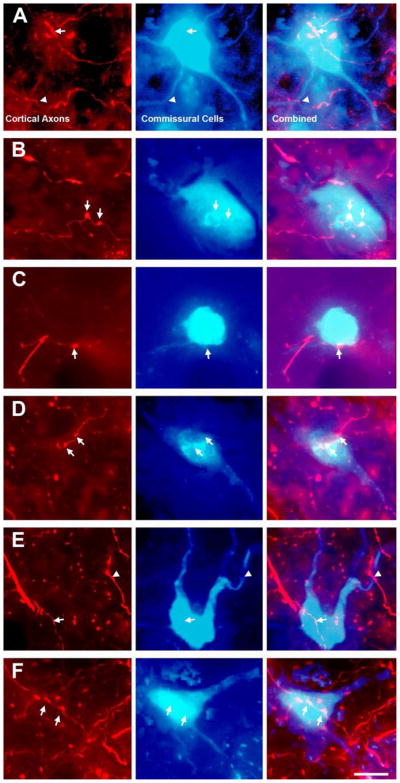
Fluorescence photomicrographs showing cortical contacts onto labeled commissural cells in the lateral cortex (A, B), central nucleus (C, D) and dorsal cortex (E, F) of the left IC. The first column shows cortical axons and boutons labeled with FluoroRuby (red). The second column shows the same field of view filtered for Fast Blue (blue), showing labeled commissural cells and proximal dendrites. The third column shows an overlay of the cortical axons and the commissural cells. Contacts between FR-labeled cortical boutons and FB-labeled commissural cell bodies (arrows) or dendrites (arrowheads) were observed. Transverse sections. Scale bar = 20 μm.
A small proportion of the commissural cells in the ICc were labeled sufficiently to distinguish stellate cells from disc-shaped cells. Some cells had an elongated soma and dendritic tree, both oriented dorsomedial to ventrolateral, consistent with disc-shaped morphology (Fig. 5A, B, left column). Other cells had a multipolar soma and dendrites that were oriented in multiple directions, consistent with stellate morphology (Fig. 5C, D left column). Despite the relatively low density of cortical axons in the ICc, both disc-shaped cells and stellate cells were contacted by cortical boutons (Fig. 5, right column). Because so few of the cells could be assigned with confidence to a morphological class, we could not determine whether one or the other class was contacted by cortical axons more frequently. However, the data do suggest that cortical axons make direct contact with members of both disc-shaped and stellate classes.
Figure 5.

Fluorescence photomicrographs showing contacts between FluoroRuby-labeled cortical boutons and FluoroGold-labeled disc-shaped or stellate commissural cells in the central nucleus of the left IC. The first column shows commissural cells in the left IC retrogradely labeled with FluoroGold (FG, yellow). The second column shows an overlay of the FG label and cortical axons labeled by FluoroRuby (FR, red) in the same field of view. Arrows indicate contacts between FG-labeled commissural cells and FR-labeled cortical boutons. Inserts show expanded views (3x enlargement) of contacts between commissural cells and cortical boutons. The orientation of the fibrodendritic laminae – from dorsomedial to ventrolateral (A, line with double arrows) - could be identified by the orientation of many of the labeled structures (axons and cells). Disc-shaped cells (A, B) had a somatodendritic orientation parallel to the laminae. Stellate cells (C, D) had no apparent orientation. All images were taken at the same orientation: dorsal is up and medial is to the right. Transverse sections. Scale bar = 20 μm.
3.4 Identification of cortical contacts onto GABAergic commissural cells in the left IC
We immunostained for GAD to identify GABAergic commissural cells. GAD-immunopositive (GAD+) cells were present in multiple auditory nuclei (e.g., dorsal nuclei of the lateral lemniscus and superior paraolivary nucleus) and non-auditory nuclei (e.g., substantia nigra). GAD+ cells were present in all subdivisions of the left IC. A portion of the tracer-labeled commissural cells in each IC subdivision were immunopositive for GAD (Fig. 6). Following a large deposit of tracer that involved all subdivisions of the right IC, GAD+ commissural cells were present in all subdivisions of the left IC (Fig. 7A). In the case illustrated, the majority of commissural cells were located in the ICd, where about 8% of the commissural cells were GAD+. Commissural cells were much less numerous in the other IC subdivisions, where GAD+ staining characterized 4% (ICc) 21% (ICrc) or 13% (IClc) of the commissural cells. Overall, about 8% of the commissural cells were GAD+. Results were similar after an injection of retrograde tracer that was confined to the ICc (case GP 596; Fig. 7B), except that the commissural cells were spread more evenly across the IC subdivisions (instead of being concentrated in the ICd). Once again, the number of GAD+ commissural cells was rather small, making up about 13% of the commissural cells in this case and ranging from 8–28% of the commissural cells in a single IC subdivision. The results indicate, 1) that all IC subdivisions project to the contralateral ICc, 2) that all IC subdivisions contribute GAD+ and GAD-negative commissural projections; and, 3) that GAD+ cells make up only a small portion (~9%, averaged across the 2 quantified cases) of the commissural cells in all IC subdivisions.
Figure 6.
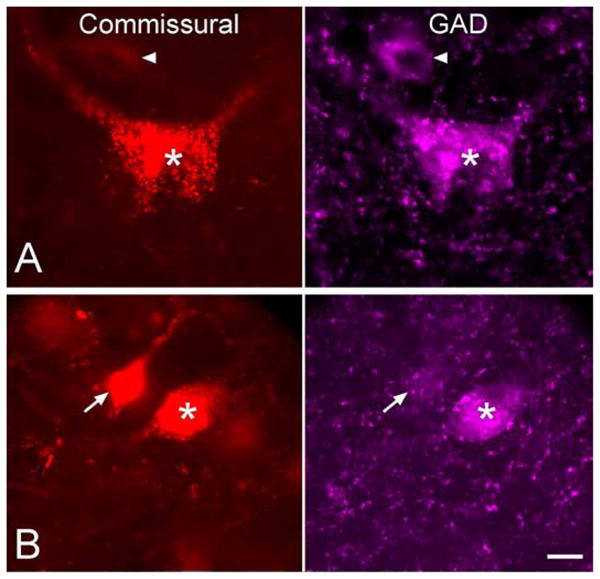
Fluorescence photomicrographs showing GAD-immunopositive (GAD+) and GAD-negative commissural cells. In each row, the left column shows commissural cells in the left IC that were retrogradely labeled by an injection of FluoroRuby into the right IC. The right column shows the same field of view filtered for GAD-immunolabel (AlexaFluor647, colored magenta). Double-labeled cells (i.e., GAD+ commissural cells) are present in each row (*). Row A includes an example of a GAD+ cell that was not labeled by the tracer (arrowhead). Row B includes an example of a tracer-labeled commissural cell that was GAD-negative (arrow). Scale bar = 10 μm.
Figure 7.

Graphs showing the number of tracer-labeled commissural cells that were immunopositive (GAD+) or immunonegative (GAD-neg). A. Results from a case in which the green beads were deposited in all subdivisions of the right IC. B. Results from a case in which FluoroRuby was deposited in the right ICc. For each case, values are shown for individual IC subdivisions and for the IC overall (“all IC”). ICc, central nucleus of the inferior colliculus; ICd, dorsal cortex of the inferior colliculus; IClc, lateral cortex of the inferior colliculus; ICrc, rostral cortex of the inferior colliculus.
We observed cortical contacts on GAD+ commissural cells, although these were rare compared to contacts on GAD-negative commissural cells. Figure 8 shows examples from an experiment in which FD was injected into the left AC and FR was injected into the right IC. Figure 8A shows a GAD+ commissural cell with several cortical boutons in close contact with the cell body. Much more often we observed cortical contacts on GAD-negative commissural cells. In many cases these immunonegative cells were located in the same focal plane as nearby GAD+ cells, suggesting that the immunonegative staining of the commissural cell was not due to failure of the immunostaining protocol (Fig. 8B).
Figure 8.

Fluorescence photomicrographs showing contacts between FD-labeled auditory cortical axons and GAD-immunopositive (A) or GAD-immunonegative (B) commissural cells in the inferior colliculus. In each column, the top row shows FluoroRuby-labeled commissural cells, the second row shows the same view filtered for GAD-labeled cells (magenta) and the third row shows an overlay of the first two rows plus an image of the cortical axons labeled with fluorescein dextran (green). A) Two commissural cells are labeled with FluoroRuby (red). One cell (G+) is GAD+ and the other cell (G−) is GAD-negative. Fluorescein dextran-labeled cortical boutons appeared to contact the GAD+ cell (wide arrows) and the GAD-negative cell (thin arrow). B) A GAD-negative commissural cell (G−) adjacent to a GAD+ cell (G+) that was not labeled by the commissural tracer. The bottom panel shows a cortical bouton contacting the GAD-negative commissural cell (thin arrow). Scale bar = 20 μm.
3.5 Distribution of commissural cells in the left IC
Figure 9A shows the distribution of commissural cells following an injection of FluoroRuby in the right ICc. As described above, both GAD+ commissural cells (red circles) and GAD-negative commissural cells (blue circles) are spread across the IC. Figure 9B shows the subset of these commissural cells that were contacted by cortical boutons. Several points are clear. As described above, cortical axons contacted GAD-negative cells (open blue circles) much more often than GAD+ cells (red circles); this was true in all of the IC subdivisions. Secondly, the majority of contacted commissural cells are located outside the ICc. This finding most likely reflects the much lower number of cortical boutons in the ICc versus other subdivisions. What was somewhat surprising was the overall large number of commissural cells that appeared to be contacted by the cortical axons (compare “contacted cells” in Fig. 9B vs. all labeled commissural cells in Fig. 9A). About 23% of the commissural cells were contacted. Results from a second case (GP608), which differed in having a large injection that included all IC subdivisions, provided similar results. While the number of commissural cells was greater following the larger injection, roughly 34% of the GAD-negative commissural cells and 41% of the GAD+ commissural cells were contacted by cortical axons.
Figure 9.

Plots showing the distribution of commissural cells (dots) in four transverse sections through the left IC after an injection of FluoroRuby into the right ICc (see Fig. 3B). Sections are 50 μm thick and spaced 300 μm apart. A. Plots showing all labeled commissural cells, with symbols indicating whether the cell was GAD+ (large red) or GAD-negative (small blue). B. Plots from the same sections shown in part A, but showing only those commissural cells that were contacted by cortical boutons. The cortical axons were labeled in this case by fluorescein dextran (Fig. 1B). Symbols indicate whether the cortically-contacted commissural cell was GAD-negative (open blue) or GAD+ (solid red). Abbreviations: D - dorsal; ICc - central nucleus; ICd - dorsal cortex; IClc - lateral cortex; M - medial. Scale bar = 1 mm.
In rats, commissural cells exhibit a wide range of soma sizes, presumably reflecting different functional classes (e.g., Okayama et al., 2006). We observed a similarly wide range of soma sizes among commissural cells (Fig. 10). The subsets of cells that were contacted by cortical boutons were virtually identical in soma area to their “non-contacted” counterparts. In other words, cortical boutons contacted GAD+ and GAD-negative commissural cells throughout the range of commissural soma sizes.
Figure 10.

Graphs showing the soma area (average ± SD) of commissural cells in GP 596 and GP 608. Labeled commissural cells were measured in every sixth section through the IC in each case. The cells were grouped first according to their GAD-immunoreactivity. GAD-negative (“GAD-neg”) cells are graphed in the top row and GAD+ cells are graphed in the bottom row. For each row, the cells were grouped according to evidence for cortical contacts onto the labeled cell. The left column shows soma area for cells that had no evidence of contacts by cortical boutons (“w/o cortical contacts”). The right column shows soma areas for cells with apparent contacts by cortical boutons (“with contacts”). * indicates that the largest bin includes cells with soma profile areas of 600 μm2 or greater. Total number of cells measured = 2158.
4. DISCUSSION
The present study provides evidence that AC axons contact commissural cells in all IC subdivisions of the ipsilateral IC. In the ICc, the targets include both stellate and disc-shaped commissural cells. A large majority of the cortically-contacted commissural cells are GAD-immunonegative. These results suggest that the ipsilateral corticocollicular pathway (which is excitatory) affects excitatory commissural cells and thus has primarily an excitatory effect on cells in the contralateral IC. We discuss technical limitations and then consider functional implications as well as alternative routes by which the AC could affect the contralateral IC.
4.1 Technical Considerations
Light microscopy allowed us to assess potential contacts throughout the IC (i.e., without being limited by the small size of tissue samples used in electron microscopy). We conclude that AC axons contact commissural cells in all IC subdivisions, including the ICc, which is often considered to receive relatively little AC input. Both anatomical and physiological studies indicate AC projections to all IC subdivisions in rats and guinea pigs (Syka and Popelar, 1984; Saldaña et al., 1996; Bledsoe et al., 2003; Coomes et al., 2005; Nakamoto et al., 2013). Electron microscopic studies have demonstrated that cortical boutons contact dendrites and cell bodies in guinea pig IC, including GABA-immunopositive and GABA-immunonegative cells, supporting our proposition that the close appositions seen in the present study could represent synapses (Nakamoto et al., 2013). However, the projections of the postsynaptic cells have not been identified in any of the previous studies, so future electron microscopy studies labeling both cortical boutons and commissural cells will be needed.
Several factors may have lead us to underestimate the number of synaptic contacts between AC axons and commissural cells. None of our cases had cortical injections that spanned the entire AC, so none of our cases are likely to have labeled all corticocollicular axons. In addition, our injections into the IC are unlikely to have labeled every commissural cell. Most of the labeled cells had limited visibility of distal dendrites. Such limitations of the retrograde tracers are another factor that likely lead to an underestimate of synaptic contacts.
The experiments were designed to maximize the labeling of commissural cells in order to detect cortical contacts onto those cells. Consequently, we made large injections into the IC and in all but one of our cases the injections involved all major IC subdivisions. Thus, for most of the experiments we are unable to determine which subdivision is the target of any particular labeled commissural cell. We supplemented our results with a case in which the injection was confined to the ICc. This case labeled fewer commissural cells than the cases with larger injections, but otherwise the results in this case were similar to those following larger injections. These results are valuable because much of the physiological data that prompted the current study was collected from cells in the ICc. Our results from the small injections support the possibility that the disynaptic pathway depicted in the present study could be a basis for the physiological observations in the earlier studies.
GAD immunochemistry is routinely used to label GABAergic cells in the inferior colliculus(e.g., Oliver et al., 1994; Ito et al., 2009). The GAD antibody we used has been used previously in the guinea pig (Xiong et al., 2008). It resulted in intensely stained cells in the IC as well as other regions known to contain GABAergic cells (e.g., dorsal nucleus of the lateral lemniscus, superior paraolivary nucleus; Adams and Mugnaini, 1984; Kulesza and Berrebi, 2000). The western blot and observation of staining in “expected” areas (e.g. nuclei of the lateral lemniscus) increases our confidence in the specificity of the stain. It is more difficult to rule out false negative staining, in which GABAergic commissural cells were not labeled by the GAD antibody. Two observations suggest that this was not a significant source of error in our study. First, there were substantial numbers of IC cells that were GAD-positive but not retrogradely labeled. Second, we routinely observed GAD-positive cells in close proximity to the GAD-negative commissural cells, indicating that the immunoreagents successfully penetrated the tissue and labeled cells in the areas of interest. We conclude that the GAD staining was specific and representative for GABAergic cells in the IC.
4.2 Comparison with previous studies
The IC commissure is one of the largest inputs to the IC (Brunso-Bechtold et al., 1981; Moore, 1988). Stimulation or inactivation of the commissural pathway affects the responses of the majority of cells in the ICc (Smith, 1992; Moore et al., 1998; Reetz and Ehret, 1999; Malmierca et al., 2003, 2005; Du et al., 2009). Stimulation of the commissure leads to excitation and inhibition of IC cells that can be blocked by glutamate and GABA antagonists, respectively (Smith, 1992; Moore et al., 1998). Both glutamate and GABA have been associated with commissural cells via neurotransmitter-selective tracing (Saint Marie, 1996) or immunochemical markers (González-Hernández et al., 1996; Hernandez et al., 2006). Glycine, another major inhibitory neurotransmitter in the IC, does not appear to be used by commissural cells (or any other IC cells) (Aoki et al., 1988; Pourcho et al., 1992; Merchán et al., 2005). Consequently, it is reasonable to conclude that the GAD-negative commissural cells in the present study are likely to be glutamatergic.
Our data suggest that about 9% of the commissural cells in guinea pigs are GABAergic. This compares to reports in rats, where the proportion of GABAergic cells ranges from 0%–19% for inputs to ICc (Zhang et al., 1998; Hernández et al., 2006) or 27–46% (all IC subdivisions: González-Hernández et al., 1996). The lower values appear somewhat surprising given the reports that the vast majority of IC cells show GABAergic inhibition in response to commissural stimulation. Moore et al. (1998) hypothesized that much of the inhibition that results from commissural stimulation must be explained by multisynaptic connections. In this scenario, stimulation of the commissure activates excitatory, glutamatergic commissural axons that terminate on GABAergic cells (Fig. 11, cell B) that then inhibit their neighbors (Fig. 11, cell A), giving rise to disynaptic, GABAergic inhibition in the neighboring cell. In this view, commissural stimulation could directly excite cell A via glutamatergic synapses, and indirectly inhibit cell A via commissural, glutamatergic activation of an IC GABAergic cell that then inhibits the neighbor (note that cell A could also represent a GABAergic IC cell; the physiological evidence suggests that glutamatergic and GABAergic cells are affected similarly by commissural stimulation).
Figure 11.

Schematic diagram showing components and targets of the commissural pathway. Glutamatergic cells (green) and GABAergic cells (red) are sources of the commissural pathway. Cells in the right inferior colliculus (IC) represent targets of the commissural projections. Cell A and Cell B each receive direct inputs from commissural glutamatergic axons (green arrows). Cell B is a GABAergic cell with a local axon that inhibits Cell A. In this scenario, stimulation of the IC commissure would lead to direct excitation of both Cell A and Cell B, and disynaptic inhibition of Cell A. The targets of the GABAergic commissural axons are unknown, but would presumably also contribute to commissurally driven inhibition (see text for discussion). The large green arrow originating in auditory cortex (AC) represents the large glutamatergic projection from the AC to the ipsilateral IC. The present data suggest that these excitatory cortical axons contact both glutamatergic and GABAergic commissural cells, and would lead to both excitation and inhibition in the right IC.
How would cortical projections to commissural cells affect neurons in the contralateral IC? Corticocollicular cells are glutamatergic and excite their targets in the IC (Mitani et al., 1983; Feliciano and Potashner, 1995). If cortical projections lead to broad activation of commissural cells, as suggested by the present data, it follows that cortical activation would lead to excitatory and inhibitory effects on most cells in the contralateral ICc. This is consistent with results of electrical stimulation of the AC (guinea pigs: Torterolo et al., 1998; big brown bats: Ma and Suga, 2001). Our finding that most of the cortically-targeted commissural cells are excitatory suggests a disynaptic cortical-commissural route for excitation of contralateral IC cells. If glutamatergic commissural cells activate local GABAergic circuits in the contralateral IC, as suggested by Moore et al. (1998)(Fig. 11), then cortical projections to glutamatergic commissural cells could also lead to GABAergic inhibition of contralateral IC cells. Our data suggest an additional possibility, whereby cortical axons also activate GABAergic commissural cells. The relative contributions of these two routes for cortically-driven inhibition remain to be determined. It would be interesting to determine whether glutamatergic commissural axons contact GABAergic cells, as suggested by the Moore hypothesis. The absence of such contacts would argue for a greater role for GABAergic commissural cells.
Some cortical effects on the contralateral ICc are frequency-specific (Ma and Suga, 2001). Commissural cells in the ICc may be particularly well suited for this role because the AC projection to the ICc is tonotopically organized (Saldaña et al. 1996; Lim and Anderson, 2007) and the commissural projection from one ICc to the other is also tonotopically organized (Malmierca et al., 1995a). The present study suggests that commissural cells in the ICc are contacted directly by AC axons and could exert the frequency-specific, cortically-driven excitation on the contralateral ICc described in the physiological studies cited above.
Commissural cells in the cortical areas of the IC (ICd, ICrc and IClc) may play a more substantial role than commissural cells in the ICc in relaying cortical effects to the contralateral ICc. These subdivisions outside the ICc had a larger percentage of the observed cortical contacts on commissural cells, likely reflecting the higher density of cortical projections to these IC subdivisions. It would be interesting to determine whether individual IC cells have branching axons that innervate both the homolateral ICc and the contralateral IC. It is common for IC cells to have extrinsic projections as well as local collaterals (Reetz and Ehret, 1999; Oliver, 2005). Branching projections from commissural cells may allow a small population of IC cells to transmit cortical effects simultaneously to IC cells on both sides.
4.3 Other possible routes for cortical effects on the ICc
Given the large size of the AC projection to the ipsilateral IC, the large number of commissural cells, and the large percentage of commissural cells contacted by the cortical projections (23%–34%), it is likely that the commissural pathway provides a major – perhaps the primary – route for excitatory cortical effects on the contralateral ICc. However, other pathways may also be involved. The left AC projects directly to the right ICd (Willard and Martin, 1984; Coomes et al., 2005); however cortical cells projecting to the ipsilateral IC outnumber those projecting to the contralateral IC by a factor of about 20 (Willard and Martin, 1984; Coomes et al., 2005). The AC also projects directly to the superior olivary complex and the cochlear nuclei (Feliciano et al., 1995; Weedman and Ryugo, 1996a, b; Jacomme et al., 2003; Coomes and Schofield, 2004; Coomes et al., 2005). In each of these areas, cortical axons contact cells that project to the IC (Coomes et al., 2005; Coomes Peterson and Schofield, 2007). However, the number of cortical cells projecting to the subcollicular targets is a small fraction (~10%) of those projecting directly to the IC, so one might expect cortical effects on the IC to be more substantial via the direct projection to the IC than via the subcollicular route (Doucet et al., 2003). Finally, the AC projects through the corpus callosum to the contralateral AC. Callosal neurons are glutamatergic, leading to excitatory or modulatory effects on their targets (Hackett and Phillips, 2011). It is not known if callosal axons contact corticocollicular cells directly or whether callosal projections alter activity of corticocollicular cells. In summary, there are multiple pathways by which the AC could affect the contralateral IC. Numerically, the cortical projections to commissural cells in the ipsilateral IC is likely to be the largest such pathway and thus is likely to play a prominent role in cortical effects on the contralateral IC.
4.4 Functional implications
Several lines of evidence suggest that commissural cells serve multiple functions. Morphological distinctions suggest multiple functional types of commissural cells (González-Hernández et al., 1996; Saldaña and Merchan, 2005). Multipolar cells are predominant in the ICd, ICrc and IClc, and may be distinguishable by soma size (Malmierca et all, 1995b; Saldaña and Merchan, 2005; Okoyama et al., 2006). The present data show that commissural cells exhibit a wide range of soma sizes in guinea pigs, and that cortical axons contact representatives throughout this size range (Fig. 10). In the ICc, somatodendritic morphology distinguishes disc-shaped cells from stellate cells (reviewed by Oliver, 2005). The present experiments suggest that both of these cell types participate in commissural projections in guinea pigs, and that cortical axons contact both morphologic types (Fig. 5). Compared to disc-shaped cells, stellate cells have dendrites that spread farther across the tonotopic axis. Stellate cells are believed to have broader frequency tuning than disc-shaped cells, so commissural stellate cells may be more important for effects “displaced” from the characteristic frequency of the target cells whereas disc-shaped cells may be more directed toward effects at characteristic frequency.
Broader distinctions in function may be associated with the different IC subdivisions. The subdivisions can be loosely associated with parallel ascending pathways to the auditory thalamus (Calford and Aitkin, 1983; LeDoux et al., 1985; Rouiller and de Ribaupierre, 1985). A tonotopic (or lemniscal) pathway originates from the ICc; a non-tonotopic “diffuse” system originates from the ICd, and a multimodal, or “polysensory” system originates from the IClc, ICrc and ICc. The polysensory system is particularly associated with somatosensory inputs. We are unaware of any data directly relating AC corticocollicular projections to somatosensory (or other non-auditory) input to the IC. The projections from primary auditory cortex to the IClc are apparently organized topographically (Saldaña et al., 1996), but the significance in light of polysensory processing is unclear. The functions of the ICd and the “diffuse” system are also difficult to discern. We observed cortical contacts on commissural cells in all IC subdivisions after injections of retrograde tracer confined to the right ICc. This suggests that all IC subdivisions, potentially implicating the various functions associated with the parallel pathways, can participate in cortically-driven effects on the ICc and, presumably, the “lemniscal” pathway that extends from the ICc to the ventral division of the medial geniculate body.
Highlights.
A minority of commissural cells in the inferior colliculus (IC) are GABAergic.
Auditory cortical (AC) axons contact many commissural cells in the ipsilateral IC.
AC axons contact GABAergic and non-GABAergic commissural cells.
The IC commissure provides a major route for AC effects on the contralateral IC.
Acknowledgments
We would like to thank Megan Storey-Workley for expert technical assistance and Dr. W. Chilian for use of his fluorescence macroscope. Dr. J. Mellott provided valuable comments on an early draft of the manuscript. Supported by NIH R01 DC04391 and 1 F32 DC010958.
List of Abbreviations
- AC
auditory cortex
- FB
Fast Blue
- FD
fluorescein dextran
- FG
FluoroGold
- FR
FluoroRuby
- G+
GAD-immunopositive
- GAD
glutamic acid decarboxylase
- GAD-neg, G−
GAD-immunonegative
- GB
green RetroBeads
- I–VI
cortical layers
- IC
inferior colliculus
- ICc
IC, central nucleus
- ICd
IC, dorsal cortex
- IClc
IC, lateral cortex
- ICrc
IC, rostral cortex
- ps
pseudosylvian sulcus
- rs
rhinal sulcus
- wm
white matter
Footnotes
The lateral cortex and rostral cortex are frequently referred to together as the external cortex.
Publisher's Disclaimer: This is a PDF file of an unedited manuscript that has been accepted for publication. As a service to our customers we are providing this early version of the manuscript. The manuscript will undergo copyediting, typesetting, and review of the resulting proof before it is published in its final citable form. Please note that during the production process errors may be discovered which could affect the content, and all legal disclaimers that apply to the journal pertain.
References
- Adams JC, Mugnaini E. Dorsal nucleus of the lateral lemniscus: A nucleus of GABAergic projection neurons. Brain Res Bull. 1984;13:585–590. doi: 10.1016/0361-9230(84)90041-8. [DOI] [PubMed] [Google Scholar]
- Amato G, La Grutta V, Enia F. The control exerted by the auditory cortex on the activity of the medial geniculate body and inferior colliculus. Arch Sci Biol (Bologna) 1969;53:291–313. [PubMed] [Google Scholar]
- Anderson LA, Malmierca MS. The effect of auditory cortex deactivation on stimulus-specific adaptation in the inferior colliculus of the rat. Eur J Neurosci. 2013;37:52–62. doi: 10.1111/ejn.12018. [DOI] [PubMed] [Google Scholar]
- Aoki E, Semba R, Keino H, Kato K, Kashiwamata S. Glycine-like immunoreactivity in the rat auditory pathway. Brain Res. 1988;442:63–71. doi: 10.1016/0006-8993(88)91432-1. [DOI] [PubMed] [Google Scholar]
- Bajo VM, Moore DR. Descending projections from the auditory cortex to the inferior colliculus in the gerbil, Meriones unguiculatus. J Comp Neurol. 2005;486:101–116. doi: 10.1002/cne.20542. [DOI] [PubMed] [Google Scholar]
- Bajo VM, Nodal FR, Bizley JK, Moore DR, King AJ. The ferret auditory cortex: descending projections to the inferior colliculus. Cereb Cortex. 2007;17:475–491. doi: 10.1093/cercor/bhj164. [DOI] [PMC free article] [PubMed] [Google Scholar]
- Bledsoe SC, Shore SE, Guitton MJ. Spatial representation of corticofugal input in the inferior colliculus: a multicontact silicon probe approach. Exp Brain Res. 2003;153:530–542. doi: 10.1007/s00221-003-1671-6. [DOI] [PubMed] [Google Scholar]
- Brunso-Bechtold JK, Thompson GC, Masterton RB. HRP study of the organization of auditory afferents ascending to central nucleus of inferior colliculus in cat. J Comp Neurol. 1981;197:705–722. doi: 10.1002/cne.901970410. [DOI] [PubMed] [Google Scholar]
- Calford MB, Aitkin LM. Ascending projections to the medial geniculate body of the cat: evidence for multiple, parallel auditory pathways through thalamus. J Neurosci. 1983;3:2365–2380. doi: 10.1523/JNEUROSCI.03-11-02365.1983. [DOI] [PMC free article] [PubMed] [Google Scholar]
- Coomes DL, Schofield BR. Projections from the auditory cortex to the superior olivary complex in guinea pigs. Eur J Neurosci. 2004;19:2188–2200. doi: 10.1111/j.0953-816X.2004.03317.x. [DOI] [PubMed] [Google Scholar]
- Coomes DL, Schofield RM, Schofield BR. Unilateral and bilateral projections from cortical cells to the inferior colliculus in guinea pigs. Brain Res. 2005;1042:62–72. doi: 10.1016/j.brainres.2005.02.015. [DOI] [PubMed] [Google Scholar]
- Coomes Peterson D, Schofield BR. Projections from auditory cortex contact ascending pathways that originate in the superior olive and inferior colliculus. Hear Res. 2007;232:67–77. doi: 10.1016/j.heares.2007.06.009. [DOI] [PMC free article] [PubMed] [Google Scholar]
- Coote EJ, Rees A. The distribution of nitric oxide synthase in the inferior colliculus of guinea pig. Neuroscience. 2008;154:218–225. doi: 10.1016/j.neuroscience.2008.02.030. [DOI] [PubMed] [Google Scholar]
- Dawson TM, Bredt DS, Fotuhi M, Hwang PM, Snyder SH. Nitric oxide synthase and neuronal NADPH diaphorase are identical in brain and peripheral tissues. Proc Natl Acad Sci U S A. 1991;88:7797–7801. doi: 10.1073/pnas.88.17.7797. [DOI] [PMC free article] [PubMed] [Google Scholar]
- Doucet JR, Molavi DL, Ryugo DK. The source of corticocollicular and corticobulbar projections in area Te1 of the rat. Exp Brain Res. 2003;153:461–466. doi: 10.1007/s00221-003-1604-4. [DOI] [PubMed] [Google Scholar]
- Du Y, Ma T, Wang Q, Wu X, Li L. Two crossed axonal projections contribute to binaural unmasking of frequency-following responses in rat inferior colliculus. Eur J Neurosci. 2009;30:1779–1789. doi: 10.1111/j.1460-9568.2009.06947.x. [DOI] [PubMed] [Google Scholar]
- Feliciano M, Potashner SJ. Evidence for a glutamatergic pathway from the guinea pig auditory cortex to the inferior colliculus. J Neurochem. 1995;65:1348–1357. doi: 10.1046/j.1471-4159.1995.65031348.x. [DOI] [PubMed] [Google Scholar]
- Feliciano M, Saldaña E, Mugnaini E. Direct projections from the rat primary auditory neocortex to nucleus sagulum, paralemniscal regions, superior olivary complex and cochlear nuclei. Auditory Neurosci. 1995;1:287–308. [Google Scholar]
- González-Hernández T, Mantolán-Sarmiento B, González-González B, Pérez-González H. Sources of GABAergic input to the inferior colliculus of the rat. J Comp Neurol. 1996;372:309–326. doi: 10.1002/(SICI)1096-9861(19960819)372:2<309::AID-CNE11>3.0.CO;2-E. [DOI] [PubMed] [Google Scholar]
- Hackett TA, Phillips DP. The commissural auditory system. In: Winer JA, Schreiner CE, editors. The auditory cortex. Springer; New York: 2011. pp. 117–131. [Google Scholar]
- Hernández O, Rees A, Malmierca MS. A GABAergic component in the commissure of the inferior colliculus in rat. Neuroreport. 2006;17:1611–1614. doi: 10.1097/01.wnr.0000236857.70715.be. [DOI] [PubMed] [Google Scholar]
- Ito T, Bishop DC, Oliver DL. Two classes of GABAergic neurons in the inferior colliculus. J Neurosci. 2009;29:13860–13869. doi: 10.1523/JNEUROSCI.3454-09.2009. [DOI] [PMC free article] [PubMed] [Google Scholar]
- Jacomme AV, Nodal FR, Bajo VM, Manunta Y, Edeline JM, Babalian A, Rouiller EM. The projection from auditory cortex to cochlear nucleus in guinea pigs: An in vivo anatomical and in vitro electrophysiological study. Exp Brain Res. 2003;153:467–476. doi: 10.1007/s00221-003-1606-2. [DOI] [PubMed] [Google Scholar]
- Jen PH, Chen QC, Sun XD. Corticofugal regulation of auditory sensitivity in the bat inferior colliculus. J Comp Physiol A. 1998;183:683–697. doi: 10.1007/s003590050291. [DOI] [PubMed] [Google Scholar]
- Kulesza RJ, Jr, Berrebi AS. Superior paraolivary nucleus of the rat is a GABAergic nucleus. J Assoc Res Otolaryngol. 2000;1:255–269. doi: 10.1007/s101620010054. [DOI] [PMC free article] [PubMed] [Google Scholar]
- LeDoux JE, Ruggiero DA, Reis DJ. Projections to the subcortical forebrain from anatomically defined regions of the medial geniculate body in the rat. J Comp Neurol. 1985;242:182–213. doi: 10.1002/cne.902420204. [DOI] [PubMed] [Google Scholar]
- Lim HH, Anderson DJ. Antidromic activation reveals tonotopically organized projections from primary auditory cortex to the central nucleus of the inferior colliculus in guinea pig. J Neurophysiol. 2007;97:1413–1427. doi: 10.1152/jn.00384.2006. [DOI] [PubMed] [Google Scholar]
- Ma X, Suga N. Plasticity of bat’s central auditory system evoked by focal electric stimulation of auditory and/or somatosensory cortices. J Neurophysiol. 2001;85:1078–1087. doi: 10.1152/jn.2001.85.3.1078. [DOI] [PubMed] [Google Scholar]
- Malmierca MS, Hernández O, Antunes FM, Rees A. Divergent and point-to-point connections in the commissural pathway between the inferior colliculi. J Comp Neurol. 2009;514:226–239. doi: 10.1002/cne.21997. [DOI] [PMC free article] [PubMed] [Google Scholar]
- Malmierca MS, Hernández O, Falconi A, López-Poveda EA, Merchán M, Rees A. The commissure of the inferior colliculus shapes frequency response areas in rat: an in vivo study using reversible blockade with microinjection of kynurenic acid. Exp Brain Res. 2003;153:522–529. doi: 10.1007/s00221-003-1615-1. [DOI] [PubMed] [Google Scholar]
- Malmierca MS, Hernández O, Rees A. Intercollicular commissural projections modulate neuronal responses in the inferior colliculus. Eur J Neurosci. 2005;21:2701–2710. doi: 10.1111/j.1460-9568.2005.04103.x. [DOI] [PubMed] [Google Scholar]
- Malmierca MS, Rees A, Le Beau FE, Bjaalie JG. Laminar organization of frequency-defined local axons within and between the inferior colliculi of the guinea pig. J Comp Neurol. 1995a;357:124–144. doi: 10.1002/cne.903570112. [DOI] [PubMed] [Google Scholar]
- Malmierca MS, Seip KL, Osen KK. Morphological classification and identification of neurons in the inferior colliculus: a multivariate analysis. Anat Embryol (Berl) 1995b;191:343–350. doi: 10.1007/BF00534687. [DOI] [PubMed] [Google Scholar]
- Massopust LC, Jr, Ordy JM. Auditory organization of the inferior colliculi in the cat. Exp Neurol. 1962;6:465–477. doi: 10.1016/0014-4886(62)90072-9. [DOI] [PubMed] [Google Scholar]
- Merchán M, Aguilar LA, López-Poveda EA, Malmierca MS. The inferior colliculus of the rat: quantitative immunocytochemical study of GABA and glycine. Neuroscience. 2005;136:907–925. doi: 10.1016/j.neuroscience.2004.12.030. [DOI] [PubMed] [Google Scholar]
- Mitani A, Shimokouchi M, Nomura S. Effects of stimulation of the primary auditory cortex upon colliculogeniculate neurons in the inferior colliculus of the cat. Neurosci Lett. 1983;42:185–189. doi: 10.1016/0304-3940(83)90404-4. [DOI] [PubMed] [Google Scholar]
- Moore DR. Auditory brainstem of the ferret: sources of projections to the inferior colliculus. J Comp Neurol. 1988;269:342–354. doi: 10.1002/cne.902690303. [DOI] [PubMed] [Google Scholar]
- Moore DR, Kotak VC, Sanes DH. Commissural and lemniscal synaptic input to the gerbil inferior colliculus. J Neurophysiol. 1998;80:2229–2236. doi: 10.1152/jn.1998.80.5.2229. [DOI] [PubMed] [Google Scholar]
- Nakamoto KT, Jones SJ, Palmer AR. Descending projections from auditory cortex modulate sensitivity in the midbrain to cues for spatial position. J Neurophysiol. 2008;99:2347–2356. doi: 10.1152/jn.01326.2007. [DOI] [PubMed] [Google Scholar]
- Nakamoto KT, Shackleton TM, Palmer AR. Responses in the inferior colliculus of the guinea pig to concurrent harmonic series and the effect of inactivation of descending controls. J Neurophysiol. 2010;103:2050–2061. doi: 10.1152/jn.00451.2009. [DOI] [PMC free article] [PubMed] [Google Scholar]
- Nakamoto KT, Mellott JG, Killius J, Storey-Workley ME, Sowick CS, Schofield BR. Ultrastructural examination of the corticocollicular pathway in the guinea pig: a study using electron microscopy, neural tracers, and GABA immunocytochemistry. Front Neuroanat. 2013;7:13. doi: 10.3389/fnana.2013.00013. [DOI] [PMC free article] [PubMed] [Google Scholar]
- Okoyama S, Ohbayashi M, Ito M, Harada S. Neuronal organization of the rat inferior colliculus participating in four major auditory pathways. Hear Res. 2006;218:72–80. doi: 10.1016/j.heares.2006.04.004. [DOI] [PubMed] [Google Scholar]
- Oliver DL. Neuronal organization in the inferior colliculus. In: Winer JA, Schreiner A, editors. The inferior colliculus. Springer; New York: 2005. pp. 69–114. [Google Scholar]
- Oliver DL, Winer JA, Beckius GE, Saint Marie RL. Morphology of GABAergic neurons in the inferior colliculus of the cat. J Comp Neurol. 1994;340:27–42. doi: 10.1002/cne.903400104. [DOI] [PubMed] [Google Scholar]
- Popelar J, Nwabueze-Ogbo FC, Syka J. Changes in neuronal activity of the inferior colliculus in rat after temporal inactivation of the auditory cortex. Physiol Res. 2003;52:615–628. [PubMed] [Google Scholar]
- Pourcho RG, Goebel DJ, Jojich L, Hazlett JC. Immunocytochemical evidence for the involvement of glycine in sensory centers of the rat brain. Neuroscience. 1992;46:643–656. doi: 10.1016/0306-4522(92)90151-q. [DOI] [PubMed] [Google Scholar]
- Reetz G, Ehret G. Inputs from three brainstem sources to identified neurons of the mouse inferior colliculus slice. Brain Res. 1999;816:527–543. doi: 10.1016/s0006-8993(98)01230-x. [DOI] [PubMed] [Google Scholar]
- Rouiller EM, de Ribaupierre F. Origin of afferents to physiologically defined regions of the medial geniculate body of the cat: ventral and dorsal divisions. Hear Res. 1985;19:97–114. doi: 10.1016/0378-5955(85)90114-5. [DOI] [PubMed] [Google Scholar]
- Saint Marie RL. Glutamatergic connections of the auditory midbrain: selective uptake and axonal transport of D-[3H]aspartate. J Comp Neurol. 1996;373:255–270. doi: 10.1002/(SICI)1096-9861(19960916)373:2<255::AID-CNE8>3.0.CO;2-2. [DOI] [PubMed] [Google Scholar]
- Saldaña E, Feliciano M, Mugnaini E. Distribution of descending projections from primary auditory neocortex to inferior colliculus mimics the topography of intracollicular projections. J Comp Neurol. 1996;371:15–40. doi: 10.1002/(SICI)1096-9861(19960715)371:1<15::AID-CNE2>3.0.CO;2-O. [DOI] [PubMed] [Google Scholar]
- Saldaña E, Merchan MA. Intrinsic and commissural connections of the inferior colliculus. In: Winer JA, Schreiner A, editors. The inferior colliculus. Springer; New York: 2005. pp. 155–181. [DOI] [PubMed] [Google Scholar]
- Smith PH. Anatomy and physiology of multipolar cells in the rat inferior collicular cortex using the in vitro brain slice technique. J Neurosci. 1992;12:3700–3715. doi: 10.1523/JNEUROSCI.12-09-03700.1992. [DOI] [PMC free article] [PubMed] [Google Scholar]
- Suga N. Role of corticofugal feedback in hearing. J Comp Physiol A Neuroethol Sens Neural Behav Physiol. 2008;194:169–183. doi: 10.1007/s00359-007-0274-2. [DOI] [PubMed] [Google Scholar]
- Sun XD, Jen PH, Sun DX, Zhang SF. Corticofugal influences on the responses of bat inferior collicular neurons to sound stimulation. Brain Res. 1989;495:1–8. doi: 10.1016/0006-8993(89)91212-2. [DOI] [PubMed] [Google Scholar]
- Syka J, Popelar J. Inferior colliculus in the rat: neuronal responses to stimulation of the auditory cortex. Neurosci Lett. 1984;51:235–240. doi: 10.1016/0304-3940(84)90557-3. [DOI] [PubMed] [Google Scholar]
- Torterolo P, Zurita P, Pedemonte M, Velluti RA. Auditory cortical efferent actions upon inferior colliculus unitary activity in the guinea pig. Neurosci Lett. 1998;249:172–176. doi: 10.1016/s0304-3940(98)00367-x. [DOI] [PubMed] [Google Scholar]
- Wallace MN, Rutkowski RG, Palmer AR. Identification and localisation of auditory areas in guinea pig cortex. Exp Brain Res. 2000;132:445–456. doi: 10.1007/s002210000362. [DOI] [PubMed] [Google Scholar]
- Wallace MN, Rutkowski RG, Palmer AR. Interconnections of auditory areas in the guinea pig neocortex. Exp Brain Res. 2002;143:106–119. doi: 10.1007/s00221-001-0973-9. [DOI] [PubMed] [Google Scholar]
- Weedman DL, Ryugo DK. Pyramidal cells in primary auditory cortex project to cochlear nucleus in rat. Brain Res. 1996a;706:97–102. doi: 10.1016/0006-8993(95)01201-x. [DOI] [PubMed] [Google Scholar]
- Weedman DL, Ryugo DK. Projections from auditory cortex to the cochlear nucleus in rats: Synapses on granule cell dendrites. J Comp Neurol. 1996b;371:311–324. doi: 10.1002/(SICI)1096-9861(19960722)371:2<311::AID-CNE10>3.0.CO;2-V. [DOI] [PubMed] [Google Scholar]
- Willard FH, Martin GF. Collateral innervation of the inferior colliculus in the North American opossum: a study using fluorescent markers in a double-labeling paradigm. Brain Res. 1984;303:171–182. doi: 10.1016/0006-8993(84)90225-7. [DOI] [PubMed] [Google Scholar]
- Winer JA. Three systems of descending projections to the inferior colliculus. In: Winer JA, Schreiner A, editors. The inferior colliculus. Springer; New York: 2005. pp. 231–247. [Google Scholar]
- Winer JA, Larue DT, Diehl JJ, Hefti BJ. Auditory cortical projections to the cat inferior colliculus. J Comp Neurol. 1998;400:147–174. [PubMed] [Google Scholar]
- Xiong K, Luo DW, Patrylo PR, Luo XG, Struble RG, Clough RW, Yan XX. Doublecortin-expressing cells are present in layer II across the adult guinea pig cerebral cortex: partial colocalization with mature interneuron markers. Exp Neurol. 2008;211:271–282. doi: 10.1016/j.expneurol.2008.02.003. [DOI] [PMC free article] [PubMed] [Google Scholar]
- Zhang DX, Li L, Kelly JB, Wu SH. GABAergic projections from the lateral lemniscus to the inferior colliculus of the rat. Hear Res. 1998;117:1–12. doi: 10.1016/s0378-5955(97)00202-5. [DOI] [PubMed] [Google Scholar]