Abstract
This paper presents the use of atomic force microscopy (AFM) to visualize and quantify the dynamics of epithelial cell junction interactions under physiological and pathophysiological conditions at the nanoscale. Desmosomal junctions are specialized structures critical to cellular adhesion within epithelial tissues. Disassembly of these junctions is seen consequent to the development of autoantibodies directed at specific desmosomal proteins in blistering skin diseases such as Pemphigus. However, these structures are complex and mechanically inhomogeneous, making it difficult to study and the mechanisms of autoantibody mediated keratinocyte disassembly remain largely unknown. Here, we have used AFM system to image and measure the mechanical property of living skin epithelial cells in culture. We demonstrate that the force measurement data can possibly distinguish the cell with different antibody treatment. Our demonstration of the use of AFM for in situ imaging and elasticity measurement positioned us to begin to investigate disease mechanisms and monitor therapeutic strategies in blistering skin diseases in much greater detail, to meet the demands for understanding disease pathology at the local, or tissue level.
Keywords: AFM, cell elasticity, cell junctions, desmosome, human keratinocyte
I. Introduction
In recent years, AFM has been widely used for biological and medical applications [1]–[3]. It has been proved to be an effective tool as quantifying the elasticity of various types of cells, such as metastatic cancer cells [4][5] and human breast cells [6]. By using AFM, metastatic cancer cells have been shown to exhibit much lower elastic stiffness than their benign counterparts, likely reflective of cytoskeleton changes associated with transformation [4][5]. Besides, AFM indentation study has also been applied to testing tissues, it showed the aging cartilage can be detected from the force measurement [7]. These evidences hold the potential to build a link and provide an effective and efficient biomarker to relate the structural aspects as well as the mechanical properties of the cell with its physiological conditions or underlying diseases.
The epithelial cells have unique cell-cell interaction junctions - desmosome. The junctions are crucial elements to maintain the stability and to provide the mechanical strength for the tissue [8]. Some disease like pemphigus vulgaris (PV) are caused by the disruption of desmosomal molecules desmoglein (Dsg)3 or Dsg1 (acantholysis) [9][10]. Thus to understand the structure difference between the junctions of healthy keratinocytes and the ones affected by PV is crucial for the diagnosis and treatment for the disease.
Due to the complex structures and nanoscale dimensions of desmosomal junctions, investigation of their structure-function in physiological conditions is extremely difficult and challenging. Imaging of the junction protein structures is still a technical challenge. Details of their ultrastructure to date have been primarily studied in fixed cells at the electron microscope (EM) level [11] but it cannot monitor the dynamic changes in culture medium and the property of the structure is easily altered during the sample preparation process. Although the optical microscope can track the cell-cell adhesion molecules and proteins by labeling them with fluorescence markers, lack of high resolution makes it difficult to obtain detailed view of the junction structure. On the contrary, AFM appears to be a unique tool to address these issues. AFM imaging can always be performed in the culturing medium to ensure that cells grow in their normal physiological conditions both for healthy and antibody-treated samples. Secondly, AFM can achieve high resolution imaging (nanometers in scale) which is perfectly suitable for the imaging of the cell junction. In addition, monitoring the mechanical property change is another technical issue. It is known that the intercellular junctions along with the focal adhesion sites constitute the external force balance component for the cell under which prestress exists. The absence of the desmosome will lead to the change of the prestress that defines the cell stiffness. As a result, one of the underlying conditions for the cells under the above physiological conditions is the change of the mechanical properties. AFM is a natural nanoindentation instrument which can perform experiments with less than 100 nm indentation. One of the unique features is that the locations for each indentation can be visualized and accurately controlled beforehand by AFM imaging and manipulation. When the AFM is equipped with nanomanipulation system, the indenter can be manipulated by joystick control to desired locations with ease. This will ensure that all the indentation occurred at the center of the cell to avoid the substrate effect of force measurements taken around the peripheral of the cell [12].
To date, however, experimental works on tracking this living cell surface dynamics in real-time and quantitative measurements relating to the desmosomal junctions have not been reported. AFM has been used for monitoring the human keratinocytes cell morphology changes [13][14], but these studies were not performed for investigating the desmosomal junctions. In addition, it has been reported recently that the molecular binding activities of Dsg have been investigated by AFM but these studies were performed in a cell-free system, not the intercellular adhesion [15].
In this paper, we present the technique to visualize cell adhesion structures in the immortalized human keratinocyte cell line HaCaT and study the effect of specific antibody binding in situ via AFM. We develop a set of experimental conditions and a new analytical framework for analyzing AFM force curves to produce robust and internally quantitative nanomechanical maps. HaCaT cells serve as a suitable model system to develop and demonstrate this new experimental approach to mapping the elastic properties of living cells to provide a better understanding on the mechanism that causes disruption of the intercellular adhesion. By treating the cell with different types of antibody and measuring the deflection-displacement curve at the same point in real-time, the effect of specific antibody binding can be monitored in situ. We report that there are direct mechanical changes at the cell membrane, in particular, increased force subsequent to autoantibody treatment of keratinocytes. Our data provide a direct examination of the functional consequences associated with distinct disease associated autoantibodies at the high resolution.
II. Experimental Methods
A. AFM imaging
We have used a Bioscope AFM (Veeco Instruments, Woodbury, NY) for imaging living HaCaT cells, which equipped with a scanner having a maximum XY scan range of 90 µm × 90 µm and a Z range of 5 µm. Peripheral devices include an optical microscope and a charge-coupled device (CCD) camera are also connected to the AFM. Silicon nitride cantilevers with a spring constant of 0.38 N/m (Veeco Instruments) was used for imaging the sample in culture medium. All scans were completed by taking 256 × 256 point scans and recording topographic data. Both the trace and retrace images were measured and compared.
B. Cell and antibody preparation for AFM measurement
We have established both primary keratinocyte cultures as well as keratinocyte cell lines in our laboratory. Since in vitro cultures of primary human keratinocytes must be carried out under stringent culture requirements and are hindered by their short lifespan in vitro (only 10–15 population doublings before undergoing terminal differentiation), the HaCaT cell line, a spontaneously transformed human adult skin keratinocyte line that maintains full epidermal differentiation capacity and a near normal phenotype was used in the experiment [16]. HaCaT cells have been used extensively to study desmosomal cell junctions [17][18]. This keratinocyte cell line recapitulates normal human differentiation behavior in vitro, particularly in terms of desmosomal kinetics [19].
Prior to experimental use, HaCaT cells were grown to confluence in DMEM medium (Gibco-Invitrogen, Carlsbad, CA) supplemented with 10% fetal calf serum (Gemini Bio-products, West Sacramento, Ca) and 1% penicillin:streptomycin (10,000 U/ml:10,000 µg/ml; Gibco) in humidified conditions (at 37°C, 5% CO2). In the studies presented here, we used the pathogenic anti-Dsg3 antibody. It was produced in mouse hybridoma cells lines [20] (obtained from Drs. J.K. Wahl and M.J. Wheelock, Department of Biology, University of Toledo, Toledo, OH, U.S.A.) and recognizes the full-length form of the extracellular domain of desmoglein 3. The dilution ratio of the antibody to phosphate buffered saline (PBS) or cell culture medium is 1:50 for each experiment. For the control experiments presented here, we used purified goat anti-mouse Ig antibody (BD Pharmingen, San Jose, CA) at 1:50 dilution as an irrelevant control antibody.
Cells were plated onto glass coverslips and three different concentrations 1×10³, 1×10⁴, or 1×10⁵ per well were used. Poly-L-ornithine (Sigma-Aldrich, St. Louis, MO) was coated on the coverslips to enhance primary cell adhesion to the glass coverslips. After the cells had grown to confluence, the glass coverslips were washed with PBS and transferred to the AFM instrument directly. For the studies of antibody treatment, the samples were visualized at the indicated time intervals after addition of the antibody. During the experiment, a constant amount of culture medium was applied to the cell.
C. Immunofluorescence imaging
The HaCaT cells were incubated on the culturing coverslip as the method presented above. They were then fixed in 99.93% dry methanol for 5 minutes. Primary antibody solution, the anti-desmoplakin (one of the main protein in the desmosomal protein family) antibody (antibody courtesy of Dr. Lisa Godsel from Northwestern University) at 1:200 dilution was then spread over the coverslip. Subsequently, the coverslip was incubated inside the 37°C incubator for 30 minutes and washed with PBS. Secondary antibody donkey anti-rabbit IgG-Alexa Fluor 488 conjugated (Gibco-Invitrogen) at 1:400 dilution was then added onto the surface of the coverslip. The coverslip was incubated again for 30 minutes. After washing in water, mounting medium (Polyvinyl alcohol mounting medium with Dabco®, Sigma-Aldrich) was applied. The immunofluorescence imaging was performed under Nikon Intensilight C-HGFI light source with G-2A filter.
D. Quantitative analysis of cell surface indentation
AFM has also been used to quantitatively assess additional nanomechanical properties of biological materials ranging from living cells and membranes to bone and cartilage [21]. In the experiment, we obtained force measurements in cultured keratinocytes by driving the AFM cantilever into the cellular sample at a particular point and then retracting it over a predefined distance (shown on the z axis). The movement of the piezoelectric transducer (PZT), used to control and drive the AFM cantilever vertically (across the z axis), and the deflection signal from the cantilever is recorded as a deflection-displacement curve. A typical deflection-displacement curve for a hard and soft surface is shown respectively in Fig. 1. In the experiment, glass is chosen as the hard material and the reference for the cell sample (soft material). The force curve plots the relation between the cantilever displacement z and its vertical deflection d. The hard surface is regarded as indefinitely stiff compared with the cantilever and will not be indented [22] and therefore the deflection-displacement curve has a slope of 1. The deflection sensitivity which correlates the photodiode voltage with the deflection of the cantilever can then be calibrated by the deflection curve of the hard surface. For the experiments presented here, the deflection sensitivity is set as 70nm/V. On the other hand, the soft surface where indentation becomes dominant will have a slope less than 1 as indicated in Fig. 1. The indentation depth of the cell δd can be calculated by:
| (1) |
Fig. 1.
Typical deflection-displacement curves obtained for glass and cell surface. Glass is chosen as the hard material compared with the cell (soft material) and the slope of the curve for the glass is 1. δ is the indentation depth of the cell.
Once the tip touches the sample surface, a contact point between the tip and the sample is established and can be found from the deflection-displacement curve. The displacement and deflection of the cantilever before the contact point are considered and denoted as z0 and d0, respectively. Since the cell indentation happens after the tip contacted the surface, the actual indentation δ of the cell is then obtained by measuring the difference between the actual displacement (z − z0) and deflection (d − d0) after the contact point:
| (2) |
The indentation force F can be easily computed by applying the Hooke’s law to the cantilever:
| (3) |
where k is the spring constant of the cantilever.
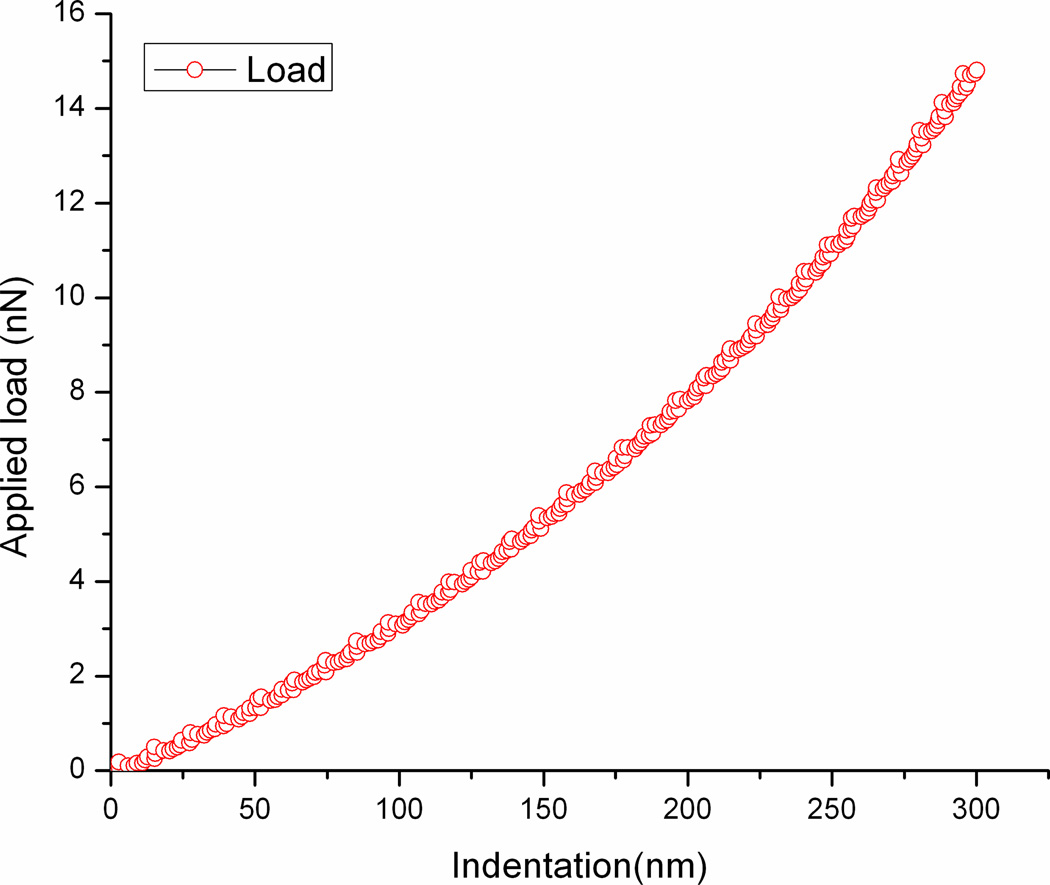
Based on the above method, the deflection-displacement is converted to the force-indentation curve as shown in Fig. 2 which depicts directly the elasticity of the cell surface.
Fig. 2.
A typical force-indentation curve of the cell surface.
III. Experimental Results
A. Live cell imaging
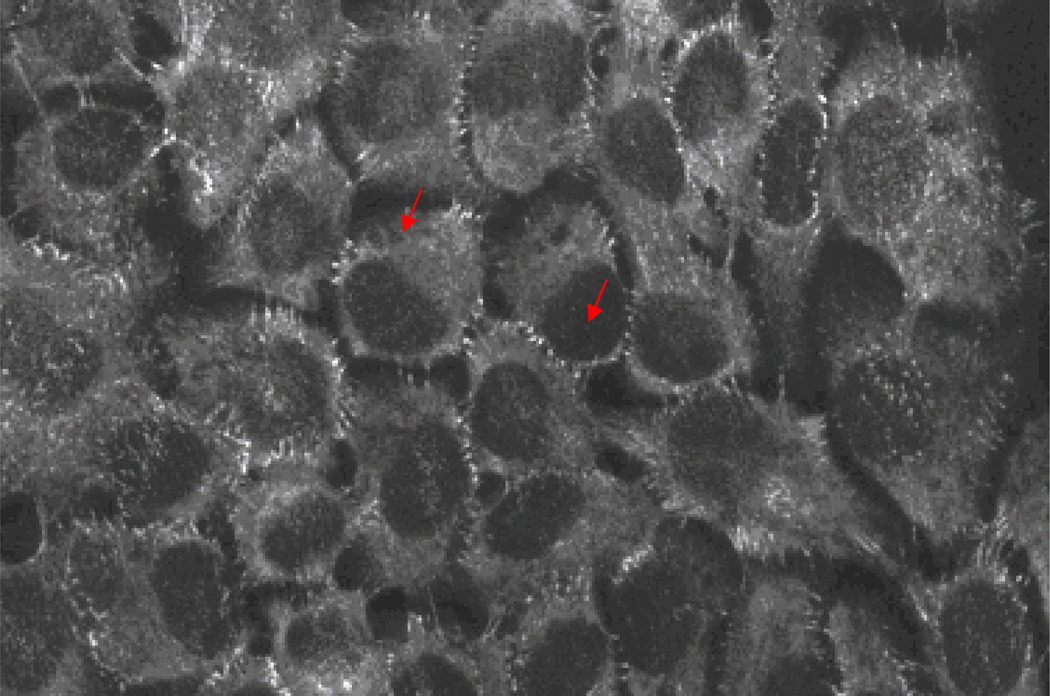
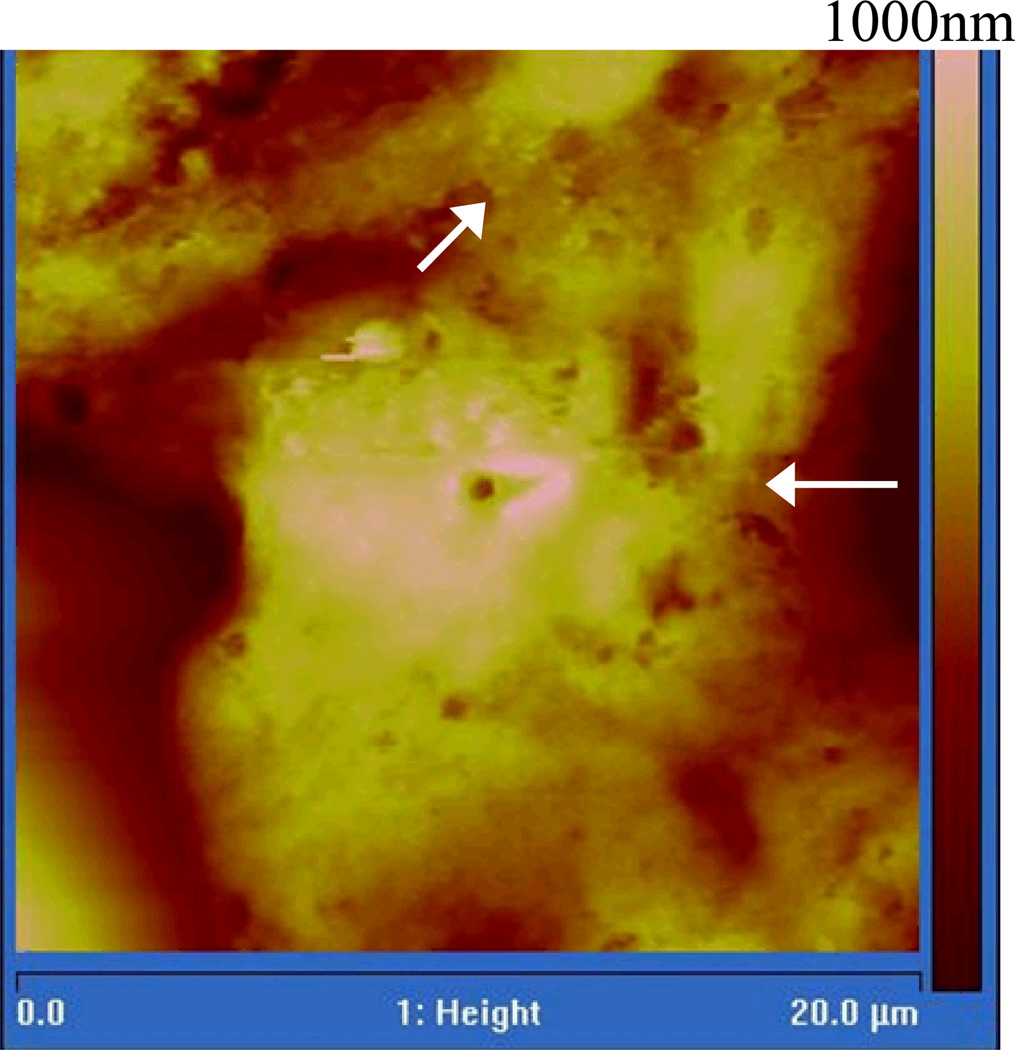
We first obtained AFM images to visualize the desmosomal junction structures of living HaCaT cells under physiological condition. After the cells had grown to confluence, the overall formation of the desmosomal junction between adjacent cells was confirmed by using immunofluorescence microscopy. The immunofluorescence image reveals the desmoplakin, a protein associated with desmosomes, distributes in the peripheral of the cell (Fig. 3). This confirms that the cell forms desmosome between their neighbors. In order to obtain a detailed view of these cell junction structures, we used tapping mode AFM to obtain the live cell images at those boundaries of the cell with scan sizes of 20 × 20 µm2 at a scan rate of 0.4Hz. As shown in Fig. 4, the position and structure of the cell junction between two cells can be clearly observed. Besides, the cell dimensions and height can also be measured from the AFM image.
Fig. 3.
Immunofluoresence image of the fixed HaCaT cells. The arrows indicate desmoplakin (stained for FTIC), one of the main proteins in the desmosomal protein family, distributed in the peripheral of the cell. This confirms that the cell forms desmosome between their neighbors. The AFM images were taken at those boundaries to visualize the detailed structure of the cell-cell adhesion structure.
Fig. 4.
A typical AFM image of living HaCaTs. The cell shape and overall structure between two cells are clearly shown in a height image [scan size: 20 × 20 µm2]. The arrows indicate the cell-cell junction between two adjacent keratinocytes.
B. Force measurement
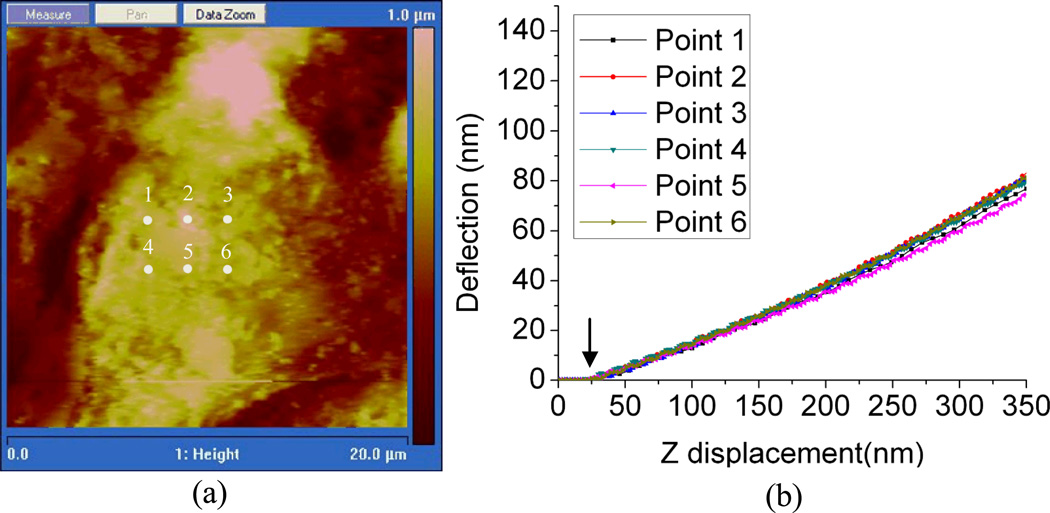
In addition to providing a visual representation of the cellular junction, we have also conducted AFM force measurements on various locations of the cell to address the potential variations in topography across the cell surface. In the experiment, several contact positions for force measurements were selected near the center of a single keratinocyte (Fig. 5a) and the corresponding deflection-displacement curves are shown in Fig. 5b. As the probe tip is brought close to the surface, a cell contact point was established (arrow, Fig. 5b), and thereafter indenting the cell surface. Once the tip contacts the cell surface, the force increases along with increasing indentation in the cell membrane. The slope, or shape of the deflection-displacement curve provides information regarding the elasticity of the sample surface. Our data show that there are no meaningful differences of the applied force near the center of the cell.
Fig. 5.
Force measurements of living HaCaT cells. (a) The numbered marks indicate the positions where force–displacement curve measurements were obtained (overlaid on a height image to visualize HaCaT cell topography). (b) Deflection–displacement curves measured on the living HaCaT cell at positions marked in Fig. 4(a). The arrow indicates the contact point of the cell and the AFM tip.
C. Quantitative measurement of HaCaT cells after anti-Dsg 3 antibody treatment
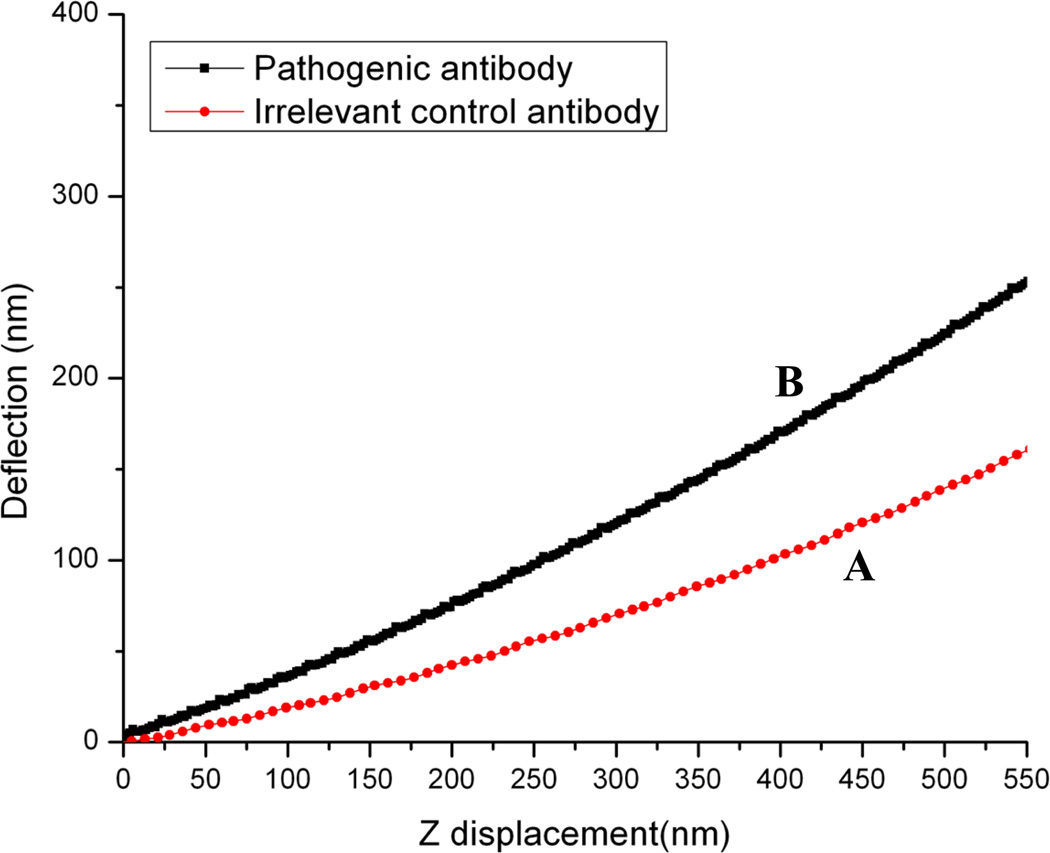
Dsg 3 is a structural component of the cell junction and the effect of specific antibody binding to this molecule was studied by our force measurement setup. Firstly, the overall structure of the living HaCaT cells and the measuring position was defined from the AFM image. A droplet of irrelevant control antibody was then added to the sample and deflection-displacement curves were immediately obtained on the center of the cell (Fig. 6). The equal amount of pathogenic anti-Dsg3 antibody was added to the same sample and deflection-displacement curve of the identical location was taken after 1h (Fig. 6). Experimental data indicate that the deflection-displacement curve is changed by pathogenic anti-Dsg3 antibody treatment.
Fig. 6.
Comparison of deflection-displacement curves of living HaCaT cells from the same sample with (A) goat anti-mouse Ig irrelevant control antibody and (B) 1h post pathogenic anti-Dsg3 antibody treatment.
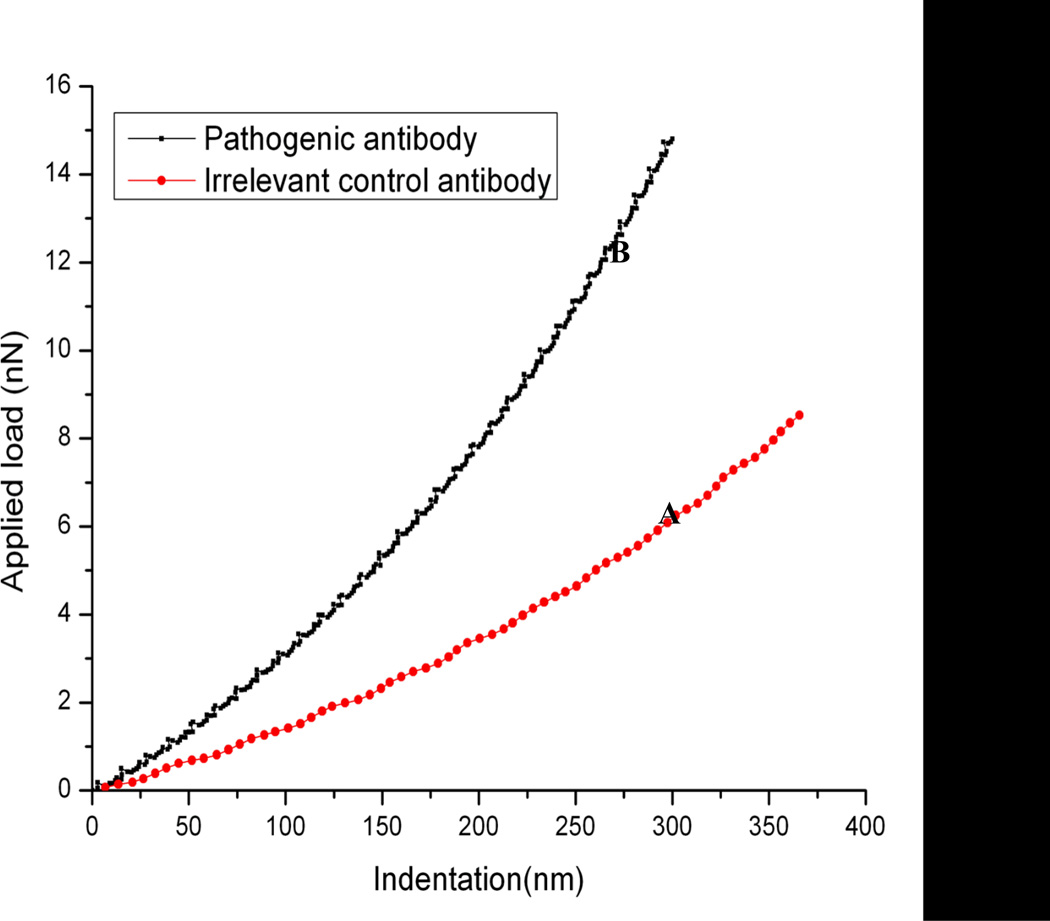
In addition, as mentioned in Section II, the cell indentation can also be calculated from the deflection-displacement curve. Based on the deflection-displacement curves with different antibody treatment, we have calculated the corresponding indentation of HaCaT cells and obtained the force-indentation curves (Fig. 7). It indicated that the loading force is notably increased by anti-Dsg3 antibody binding, suggesting that the cell is harder after antibody treatment.
Fig. 7.
Comparison of force-indentation curves of living HaCaT cells from the same sample with (A) goat anti-mouse Ig irrelevant control antibody and (B) 1h post pathogenic anti-Dsg3 antibody treatment.
D. Elasticity data
The Young’s modulus of the cell for each condition can be calculated by performing the curve fitting of the force-indentation curves using the Hertzian model. For a conical shaped tip, the Hertain model can be expressed as [22]:
| (4) |
where E is the apparent Young’s modulus, ν is the Poisson ratio and α is the half open angle for the conical shape. δ is the indentation and F is the indentation force defined in Eq. (2)–(3).
Therefore the fitting parameter would be:
| (5) |
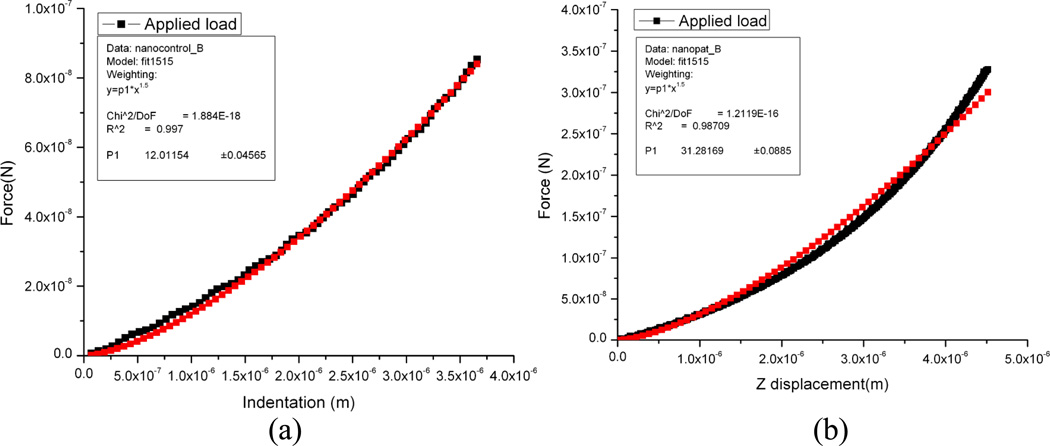
The fitting curves for force-indentation curves of living HaCaT cells with goat anti-mouse Ig irrelevant control antibody and 1h post pathogenic anti-Dsg3 antibody treatment are shown in Fig. 8. For the control sample (P=12.01154), the E was calculated as 84.5KPa (Fig. 8a), while for the pathogenic antibody treated sample (P=31.25158), the Young’s modulus was 247 KPa (Fig. 8b). It indicates three-fold increase of elasticity (from 84.5 to 247 KPa) after antibody treatment. As from the literature, the Young’s modulus of the epithelial cell varies in different orders depending on their growing stage, including passage times, the days of growing for individual passage and the region of the AFM poking [23]. The elasticity of cells has also been described in terms of old cells (more than 25 passages) and young ones (less than 3 passages), and in nucleus, cytoplasm and cell edge [24]. For the old cells in their nucleus, the Young’s modulus is between 20 KPa and 100 KPa [24] by using AFM nanoindentation. As a comparison, the cells used in our studies were more than 25 passages, and all the AFM force curves were taken in the center of the cell. Therefore our elasticity data of 84.5 KPa agrees well with their findings.
Fig. 8.
Hertzian fitting of force-indentation curves of living HaCaT cells from the same sample with (A) goat anti-mouse Ig irrelevant control antibody and (B) 1h post pathogenic anti-Dsg3 antibody treatment. For the control sample (P=12.01154), the E then can be calculated as 84.5KPa, while for the pathogenic antibody treated sample (P=31.25158), the Young’s modulus would be 247 KPa. The Young’s modulus increased three-fold after antibody treatment. Red line indicates the fitting using the Hertz model, and black indicates the experimental data.
IV. Discussion
The major findings of this paper is the demonstration of AFM for investigating the nanoscale junction protein structures of living HaCaT cells and track qualitative and quantitative changes pre- and post-antibody treatment in real-time. The major problematic issue in medicine is the lack of fundamental understanding of the molecular mechanisms that cause major life-threatening and incurable diseases. The development of AFM opens an entirely new way to address these medical questions. There are several experimental difficulties in performing both the imaging and quantitative measurement of living epithelial cells using AFM. Studies of living epithelial cells using AFM with high resolution are hampered by cell deformation and tip contamination [25]. The time duration for the study must be optimized to avoid that living cells suffer from non-physiological conditions during extended longitudinal time-point analysis and long imaging intervals. Because of cell surface inhomogeneities and movements, it is difficult to determinate the contact point between the tip and the cell accurately. Also, the variation in the repulsive force with sample indentation is dependent upon the material properties of the tip and the sample, as well as the shape of the tip. These factors can result in variation of the elasticity calculated from the force curves. In this case, a calibration of the cantilever is necessary to calculate the applied force.
To deal with the experimental difficulties described above, we have developed a new experimental approach for determining elastic properties of living epithelial cells with different antibody treatment. We performed high resolution live cell imaging by AFM and the measuring position of the cell for each indentation cycle was accurately controlled. We have previously demonstrated that AFM can be used to monitor the structural changes of the cell junction after antibody treatment [26]. Here, we provide a novel extension to these studies to examine the mechanical property of the cell junction and to provide a further insight on the molecular mechanism for desmosomal disassociation. We demonstrated that the elastic modulus increased 3-fold after specific antibody treatment. Since the complicated structures and experimental difficulties presented above, currently there is no report on the measurement of elasticity after the desmosomal disruption. Further research is needed to fully explain this phenomenon. For example, by using the tensegrity model to describe the phenomenon and then theoretically use the model to verify the results. As coined by Ingber et al. [27], cells can be regarded as a tensegrity structure. In this tensional integrity body, one of the cytoskeleton elements the microtubule bares the compression force while the actin filament and the intermediate filament bare the tensional force. Therefore the cytoskeleton elements along with the extracellular matrix (ECM) which serves as anchoring point for actin filaments can achieve force balance under which prestress can be defined. The prestress therefore determines the stiffness of the cell body as a whole, of which apparent Young’s modulus is a quantitative measurement. We believe that after the cell-cell adhesion structure being destroyed by antibody treatment, the anchorage for intermediate filament is removed. Then a new force balance should be established for the living cell. Under the new force balance, the prestress should be different, thus the stiffness will be changed.
V. Conclusion
The novel technological approach to study the living epithelial adhesion structures is presented. We have used AFM system for the first time to visualize living epithelial cells and obtain the detailed quantitative study and determine changes at the cell surface of keratinocytes induced by autoantibodies directed against desmoglein 3 (Dsg3). Our study advances the application of AFM technology to the study of human cells and provides a new approach to visualize cells in physiologic and pathologic conditions. Based on high magnification AFM images of living cells, small structures associated with the cellular adhesion complex can be clearly observed. Analysis of specific anti-Dsg3 antibody binding on keratinocytes in the same sample demonstrates that the mechanical property of the cell structures is affected by specific antibody. It is our expectation that detailed nanoscale visual images and quantitative mechanical data will be of importance to more clearly understand the dynamic changes at the keratinocyte surface that are associated with conditions likely to be reflective of the in vivo state in PV patients and that are critical to the development of disease.
Contributor Information
Carmen Kar Man Fung, College of Engineering, Department of Electrical and Computer Engineering, Michigan State University, East Lansing, MI 48824 USA.
Ning Xi, College of Engineering, Department of Electrical and Computer Engineering, Michigan State University, East Lansing, MI 48824 USA (Phone: 517-432-1925; fax: 517-353-1980; xin@egr.msu.edu).
Ruiguo Yang, College of Engineering, Department of Electrical and Computer Engineering, Michigan State University, East Lansing, MI 48824 USA.
Kristina Seiffert-Sinha, Division of Dermatology and Cutaneous Sciences, Center for Investigative Dermatology, Michigan State University, East Lansing, MI 48824 USA.
King Wai Chiu Lai, College of Engineering, Department of Electrical and Computer Engineering, Michigan State University, East Lansing, MI 48824 USA.
Animesh A. Sinha, Division of Dermatology and Cutaneous Sciences, Center for Investigative Dermatology, Michigan State University, East Lansing, MI 48824 USA
REFERENCES
- 1.Engel A, Müller DJ. Observing single biomolecules at work with the atomic force microscope. Nature Structural Biology. 2000;vol. 7(no. 9):715–718. doi: 10.1038/78929. [DOI] [PubMed] [Google Scholar]
- 2.Hörber JKH, Miles MJ. Scanning probe evolution in biology. Science. 2003;vol. 302:1002–1005. doi: 10.1126/science.1067410. [DOI] [PubMed] [Google Scholar]
- 3.Dufrêne YF. Using nanotechniques to explore microbial surfaces. Nature Reviews Microbiology. 2004;vol. 2:451–460. doi: 10.1038/nrmicro905. [DOI] [PubMed] [Google Scholar]
- 4.Cross SE, Jin Y, Rao J, Gimzewski JK. Nanomechanical analysis of cells from cancer patients. Nat. Nanotechnology. 2007;vol. 2:780–783. doi: 10.1038/nnano.2007.388. [DOI] [PubMed] [Google Scholar]
- 5.Suresh S. Nanomedicine: elastic clues in cancer detection. Nat. Nanotechnology. 2007;vol. 2:748–749. doi: 10.1038/nnano.2007.397. [DOI] [PubMed] [Google Scholar]
- 6.Li QS, Lee GYH, Ong CN, Lim CT. AFM indentation study of breast cancer cells. Biomedical and biophysical research communications. 2008;vol. 374:609–613. doi: 10.1016/j.bbrc.2008.07.078. [DOI] [PubMed] [Google Scholar]
- 7.Stolz M, et al. Early detection of aging cartilage and osteoarthritis in mice and patient samples using atomic force microsopy. Nat. Nanotechnology. 2009;vol. 4:186–192. doi: 10.1038/nnano.2008.410. [DOI] [PubMed] [Google Scholar]
- 8.Amoudi AlA, Frangakis AS. Structural studies on desmosomes. Biochem Soc Trans. 2008;vol. 36:181–187. doi: 10.1042/BST0360181. [DOI] [PubMed] [Google Scholar]
- 9.Payne AS, Hanakawa Y, Amagai M, Stanley JR. Desmosomes and disease. Curr Opin Cell Biol. 2004;vol.16(no.5):536–543. doi: 10.1016/j.ceb.2004.07.006. [DOI] [PubMed] [Google Scholar]
- 10.Becker BA, Gaspari AA. Pemphigus vulgaris and vegetans. Dermatol Clin. 1993;vol.11:429–452. [PubMed] [Google Scholar]
- 11.He WZ, Cowin P, Stokes DL. Untangling desmosomal knots with electron tomography. Science. 2003;vol. 302:109–113. doi: 10.1126/science.1086957. [DOI] [PubMed] [Google Scholar]
- 12.Cross SE, Jin Y, Rao J, Gimzewski JK. Applicability of AFM in cancer detection. Nature nanotechnology. 2009;vol. 4:72–73. [Google Scholar]
- 13.Rieti S, Manni V, Lisi A, Grimaldi S, Generosi R, Luce M, et al. Morphological and biochemical analysis by atomic force microscopy and scanning near-field optical microscopy techniques of human keratinocytes (HaCaT) exposed to extremely low frequency 50 Hz magnetic field. Appl Phys Lett. 2002;vol. 81(no. 1):2890–2892. [Google Scholar]
- 14.Rieti S, Manni V, Lisi A, Giuliani L, Sacco D, D’emilia E, Cricenti A, et al. SNOM and AFM microscopy techniques to study the effect of non-ionizing radiation on the morphological and biochemical properties of human keratinocytes cell line (HaCaT) J Microscopy. 2004;vol. 213(Pt1):20–28. doi: 10.1111/j.1365-2818.2004.01279.x. [DOI] [PubMed] [Google Scholar]
- 15.Waschke J, Menendez-Castro C, Bruggeman P, Koob R, Amagai M, Gruber HJ, et al. Imaging and force spectroscopy on desmoglein 1 using atomic force microscopy reveal multivalent Ca2+-Dependent, low-affinity trans-interaction. J Membrane Biol. 2007;vol. 216:83–92. doi: 10.1007/s00232-007-9037-9. [DOI] [PubMed] [Google Scholar]
- 16.Boukamp P, Petrussevska RT, Breitkreutz D, Hornung J, Markham A, Fusenig NE. Normal keratinization in a spontaneously immortalized aneuploid human keratinocyte cell line. J Cell Biol. 1998;vol. 106:761–771. doi: 10.1083/jcb.106.3.761. [DOI] [PMC free article] [PubMed] [Google Scholar]
- 17.Lanza A, et al. Internalization of non-clustered desmoglein 1 without depletion of desmoglein 1 from adhesion complexes in an experimental model of the autoimmune disease pemphigus foliaceus. Int J Immunopathol Pharmacol. 2007;vol. 20:355–361. doi: 10.1177/039463200702000216. [DOI] [PubMed] [Google Scholar]
- 18.Kimura TE, Merritt AJ, Garrod DR. Calcium-independent desmosomes of keratinocytes are hyper-adhesive. J Invest Dermatol. 2007;vol. 127:775–781. doi: 10.1038/sj.jid.5700643. [DOI] [PubMed] [Google Scholar]
- 19.Bazzi H, et al. Desmoglein 4 is expressed in highly differentiated keratinocytes and trichocytes in human epidermis and hair follicle. Differentiation. 2006;vol. 74:129–140. doi: 10.1111/j.1432-0436.2006.00061.x. [DOI] [PubMed] [Google Scholar]
- 20.Proby CM, Ota T, Suzuki H, Koyasu S, Gamou S, Shimizu N, et al. Development of chimeric molecules for recognition and targeting of antigen-specific B cells in pemphigus vulgaris. Br J Dermatol. 2001;vol. 142(no.2):321–330. doi: 10.1046/j.1365-2133.2000.03328.x. [DOI] [PubMed] [Google Scholar]
- 21.Weisenhorn AL, Khorsandi M, Kasas S, Gotzos V, Butt HJ. Deformation and height anomaly of soft surfaces studied with an AFM. Nanotechnology. 1993;vol. 4:106–113. [Google Scholar]
- 22.Touhami A, Nysten B, Dufrene YF. Nanoscale mapping of the elasticity of microbial cells by atomic force microscopy. Langmuir. 2003;vol. 19:4539–4543. [Google Scholar]
- 23.Berdyyeva TK, Woodworth CD, Sokolov I. Human epithelial cells increase their rigidity with ageing in vitro: direct measurements. Phys Med Biol. 2005;vol. 50:81–92. doi: 10.1088/0031-9155/50/1/007. [DOI] [PubMed] [Google Scholar]
- 24.Sokolov I, Swaminathan Iyer I, Woodworth CD. Recovery of elasticity of human epithelial cells in vitro. Nanomedicine: Nanotechnology. 2006;vol. 2:31–36. doi: 10.1016/j.nano.2005.12.002. [DOI] [PubMed] [Google Scholar]
- 25.Putman CA, van der Werf KO, de Grooth BG, van Hulst NF, Greve J. Viscoelasticity of living cells allows high resolution imaging by tapping mode atomic force microscopy. Biophys J. 1994;vol. 67:1749–1753. doi: 10.1016/S0006-3495(94)80649-6. [DOI] [PMC free article] [PubMed] [Google Scholar]
- 26.Fung CKM, Seiffert-Sinha K, Lai KWC, Yang R, Panyard D, Zhang J, Xi N, Sinha AA. Investigation of human keratinocyte cell adhesion using atomic force microscopy (AFM) Nanomedicine: Nanotechnology. 2009 doi: 10.1016/j.nano.2009.05.008. [DOI] [PubMed] [Google Scholar]
- 27.Ingber DE. Cell tensegrity I: Cell structure and hierarchical systems biology. J. Cell Sci. 2003;vol. 116:1157–1173. doi: 10.1242/jcs.00359. [DOI] [PubMed] [Google Scholar]


