

Abstract
Cardiovascular disease (CVD) affects millions of people worldwide and is influenced by numerous factors, including lifestyle and genetics. Expression quantitative trait loci (eQTLs) influence gene expression and are good candidates for CVD risk. Founder-effect pedigrees can provide additional power to map genes associated with disease risk. Therefore, we identified eQTLs in the genetic isolate of Norfolk Island (NI) and tested for associations between these and CVD risk factors. We measured genome-wide transcript levels of blood lymphocytes in 330 individuals and used pedigree-based heritability analysis to identify heritable transcripts. eQTLs were identified by genome-wide association testing of these transcripts. Testing for association between CVD risk factors (i.e., blood lipids, blood pressure, and body fat indices) and eQTLs revealed 1,712 heritable transcripts (p < 0.05) with heritability values ranging from 0.18 to 0.84. From these, we identified 200 cis-acting and 70 trans-acting eQTLs (p < 1.84 × 10⁻⁷) An eQTL-centric analysis of CVD risk traits revealed multiple associations, including 12 previously associated with CVD-related traits. Trait versus eQTL regression modeling identified four CVD risk candidates (NAAA, PAPSS1, NME1, and PRDX1), all of which have known biological roles in disease. In addition, we implicated several genes previously associated with CVD risk traits, including MTHFR and FN3KRP. We have successfully identified a panel of eQTLs in the NI pedigree and used this to implicate several genes in CVD risk. Future studies are required for further assessing the functional importance of these eQTLs and whether the findings here also relate to outbred populations.
Introduction
Cardiovascular disease (CVD) is an abnormal function of the heart or blood vessels. This can lead to an increase in risk of heart attack, heart failure, and stroke, which are the leading causes of death world-wide.1 It is well established that genetic variants influence CVD risk, and many genetic loci have been implicated in CVD risk traits, such as hypertension, hyperlipidemia, hyperglycemia, and obesity.2–4 Expression quantitative trait loci (eQTLs) represent human genomic regions harboring genetic variants that confer a marked effect on transcript expression level and are either proximal (cis-acting) or distal (trans-acting) to the gene. It is well established that gene expression levels exhibit genetic heritability.5,6 Many eQTLs have been mapped with markers such as short tandem repeats7–9 and, more recently, SNPs via dense genome-wide arrays.10–13 Genome-wide association studies (GWASs) have identified multiple SNPs associated with risk of common diseases, and attention has now turned to explaining the underlying molecular mechanisms. The aim of the genetics of gene expression is to identify loci associated with disease and specific gene expression.
Population- and pedigree-based studies have successfully mapped numerous eQTLs.7,11,14 Isolated founder populations potentially provide increased power to detect the underlying genetic architecture of certain complex diseases.15,16 This is due to several unique properties, including a shared stable environment, reduced genetic complexity, extended linkage disequilibrium (LD), and the existence of large pedigrees compared to unrelated outbred populations.4,17 A recent pedigree-based study used genome-wide transcriptional profile data from peripheral-blood mononuclear cells (PBMCs) obtained from participants in the San Antonio Family Heart Study7 to perform heritability and linkage analysis of the pedigrees, which led to a detailed eQTL map and the discovery of several functional variants associated with CVD and metabolic disorders; the most significant finding was 67 cis-regulated transcripts associated with high-density-lipoprotein (HDL) cholesterol levels.
This study examined a very large pedigree from the isolated population of Norfolk Island (NI) to identify eQTLs associated with CVD risk traits. The NI population is a genetic isolate with strong family groups and a well-documented family genealogy.18,19 To date, the Norfolk Island Health Study (NIHS) has collected data and samples for 1,199 Norfolk Islanders, 52% (n = 624) of whom were found to have direct links to the original founders. A large multigenerational NI pedigree has been reconstructed with this in-depth genealogical information.20 Several studies have established admixture scores and the presence of founder effects within the NI pedigree.20,21 This pedigree has been shown to provide the statistical power to detect genetic loci influencing complex traits via linkage and association.22–25
Compared to mainland Australia, NI has high rates of CVD-related risk-factor traits, especially obesity. Reported rates of type 2 diabetes (T2D [MIM 125853]) in the NI population are similar to those in mainland Australia (4%–8%), although the fact that a significantly higher proportion of individuals have fasting blood glucose in excess of these normal ranges suggests that T2D is underdiagnosed in the NI population.26 Research on the NI pedigree has shown that traits for obesity, dyslipidaemia, blood glucose, and hypertension exhibit a substantial genetic component; heritability estimates range from 30% for systolic blood pressure (SBP) to 63% for low-density-lipoprotein (LDL) cholesterol.26 In addition, factor analysis has identified “composite” phenotypes with high heritability,22 suggesting that common gene(s) underlie CVD-related phenotypes. Genetic linkage analysis in the NI pedigree has successfully identified previously documented regions associated with CVD risk traits; the most significant of these regions is on chromosome 1 (1p36) and is associated with SBP.24
This study is based on the hypothesis that variation in heritable gene expression in PBMCs contributes to CVD risk-factor traits and, therefore, that mapped eQTLs also correlate with these traits. Using genome-wide SNP and gene expression data, we mapped eQTLs and interrogated them for correlations with CVD risk traits. Using a pedigree-based association approach, we have shown that variation in CVD risk-factor traits can be partly explained by heritable variation in gene expression (a quantitative endophenotype) and have identified several genes implicated in CVD risk.
Material and Methods
Cohort Collection and Ethics
The NIHS has already been well established in previous research.22,23,26 In this study, we used a group of individuals selected from the “core” pedigree, meaning that they relate back to the original founders, and we have phenotype and genotype information for them. The total number of core pedigree members selected was 330 (this was adjusted to exclude individuals under the age of 18 years). Baseline statistics were previously calculated for all CVD-related traits—these include all the biochemical measures, as well as body-size and composition traits.26 Phenotypic baseline statistics were calculated in R 2.15.2 (Table S1, available online).27 The “complete” NI pedigree structure includes ∼5,700 NI individuals spanning 11 generations and ∼200 years.20 We used SOLAR to estimate h2 (heritability) and power for this extended pedigree (Figure S1). All individuals gave written informed consent, and ethical approval was granted prior to the commencement of the study by the Griffith University Human Research Ethics Committee.
Metabolic Assessment of Disease Risk
A series of metabolic predictions of disease risk for metabolic syndrome (MetS [MIM 605552]), T2D, and CVD were calculated with the available clinical data. All risk-assessment tools were converted into custom R scripts. For MetS, the risk equation used was based on an established clinical MetS diagnosis according to the joint recommendations of the International Diabetes Federation, American Heart Association, and National Heart, Lung, and Blood Institute (NHLBI).28 The risk of developing T2D was estimated with the Australian Diabetes Risk Assessment Tool (AUSDRISK),29 available as a self-completion form online. T2D risk in the NI population was compared with that in mainland Australia (data obtained from the Australian Diabetes, Obesity, and Lifestyle Study [AusDiab] Report 2012; see Web Resources). The risk of developing CVD in the next 5 years was estimated for each individual with the PREDICT-CVD equation.30
Genome-wide Expression
For gene expression analysis, blood was collected and stored at −20°C in PAXgene tubes (QIAGEN). PAXgene Blood miRNA Kits (QIAGEN) were used for extracting total RNA according to the manufacturer’s instructions, and RNA was assessed for quality with the Bioanalyzer 2100 (Agilent Technologies). A total of 250 ng of RNA was amplified and labeled with the Illumina TotalPrep-96 RNA Amplification Kit (Life Technologies) according to the manufacturer’s instructions. Expression profiling was performed with the HumanHT-12 v.4 Expression BeadChip Kit (Illumina) with 750 ng of amplified RNA according to the Whole-Genome Gene Expression Direct Hybridization Assay Guide. Array images were scanned on the Illumina iScan and analyzed initially with the Gene Expression Module from GenomeStudio (v.2011.1). Background subtraction was applied, and missing bead types were imputed with GenomeStudio. On the basis of the number of expressed probes (at “detection p values” ≤ 0.05), mean raw expression values across probes, and correlations (across probes) between samples, all samples provided high-quality data, except for one sample that was of questionable quality (this was removed). Significantly expressed probes were then determined at a false-discovery rate of 5% on the basis of p values generated in a binomial test on the counts of samples in which a probe generated “detection p values” ≤ 0.05 (success) and > 0.05 (failure). Subsequently, the raw expression levels of probes detecting significant expression were shifted by a constant amount so that the minimum observed value of any probe in any sample was 1.0; this was followed by log2 transformation and quantile normalization.
Genome-wide SNP Genotyping
EDTA anticoagulated venous blood samples were collected from all participants. Genomic DNA was extracted from blood buffy coats via standard phenol-chloroform procedures. Genome-wide genotyping was carried out with the Illumina Human610-Quad v.1.0 BeadChip. Raw data from Illumina idat files was SNP genotyped in R with the CRLMM package.31 Genotype data then underwent quality-control routines with PLINK.32 In brief, SNP analysis was restricted to autosomal SNPs with a minor allele frequency > 0.01, call rate > 0.95, and Hardy-Weinberg equilibrium testing p value > 10−5. After quality control, 590,603 SNPs were used for association analyses with expression. Genotype data were then exported from PLINK and imported into the CRAN package GenABEL33 for analysis.
Statistical Analysis
Identification of eQTLs
We used SOLAR34 to estimate the power to detect heritability in the NI population. We split normalized gene expression data (23,323 transcripts) into smaller “packets” of 1,000 to facilitate high-throughput batching by parallel processing via the SNOW package in R. Analysis of transcript heritability was batched with custom R scripts and the package GenABEL33 with the polygenic model. The polygenic-model function implemented in GenABEL is capable of estimating the narrow-sense heritability (h2) of a trait. The polygenic model takes into account the fact that potentially thousands of genetic variants contribute to a trait’s phenotype. The function implemented in GenABEL maximizes the likelihood of the data under a polygenic model with covariates and reports twice negative maximum likelihood estimates and the inverse of the variance-covariance matrix at the point of maximum likelihood.33 GenABEL also estimates residuals of the trait and the inverse of the variance-covariance matrix for further use in association analysis with the mmscore function.33 The polygenic model within GenABEL implements variance components defined to account for linked major gene effects, background polygenic effects, and environmental effects. Age and sex, as well as genetic structure, which was assessed by principal-component analysis with the KING35 program, were included as covariates. The top two components (Table S3) were chosen as covariates because we found that these explained the majority of the variance in the outcomes being tested and because inclusion of additional, less informative components only served to reduce the parsimony of the models. All heritable transcripts were then treated as phenotypes, and batched GWASs were run. The mmscore function as implemented in GenABEL was used. This function represents a mixed-model approximation analysis for association between a trait and genetic polymorphism and is specifically designed for association testing in samples of related individuals. This allows for per-SNP association testing using a polygenic (mixed)-model approach.33 The study-wide significance was set on the basis of the Meff (minimum effective number of tests) adjustment (p = 1.84 × 10⁻⁷). A series of custom filters were designed to identify cis and trans eQTLs: the presence of multiple adjacent SNPs in a peak (within ± 20 kb), a SNP- and chromosome-location filter, a chromosome-quadrant filter, and a graphical filter (modified Manhattan plots with kern smoothing to facilitate peak identification). All eQTLs were defined by the “tagging” SNP, the SNP that showed the most significant association with the given transcript. A custom R script was used for identifying the eQTLs that mapped to genes previously associated with disease in the GWAS database.36 The GWAS database was downloaded as a plain-text file on February 10, 2013, so analysis was conducted on reported associations up to that date.
eQTL-Centric Association Analysis
A set of 2,200 SNPs representing all of those surpassing the Meff-adjusted threshold (1.84 × 10⁻⁷) within eQTL peaks were extracted and used as a basis for an eQTL-centric association analysis. For this analysis, all CVD- and obesity-related phenotypes were run in a GWAS-based approach in GenABEL33 with the use of the extracted SNP set. A short list of traits was obtained with a relaxed significance threshold of 1.0 × 10⁻².
Correlation of Key Transcript(s) with Phenotype
To investigate the effects of expression on CVD phenotypes, we performed stepwise regression modeling in R 2.15.227 by using a forward-selection algorithm with the CVD phenotype as the response variable. The forward-selection algorithm starts with no variables in the model and adds variables one by one to the model. At each step, the variable added is the one that most improves the fit of the model as measured by the Akaike information criterion. The regression model included the following set of covariates, which were tested in a stepwise fashion: expression transcript (one at a time), age, sex, kinship, and genetic structure (the top two principal components of the complete SNP set were calculated by KING35). Based on the identity-by-descent probability matrix, kinship is an index of relatedness among individuals and is used as a control for the effect of nonindependence among individuals in the sample. It is generally used as a pairwise measure, but in this instance, we generated an average kinship for each pedigree member (calculated in GenABEL with the SNP data). Genetic structure is assessed via principal-component analysis for characterizing population stratification (e.g., admixture), whereby the component membership coefficient can be used in the adjustment for structure effects. Only the models with the transcript as a significant covariate and an overall model p value of 0.05 were included. Model p values were generated from an ANOVA using the F distribution, which tests the null hypothesis that the coefficients represented in the overall regression model (represented by R2) are equal to 0.
Protein-Protein Interaction Prediction
We used STRING v.9.148 to generate a schematic overview of predicted protein-protein interactions of the proteins encoded by NME1 (MIM 156490), PRDX1 (MIM 176763), and PAPSS1 (MIM 603262). We used the default active prediction methods, which include neighborhood, gene fusion, co-occurrence, coexpression, experiments, databases, and text mining. The medium required cutoff confidence score was set to 0.4; the minimum observed was 0.410, and the maximum was 0.986.
Results
Prevalence of CVD Risk Traits in the NI Population
It is well documented that the NI cohort shows an increased prevalence of CVD-related risk traits.22,26 To further confirm these and provide a proof-of-principle baseline risk for our heritability and eQTL analyses, we conducted risk assessment by using a range of established tools that allowed us to report NI’s predicted risk in relation to that of mainland Australia. MetS diagnosis is a well-established predictor for risk of developing further diseases, namely T2D and CVD. Clinical diagnosis of MetS in the NI cohort was conducted according to the joint recommendations of the International Diabetes Federation, American Heart Association, and NHLBI.37 MetS prevalence was 26.4% in the NI cohort participants for whom appropriate phenotype data were available (Table S2). A noticeable difference in prevalence between males (31%) and females (23%) was observed. A recent estimate for MetS prevalence in mainland Australia was approximately 22%.38 Risk of developing T2D was assessed with the AUSDRISK;29 43% of the NI cohort was classed as high risk, and another 42% was identified as intermediate risk. Mainland Australian data were generated with the AUSDRISK and are documented within the AusDiab Report 2012. Thirty-one percent of the mainland Australian cohort was predicted to be at a high risk of developing T2D. According to the PREDICT-CVD tool,30 7% of the NI cohort was estimated to be at a high risk of developing CVD over the next 5 years. This increased to 12% when adjustments were made for MetS (as per the model below). PREDICT-CVD suggests that individuals with a moderate risk or higher report to a clinician for further assessment and analysis; according to these criteria, approximately 31% of the NI cohort would be in this bracket. All three risk-assessment scores further highlight the increased risk of developing CVD, MetS, and T2D in this population and suggest the presence of underlying genetic risk factors.
Heritable Gene Expression Transcripts and Clinical Associations
Prior to eQTL analyses, we filtered gene transcripts (probes) to exclude those with undetectable expression and poor-mapping, hybridization, and/or annotation issues. After filtering, 23,323 transcripts remained for analysis, and normalized expression values were submitted to heritability analysis. SOLAR34 power calculations revealed 80% power to detect transcripts at a heritability ≥ 0.31 (Figure S1). We observed 1,712 significantly heritable transcripts (p < 0.05) with a range of h2 from 0.15 to 0.84 (Figure 1, Table S4). Several of the most significantly heritable transcripts are of potential biological relevance in the context of CVD risk factors. The transcript for GM2A (MIM 613109), a gene evolved in lipid metabolism, exhibited h2 = 0.79 in the NI cohort. In addition, PSAT1 (MIM 610936; transcript h2 = 0.70), has been shown to contain variants associated with visceral fat levels,39 and the UTS2 (urotensin-2 [MIM 604097]) transcript showed high h2 at 0.69 (UTS2 is an active vasoconstrictor in the brain). Interestingly, the NI pedigree exhibits a higher incidence of migraine than do other populations,25,40 which makes further investigation of UTS2 particularly pertinent.
Figure 1.
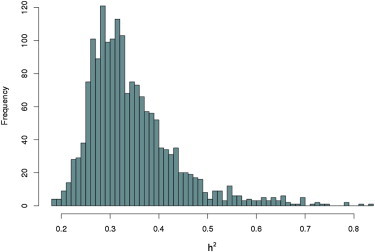
Density Histogram Displaying Significantly Heritable Expression Transcripts in the NI Population
To interrogate potential biologically significant relationships, we performed correlation analyses between all 1,712 heritable transcripts and 14 well-established CVD-related clinical traits: SBP, diastolic blood pressure, pulse pressure (PP), blood lipids (HDL, LDL, total cholesterol, and triglycerides), plasma glucose, waist circumference (WC), hip circumference, body mass index (BMI), waist-to-hip ratio (WHR), weight, and body fat (BF). Using a stepwise regression model including age, sex, kinship, and genetic structure as covariates, we observed that, of these 14 clinical traits, 7 (WHR, BF, weight, WC, SBP, PP, and HDL) showed significant association with a range of expression transcripts (transcript p ≤ 0.05). Table 1 shows the most significant associations with an R2 value > 0.2. The strongest correlation was seen between WHR and two separate transcripts: ILMN_1683093 (R2 = 0.46, transcript p = 1.73 × 10⁻⁶, R2 p ≤ 1 × 10⁻⁶), a probe within glycophorin B (GYPB [MIM 111740]), and ILMN_2352921 (R2 = 0.46, transcript p = 3.47 × 10⁻⁶, R2 p ≤ 1 × 10⁻⁶), a probe within bisphosphoglycerate mutase (BPGM [MIM 613896]). Interestingly, both of these genes play a functional role in blood.41,42 BPGM is involved in glycolysis and oxygen transport. ILMN_2352921 (tagging BPGM) was also significantly associated with SBP (R2 = 0.25, p ≤ 2.01 × 10⁻⁵). These results strongly suggest that there is a potentially biologically significant correlation between heritable gene expression levels and CVD-related traits in the NI population.
Table 1.
Summary of Heritable Transcript versus Trait Associations
| Trait | No. of transcripts | h2_trans_min | h2_trans_max | R2_model_min | R2_model_max | Genes |
|---|---|---|---|---|---|---|
| WHR | 174 | 0.19 | 0.64 | 0.42 | 0.46 | 166 |
| BF | 407 | 0.16 | 0.74 | 0.36 | 0.42 | 387 |
| Weight | 249 | 0.16 | 0.78 | 0.35 | 0.40 | 240 |
| WC | 222 | 0.15 | 0.74 | 0.30 | 0.37 | 209 |
| SBP | 124 | 0.22 | 0.74 | 0.24 | 0.28 | 122 |
| PP | 101 | 0.23 | 0.60 | 0.23 | 0.27 | 100 |
| HDL | 3 | 0.27 | 0.36 | 0.20 | 0.20 | 3 |
Abbreviations are as follows: BF, body fat; HDL, high-density lipoprotein; PP, pulse pressure; SBP, systolic blood pressure; WC, waist circumference; and WHR, waist-to-hip ratio.
eQTL Mapping in the NI Population
Next, we mapped all heritable transcripts to specific genomic loci (eQTLs). We conducted pedigree-based association analysis of approximately 590,000 SNPs with the 1,712 heritable transcripts. Because of the unique population of NI, we needed to control for population genetic structure and did so by factoring the top two genetic principal components into the modeling process (see Material and Methods for more details). To identify potential eQTL peaks, we used a series of custom filters to interrogate chromosome and physical position, as well as SNP proximity. Peaks were deemed to be robust if two or more SNPs (±20 kb) passed a Meff-adjusted threshold (1.84 × 10⁻⁷). We identified 270 robust eQTLs, of which 200 were cis-acting and 70 were trans-acting (Table S5). Figure 2 shows Manhattan plots for the three most significant cis-acting eQTLs. Price et al. and others have also observed more cis- than trans-acting eQTLs in similarly designed studies.11,43 We generated a genome-wide eQTL map (Figure 3) by plotting each eQTL as represented by its most significantly associated SNP. This allowed easy visualization of eQTL-rich regions, such as 6p21 and 12q13, which are both significantly enriched with cis-eQTLs.
Figure 2.
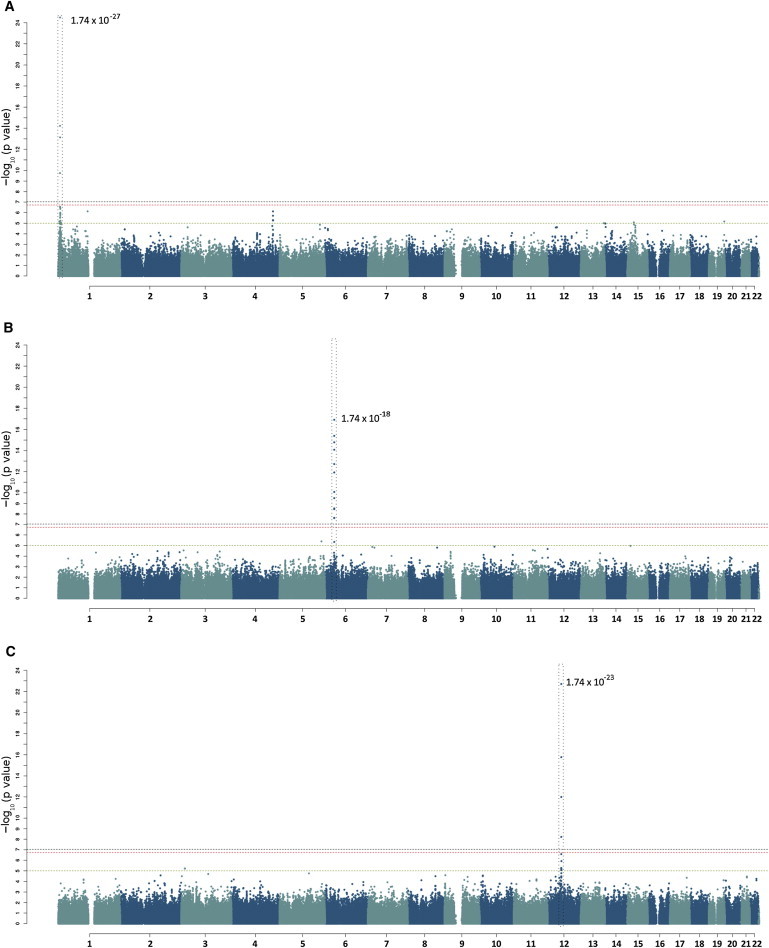
eQTL Manhattan Plots
Example Manhattan plots of expression transcript versus SNP associations.
Figure 3.
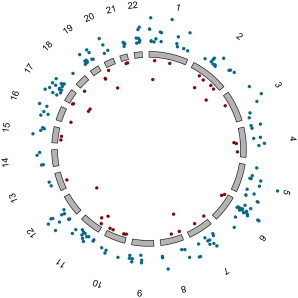
Genome-wide eQTL Map for the NI Cohort
The eQTLs plotted outside the circle in blue demonstrate cis-acting loci, whereas those displayed inside the circle in red are trans-acting loci. The distance from the chromosome corresponds to the significance of the eQTLs, i.e., further away is more significant, and all eQTLs passed the Meff-adjusted threshold (p ≤ 1.84 × 10⁻⁷).
eQTL-Centric SNP Association with CVD Risk Factors
Recent work has suggested that trait-associated SNPs in GWASs are more likely to be associated with eQTLs and, as such, suggests that increased discovery of biologically relevant loci should be facilitated if applied to past and present GWASs.44,45 Therefore, we investigated potential associations between robustly identified eQTLs and all CVD-related risk factors (an eQTL-centric analysis). All significant eQTL-associated SNPs (n = 2,200) were interrogated for association with a given trait (via the above-mentioned pedigree-based association approach). We reset our significance threshold for this part of the study to account for the LD among SNPs in this population. Specifically, we determined that at the genome-wide level, the number of effective tests dropped by 25%–50% for any single chromosome as a result of LD. Thus, we reasoned that a reduction of 25% in the number of tests for an eQTL (or gene) would set a reasonable threshold. This reduced 2,200 to 1,650 tests, which altered the eQTL-centric significance threshold to 3 × 10⁻⁵. There were no SNP associations that met this threshold. When we relaxed the threshold (p ≤ 0.01), we observed 27 SNP-trait associations, which represent ten separate eQTL transcripts and 12 traits (Table 2).
Table 2.
List of eQTL-Centric Association Results: Significant Hits
| Trait | SNP | Chr | Position | A1 | A2 | χ2 | p Value | Probe ID | Transcript Gene | Transcript Chr | eQTL |
|---|---|---|---|---|---|---|---|---|---|---|---|
| Glu | rs1335051 | 1 | 107,460,385 | G | T | 9.78 | 1.8 × 10⁻³ | ILMN_2399463 | VAV3 | 1 | cis |
| Glu | rs2303565 | 2 | 219,253,553 | T | C | 9.33 | 2.3 × 10⁻³ | ILMN_1704985 | CYP27A1 | 2 | cis |
| Glu | rs1344642 | 2 | 219,263,506 | G | A | 9.33 | 2.3 × 10⁻³ | ILMN_1704985 | CYP27A1 | 2 | cis |
| Cholesterol | rs11373 | 16 | 55,102,676 | A | G | 17.30 | 3.2 × 10⁻⁵ | ILMN_1723116 | AMFR | 16 | cis |
| Cholesterol | rs12447395 | 16 | 55,086,841 | T | C | 9.42 | 2.1 × 10⁻³ | ILMN_1723116 | AMFR | 16 | cis |
| Cholesterol | rs2288055 | 16 | 55,059,307 | C | T | 9.25 | 2.4 × 10⁻³ | ILMN_1723116 | AMFR | 16 | cis |
| Cholesterol | rs2288056 | 16 | 55,076,598 | A | G | 9.25 | 2.4 × 10⁻³ | ILMN_1723116 | AMFR | 16 | cis |
| Cholesterol | rs3790113 | 16 | 54,942,221 | T | C | 8.82 | 3.0 × 10⁻³ | ILMN_1723116 | AMFR | 16 | cis |
| HDL | rs3851117 | 11 | 56,993,689 | C | T | 10.13 | 1.5 × 10⁻³ | ILMN_1765332 | TIMM10 | 11 | cis |
| HDL | rs2848630 | 11 | 57,113,483 | G | A | 8.82 | 3.0 × 10⁻³ | ILMN_1765332 | TIMM10 | 11 | cis |
| LDL | rs11373 | 16 | 55,102,676 | A | G | 14.89 | 1.1 × 10⁻⁴ | ILMN_1723116 | AMFR | 16 | cis |
| Trig | rs927340 | 6 | 2,968,717 | G | A | 10.42 | 1.2 × 10⁻³ | ILMN_1674285 | LOC401233 | 6 | cis |
| Trig | rs17106351 | 14 | 19,762,145 | G | A | 10.21 | 1.4 × 10⁻³ | ILMN_1719158 | CTBP1 | 4 | trans |
| Trig | rs9503375 | 6 | 2,991,536 | T | G | 9.11 | 2.5 × 10⁻³ | ILMN_1674285 | LOC401233 | 6 | cis |
| Trig | rs911536 | 6 | 2,972,130 | G | A | 8.95 | 2.8 × 10⁻³ | ILMN_1674285 | LOC401233 | 6 | cis |
| Weight | rs2243523 | 17 | 78,273,738 | G | T | 13.41 | 2.6 × 10⁻⁴ | ILMN_1652333 | FN3KRP | 17 | cis |
| BMI | rs2243523 | 17 | 78,273,738 | G | T | 12.95 | 3.2 × 10⁻⁴ | ILMN_1652333 | FN3KRP | 17 | cis |
| WC | rs10831551 | 11 | 2,194,864 | A | C | 11.75 | 6.1 × 10⁻⁴ | ILMN_1668605 | NAAA | 4 | trans |
| WC | rs2243523 | 17 | 78,273,738 | G | T | 11.75 | 6.1 × 10⁻⁴ | ILMN_1652333 | FN3KRP | 17 | cis |
| WC | rs10831570 | 11 | 2,199,188 | C | A | 10.81 | 1.0 × 10⁻³ | ILMN_1668605 | NAAA | 4 | trans |
| Hip | rs2243523 | 17 | 78,273,738 | G | T | 10.62 | 1.5 × 10⁻³ | ILMN_1652333 | FN3KRP | 17 | cis |
| Hip | rs10831551 | 11 | 2,194,864 | A | C | 9.37 | 2.8 × 10⁻³ | ILMN_1668605 | NAAA | 4 | trans |
| WHR | rs2726207 | 4 | 108,858,940 | A | C | 9.55 | 2.0 × 10⁻³ | ILMN_1781819 | PAPSS1 | 4 | cis |
| SBP | rs17526904 | 8 | 29,003,762 | C | T | 12.00 | 7.7 × 10⁻⁴ | ILMN_1720059 | HMBOX1 | 8 | cis |
| SBP | rs7225515 | 17 | 78,389,072 | G | A | 9.53 | 2.7 × 10⁻³ | ILMN_1652333 | FN3KRP | 17 | cis |
| SBP | rs1044661 | 17 | 78,494,309 | G | A | 9.42 | 2.9 × 10⁻³ | ILMN_1652333 | FN3KRP | 17 | cis |
| DBP | rs4793854 | 17 | 43,927,132 | G | A | 9.31 | 2.3 × 10⁻³ | ILMN_1810274 | HOXB2 | 17 | cis |
Abbreviations are as follows: A1, allele 1; A2, allele 2; BMI, body mass index; chr, chromosome; DBP, diastolic blood pressure; eQTL, expression quantitative trait locus; glu, plasma glucose; HDL, high-density lipoprotein; hip, hip circumference; LDL, low-density lipoprotein; SBP, systolic blood pressure; trig, triglycerides; WC, waist circumference; and WHR, waist-to-hip ratio.
Next, we used a stepwise linear regression to investigate whether the expression level of each of the ten transcripts correlated with their respective CVD risk trait (shown in Table 2). As above, the stepwise model factored in the effects of age, sex, kinship, and genetic structure. Only models with a significant transcript effect of p < 0.05 were accepted. Table 3 shows the results for the five eQTL transcripts that met these criteria. When the top-ranked eQTL-associated SNP was added as a covariate in the regression model, the prediction scores improved slightly for all significant correlations. Predictive values (R2) ranged from 0.25 to 0.42 (Table 3).
Table 3.
Results from Stepwise Linear Regression of Transcripts versus Traits
| Trait | Transcript | Gene | Transcript p Value | R2 | R2p Value |
|---|---|---|---|---|---|
| WHR | ILMN_1668605 | NAAA | 0.021 | 0.42 | <2.2 × 10⁻¹⁶ |
| Body fat | ILMN_1668605 | NAAA | 0.007 | 0.37 | <2.2 × 10⁻¹⁶ |
| Body fat | ILMN_1781819 | PAPSS1 | 0.018 | 0.37 | <2.2 × 10⁻¹⁶ |
| Body fat | ILMN_1741133 | NME1 | 0.014 | 0.37 | <2.2 × 10⁻¹⁶ |
| Weight | ILMN_2366388 | PRDX1 | 0.011 | 0.36 | <2.2 × 10⁻¹⁶ |
| Weight | ILMN_1741133 | NME1 | 0.003 | 0.37 | <2.2 × 10⁻¹⁶ |
| SBP | ILMN_1652333 | FN3KRP | 0.033 | 0.25 | 3.3 × 10⁻¹⁵ |
Abbreviations are as follows: SBP, systolic blood pressure; and WHR, waist-to-hip ratio.
To our knowledge, the five genes (represented by the above five transcripts) had no prior direct association with CVD risk traits. Although five genes is a small number, we wished to investigate whether they are enriched in a specific biological pathway or pathways. Therefore, we used WebGestalt46 to perform pathway-enrichment analysis and applied Bonferroni correction as a robust filter. This revealed enrichment of purine metabolism (p = 2 × 10⁻⁴), which included both NME1 (MIM 156490) and PAPSS1 (MIM 603262). The potential biological significance of this observation is indicated by the role of purine-synthesis dysregulation in hereditary disorders such as gout and kidney failure,47 which are both found at high levels in the NI cohort. In addition, we observed enrichment of insulin signaling (p = 9.4 × 10⁻³), which included both NME1 and PRDX1 (MIM 176763); this pathway plays a role in the metabolic dysfunction seen in CVD and related traits. We used the STRING48 web server to visualize interaction pathways among NME1, PAPSS1, and PRDX1. The resultant protein-protein interaction network (Figure 4) verified that the three genes appear to be significantly enriched and share biological function. The remaining two genes (NAAA [MIM 607469] and FN3KRP [MIM 611683]) were not significantly enriched in any pathways. However, both have interesting metabolic-related associations. NAAA is involved in the endocannabinoid system and has a potential role in obesity through the modulation of food-seeking behavior.49,50 FN3KRP has been tentatively associated with diabetes, and measurement of FN3K (MIM 608425) and FN3KRP activity has been proposed in assessing the risk of diabetes.51,52 The SNP (rs1046896) tagging the FN3KRP eQTL has been previously associated with glycated hemoglobin levels.53
Figure 4.
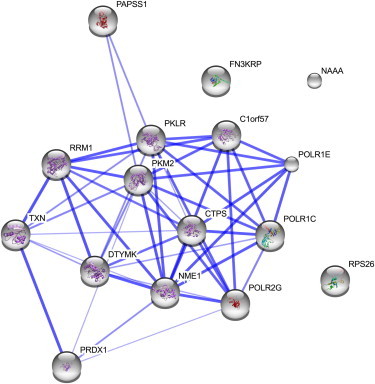
STRING Analysis of Protein-Protein Interaction Network for Three CVD-Trait-Related Candidate Genes: PAPSS1, PRDX1, and NME1
The thickness of the blue connecting lines indicates the level of confidence for a given protein-protein interaction. The presence of a node background indicates that a protein structure is listed in either the Protein Data Base or the SWISS-MODEL database.
Association with GWAS-Associated CVD Traits
A total of 256 unique genes were represented by the 270 eQTLs. In order to further explore the potential association between the eQTL and CVD, we interrogated the GWAS database (accessed February 22, 2013) for overlap with these 256 genes. Twelve overlapped with genes reportedly associated with CVD or related traits (Table 4). Eleven of these were attributed to cis-acting eQTL associations, whereas one exhibited a trans-acting association. One eQTL of interest (tagged by rs1476413) maps to MTHFR (MIM 607093) within 1p36.22; this region has been associated with blood pressure in several GWASs.54–56 Interestingly, this region was also identified as significantly associated with SBP in a linkage analysis conducted on the NI pedigree.24 The linkage study by Bellis et al. identified the chromosomal region 1p36.22 as associated with SBP with a LOD score > 2; there is robust support for the association between this region and SBP by both genetic-isolate4 and general-population studies.57
Table 4.
Overlap of eQTL Genes Mapping to Chromosomal Regions Previously Associated with CVD and Related Traits
| eQTL Transcript | eQTL SNP | eQTL p Value | Gene | Chr | Region | PubMed ID | Disease Trait |
|---|---|---|---|---|---|---|---|
| ILMN_1734830a | rs1476413 | 1.16 × 10⁻⁹ | MTHFR | 1 | 1p36.22 | 19430483; 21909110 | blood pressure |
| ILMN_1746436 | rs9263873 | 9.74 × 10⁻⁹ | HCG27 | 6 | 6p21.33 | 22319020 | coronary heart disease |
| ILMN_1721113 | rs9264904 | 2.16 × 10⁻¹⁵ | HLA-C | 6 | 6p21.33 | 22319020 | coronary heart disease |
| ILMN_1718063 | rs1051338 | 1.29 × 10⁻¹¹ | LIPA | 10 | 10q23.31 | 21378988; 21606135 | coronary heart disease |
| ILMN_2400759 | rs7313 | 1.30 × 10⁻⁸ | CPVL | 7 | 7p14.3 | 17903298 | diabetes related insulin traits |
| ILMN_1661631 | rs103294 | 4.69 × 10⁻¹⁴ | LILRA3 | 19 | 19q13.42 | 20686565 | HDL cholesterol |
| ILMN_1737611 | rs2532501 | 2.02 × 10⁻⁸ | VAMP1 | 12 | 12p13.31 | 17903296 | hip geometry |
| ILMN_1804735 | rs11700748 | 9.64 × 10⁻¹⁰ | CBS | 21 | 21q22.3 | 20031578 | homocysteine levels |
| ILMN_1734830 | rs1476413 | 1.16 × 10⁻⁹ | MTHFR | 1 | 1p36.22 | 20031578 | homocysteine levels |
| ILMN_1795336a | rs7909832 | 9.63 × 10⁻¹⁴ | PTER | 10 | 10p13 | 19151714 | obesity |
| ILMN_1797375 | rs2182667 | 6.51 × 10⁻⁸ | KLF12 | 13 | 13q22.1 | 22359512 | phospholipid levels (plasma) |
| ILMN_1722025 | rs7736263 | 1.67 × 10⁻⁹ | CPEB4 | 5 | 5q35.2 | 20935629 | WHR |
| ILMN_1727045b | rs2835138 | 1.47 × 10⁻⁷ | RASGPR3 | 2 | 2p22.3 | 19421330 | hypertension |
Abbreviations are as follows: chr, chromosome; eQTL, expression quantitative-trait locus; HDL, high-density lipoprotein; and WHR, waist-to-hip ratio.
These eQTLs are also reported in Garnier et al.64
trans-acting eQTL-SNP cluster on chromosome 21.
Discussion
Complex disorders such as CVD are contributed to by the environment, lifestyle, and underlying genetic signatures and interactions. NI is a unique population isolate with increased risk factors for CVD and metabolic-related disorders.22,24 Here, we add to this by showing that the predicted risks for CVD, T2D, and MetS are all higher in the NI population than in mainland Australia, supporting the value of the NI population in the identification of genetic risk factors. Using the NI cohort, we set out to identify eQTLs and their associations with CVD-related traits. Large multigenerational pedigrees from isolated populations can provide enhanced power to detect disease genes and estimate the heritability of disease traits.58,59 CVD traits, along with other complex disorders, are likely to share an underlying and complex layer of genetic control. Identifying genomic loci that influence gene expression levels while associating with disease risk factors can provide vital information for further functional analyses.
Gene expression levels can vary greatly between different tissue types, and there is much discussion in the literature about the utility of using whole blood and PBMCs in gene expression studies.60,61 Because gene expression and therefore eQTLs might be tissue specific,62 it is important to study disease-relevant tissues.10 It is well established that many CVD risk factors are measured via blood biochemical analyses, i.e., lipid levels (HDL, LDL, total cholesterol, triglycerides), blood sugar (glucose), and even markers of inflammation (white blood cell counts). Environmental influences (such as diet, stress, and smoking) are also known to affect the overall blood environment. All of these factors contribute to the local tissue environment and in turn potentially influence gene expression levels, making expression transcript profiling of peripheral blood cells a viable tool for investigating the genetic and nongenetic influences of relevance for disease pathophysiology and risk assessment. Powell et al. showed that gene expression levels in whole blood are significantly heritable.61 In addition, our population has a well-established increased risk of CVD, which means we should have increased power to detect these eQTL and potential associations. Because the NI population is a genetic isolate, all individuals share some common environmental component(s) (for example, diet), and environment (as well as cultural influence) has been shown to directly affect gene expression.63 In addition, there is the possibility of discovering biomarkers in the blood, an easily accessible tissue for clinical sampling.
Using a statistical approach whose efficiency has already been demonstrated in the context of a GWAS-based eQTL-identification method11 by factoring in the unique genetic structure of the NI population, we identified 1,712 heritable blood-based expression transcripts. Subsequent analyses identified 270 significantly associated eQTLs (200 cis-acting and 70 trans-acting) and revealed a genome-wide eQTL map for NI. Initial results of associations between heritable transcripts and traits indicated a few highly heritable expression transcripts that showed potentially meaningful biology in terms of CVD and related traits. Hyperlipidemia and hypertension are CVD risk factors. G2MA, which has functions involved in lipid metabolism, exhibited a high heritability (h2 = 0.79) in this study, and Bellis et al. reported that the NI cohort showed significant heritability of lipid traits—LDL (h2 = 0.42), HDL (h2 = 0.45), and cholesterol (h2 = 0.41).24 In addition, several of the more significantly heritable transcripts mapped to genes involved in blood-pressure-related pathways. Therefore, we might be seeing a relationship between trait and transcript heritability within a functional pathway.
Further validation of our approach is in the identification of SNP-transcript associations in genes previously reported to associate with obesity- and CVD-related traits. A search of the GWAS database revealed several eQTLs that tagged genes and SNPs with prior association to CVD and related traits. In addition to this, we note further validation within a recent genome-wide analysis study that examined the effect of haplotype on the expression of cis-QTLs.64 This study identified 24 eQTLs whose genes have been previously associated with disease. Two transcripts from this study, ILMN_1734830 (1p36.22: MTHFR) and ILMN_1795336 (10p13: PTER [MIM 604446]), were also tagged by eQTLs present in the NI population (Table 4). SNPs within both of these genes have been previously identified to associate with traits such as blood pressure,54,55 obesity,65 and homocysteine levels.66 MTHFR resides within 1p36.22 and encodes methylenetetrahydrofolate reductase, an enzyme that catalyzes the reduction of methylenetetrahydrofolate to methyltetrahydrofolate, a cofactor for homocysteine methylation to methionine.67 Genetic variation in this gene influences, among other disorders, susceptibility to occlusive vascular disease68 and neural-tube defects,69,70 making MTHFR an important candidate gene for diseases such as hypertension, glaucoma, and migraines.71,72 Interestingly, the 1p36 region has been reported to associate with hypertension in a Slavic population isolate from Germany.4 This region has also been previously associated with blood pressure in the NI population,24 suggesting that our current approach has potentially pinpointed the functional loci of this previous linkage hit. It is also interesting to note that migraines have previously been reported to exhibit a higher incidence in the NI population25,40 than in mainland Australia, and MTHFR is a prime functional candidate.
Further evidence of the ability of our approach to identify loci of biological significance is provided by the association between eQTLs and other genes implicated in CVD and related traits. VAV3 (MIM 605541) encodes a guanine nucleotide exchange factor for Rho family GTPases. Vav3-deficient mice have been shown to exhibit tachycardia, systemic arterial hypertension, and extensive cardiovascular remodelling.73,74 The protein product of CYP27A1 (MIM 606530) participates in the degradation of cholesterol to 27-hydroxycholesterol. Macrophages are one of many cells that express CYP27A1, and it has been identified that 27-hydroxycholesterol might counteract the production of inflammatory factors associated with cardiovascular disease.75 CTBP1 (MIM 602618) belongs to a family of genes encoding corepressors that regulate the repression of genes associated with white adipose tissue and can induce the switch to brown adipose tissue.76 Interestingly, white adipose tissue stores energy in the form of triglycerides; in this study, we identified an association between the trans-eQTLs for CTBP1 and triglyceride levels in the NI population. NAAA is involved in the endocannabinoid system, which has been implicated in obesity through its ability to attenuate or lower the desire of finding and consuming food.49,50 Because FN3KRP has been tentatively suggested to associate with diabetes, measurement of FN3K and FN3KRP activity might be of diagnostic value in assessing an individual’s susceptibility to diabetic complications.51,52
In addition, our candidate loci showed significant enrichment in several biologically relevant pathways of interest. Enrichment of NME1 and PAPSS1 in the purine metabolism pathway could represent a shift in ATP-based cellular energetics and function. NME1 encodes the A isoform of nucleoside diphosphate kinase (NDPK), an enzyme that catalyzes the reversible exchange of phosphate between nucleoside diphosphates and nucleoside triphosphates.77,78 This phosphate shuttling maintains the balance between guanosine triphosphate or guanosine diphosphate and ATP or ADP. As a result, changes in NDPK levels driven by enrichment of NME1 could have a significant impact on nucleotide homeostasis and ATP-dependent energy transfer and signaling within cells. PAPSS1 encodes phosphoadenosine phosphosulfate synthetase 1, which synthesizes the ubiquitous sulfate donor phosphoadenosine phosphosulfate (PAPS) from ATP and organic sulfate. PAPS is a substrate used by sulfotransferase to sulfonate metabolites, increasing their solubility to facilitate biliary excretion.79 Therefore, enrichment of both NME1 and PAPSS1 could be indicative of a change in energy management and the regulation of ATP metabolism. ATP plays a key part in cardiac metabolism involved in supporting tissue growth, survival, and contractility. Metabolic remodelling, including changes in both ATP generation and expression of NDPK, is commonly observed in individuals with CVD.80–83 Therefore, shifts in metabolic function such as those indicated by changes in NME1 and PAPSS1 might be indicative of increased CVD risk. We also saw enrichment of NME1 and PRDX1 in the insulin pathway. Insulin release is also dependent on ATP, and enrichment of NME1 could therefore mark a downstream change in insulin secretion as a result of an NDPK-catalyzed rebalance of intracellular ATP levels. PRDX1 encodes peroxiredoxin 1, which is a key scavenger of H2O2.84 H2O2 is known to play a role in both insulin signaling and resistance.85 PRDX1 enrichment might therefore reflect a change in insulin regulation that in combination with a change in NDPK activity might associate with susceptibility to the development of diabetes. Thus, the observed pattern of enrichment of NME1, PAPSS1, and PDRX1 might be a marker for a metabolic rebalance in the NI cohort, possibly indicative of early metabolic dysregulation.
In conclusion, using a pedigree-based approach, we have generated an eQTL map for the NI cohort and have identified potential candidate genomic regions that alter gene expression levels and are at the same time associated with CVD-related traits. We have observed several loci that could underlie CVD risk in NI, and all of them have strongly suggestive biological relevance to disease. We have also broached the idea that several of these could potentially be early markers of metabolic risk within the NI population. Not only do these eQTLs provide insights into potential functional pathways, but our analyses have revealed associations of loci, transcripts, and traits for a specific set of CVD risk factors. We have built upon previous work in the NI cohort and highlight the importance of integrative genomic analyses in identifying genes that play potential roles in the development of complex disorders.
Acknowledgments
This research was supported by funding from a National Health and Medical Research Council of Australia project grant. M.C.B. was supported by a Corbett Postgraduate Research Scholarship, and R.A.L. was partially supported by a Corbett Research and a Griffith University Areas of Strategic Investment for Chronic Disease Fellowship. The SOLAR statistical genetics computer package is supported by a grant from the US National Institute of Mental Health (MH059490). We would like to acknowledge the Research Computing Services team at Griffith University, particularly Amanda Miotto for providing support for this project. Lastly, we extend our appreciation to the Norfolk Islanders who volunteered for this study.
Supplemental Data
Web Resources
The URLs for data presented herein are as follows:
AusDiab (Australian Diabetes, Obesity, and Lifestyle Study) Report 2012, http://www.bakeridi.edu.au/Assets/Files/Baker%20IDI%20Ausdiab%20Report_interactive_FINAL.pdf
AUSDRISK (Australian Diabetes Risk Assessment Tool), http://www.ausdrisk.com.au/
Catalogue of Published Genome-Wide Association Studies, http://www.genome.gov/gwastudies
Online Mendelian Inheritance in Man (OMIM), http://www.omim.org
WebGestalt (WEB-based GEne SeT AnaLysis Toolkit), http://bioinfo.vanderbilt.edu/webgestalt/
References
- 1.Laslett L.J., Alagona P., Jr., Clark B.A., 3rd, Drozda J.P., Jr., Saldivar F., Wilson S.R., Poe C., Hart M. The worldwide environment of cardiovascular disease: prevalence, diagnosis, therapy, and policy issues: a report from the American College of Cardiology. J. Am. Coll. Cardiol. 2012;60(Suppl):S1–S49. doi: 10.1016/j.jacc.2012.11.002. [DOI] [PubMed] [Google Scholar]
- 2.Ridker P.M., Pare G., Parker A., Zee R.Y.L., Danik J.S., Buring J.E., Kwiatkowski D., Cook N.R., Miletich J.P., Chasman D.I. Loci related to metabolic-syndrome pathways including LEPR,HNF1A, IL6R, and GCKR associate with plasma C-reactive protein: the Women’s Genome Health Study. Am. J. Hum. Genet. 2008;82:1185–1192. doi: 10.1016/j.ajhg.2008.03.015. [DOI] [PMC free article] [PubMed] [Google Scholar]
- 3.Zabaneh D., Balding D.J. A genome-wide association study of the metabolic syndrome in Indian Asian men. PLoS ONE. 2010;5:e11961. doi: 10.1371/journal.pone.0011961. [DOI] [PMC free article] [PubMed] [Google Scholar]
- 4.Hoffmann K., Planitz C., Rüschendorf F., Müller-Myhsok B., Stassen H.H., Lucke B., Mattheisen M., Stumvoll M., Bochmann R., Zschornack M. A novel locus for arterial hypertension on chromosome 1p36 maps to a metabolic syndrome trait cluster in the Sorbs, a Slavic population isolate in Germany. J. Hypertens. 2009;27:983–990. doi: 10.1097/HJH.0b013e328328123d. [DOI] [PubMed] [Google Scholar]
- 5.Visscher P.M., Hill W.G., Wray N.R. Heritability in the genomics era—concepts and misconceptions. Nat. Rev. Genet. 2008;9:255–266. doi: 10.1038/nrg2322. [DOI] [PubMed] [Google Scholar]
- 6.Dixon A.L., Liang L., Moffatt M.F., Chen W., Heath S., Wong K.C.C., Taylor J., Burnett E., Gut I., Farrall M. A genome-wide association study of global gene expression. Nat. Genet. 2007;39:1202–1207. doi: 10.1038/ng2109. [DOI] [PubMed] [Google Scholar]
- 7.Göring H.H.H., Curran J.E., Johnson M.P., Dyer T.D., Charlesworth J., Cole S.A., Jowett J.B.M., Abraham L.J., Rainwater D.L., Comuzzie A.G. Discovery of expression QTLs using large-scale transcriptional profiling in human lymphocytes. Nat. Genet. 2007;39:1208–1216. doi: 10.1038/ng2119. [DOI] [PubMed] [Google Scholar]
- 8.Grieve I.C., Dickens N.J., Pravenec M., Kren V., Hubner N., Cook S.A., Aitman T.J., Petretto E., Mangion J. Genome-wide co-expression analysis in multiple tissues. PLoS ONE. 2008;3:e4033. doi: 10.1371/journal.pone.0004033. [DOI] [PMC free article] [PubMed] [Google Scholar]
- 9.Petretto E., Mangion J., Dickens N.J., Cook S.A., Kumaran M.K., Lu H., Fischer J., Maatz H., Kren V., Pravenec M. Heritability and tissue specificity of expression quantitative trait loci. PLoS Genet. 2006;2:e172. doi: 10.1371/journal.pgen.0020172. [DOI] [PMC free article] [PubMed] [Google Scholar]
- 10.Hernandez D.G., Nalls M.A., Moore M., Chong S., Dillman A., Trabzuni D., Gibbs J.R., Ryten M., Arepalli S., Weale M.E. Integration of GWAS SNPs and tissue specific expression profiling reveal discrete eQTLs for human traits in blood and brain. Neurobiol. Dis. 2012;47:20–28. doi: 10.1016/j.nbd.2012.03.020. [DOI] [PMC free article] [PubMed] [Google Scholar]
- 11.Powell J.E., Henders A.K., McRae A.F., Caracella A., Smith S., Wright M.J., Whitfield J.B., Dermitzakis E.T., Martin N.G., Visscher P.M., Montgomery G.W. The Brisbane Systems Genetics Study: genetical genomics meets complex trait genetics. PLoS ONE. 2012;7:e35430. doi: 10.1371/journal.pone.0035430. [DOI] [PMC free article] [PubMed] [Google Scholar]
- 12.Bushel P.R., McGovern R., Liu L., Hofmann O., Huda A., Lu J., Hide W., Lin X. Population differences in transcript-regulator expression quantitative trait loci. PLoS ONE. 2012;7:e34286. doi: 10.1371/journal.pone.0034286. [DOI] [PMC free article] [PubMed] [Google Scholar]
- 13.Innocenti F., Cooper G.M., Stanaway I.B., Gamazon E.R., Smith J.D., Mirkov S., Ramirez J., Liu W., Lin Y.S., Moloney C. Identification, replication, and functional fine-mapping of expression quantitative trait loci in primary human liver tissue. PLoS Genet. 2011;7:e1002078. doi: 10.1371/journal.pgen.1002078. [DOI] [PMC free article] [PubMed] [Google Scholar]
- 14.Degnan J.H., Lasky-Su J., Raby B.A., Xu M., Molony C., Schadt E.E., Lange C. Genomics and genome-wide association studies: an integrative approach to expression QTL mapping. Genomics. 2008;92:129–133. doi: 10.1016/j.ygeno.2008.05.012. [DOI] [PMC free article] [PubMed] [Google Scholar]
- 15.Peltonen L., Palotie A., Lange K. Use of population isolates for mapping complex traits. Nat. Rev. Genet. 2000;1:182–190. doi: 10.1038/35042049. [DOI] [PubMed] [Google Scholar]
- 16.Garagnani P., Laayouni H., González-Neira A., Sikora M., Luiselli D., Bertranpetit J., Calafell F. Isolated populations as treasure troves in genetic epidemiology: the case of the Basques. Eur. J. Hum. Genet. 2009;17:1490–1494. doi: 10.1038/ejhg.2009.69. [DOI] [PMC free article] [PubMed] [Google Scholar]
- 17.Varilo T., Peltonen L. Isolates and their potential use in complex gene mapping efforts. Curr. Opin. Genet. Dev. 2004;14:316–323. doi: 10.1016/j.gde.2004.04.008. [DOI] [PubMed] [Google Scholar]
- 18.Edgecombe J. J.M. Edgecombe; Thornleigh: 1999. Norfolk Island - South Pacific: Island of History and Many Delights. [Google Scholar]
- 19.Hoare M. Central Queensland University Press; Rockhampton: 1999. Norfolk Island: A Revised and Enlarged History 1774-1998. [Google Scholar]
- 20.Macgregor S., Bellis C., Lea R.A., Cox H., Dyer T., Blangero J., Visscher P.M., Griffiths L.R. Legacy of mutiny on the Bounty: founder effect and admixture on Norfolk Island. Eur. J. Hum. Genet. 2010;18:67–72. doi: 10.1038/ejhg.2009.111. [DOI] [PMC free article] [PubMed] [Google Scholar]
- 21.McEvoy B.P., Zhao Z.Z., Macgregor S., Bellis C., Lea R.A., Cox H., Montgomery G.W., Griffiths L.R., Visscher P.M. European and Polynesian admixture in the Norfolk Island population. Heredity (Edinb) 2010;105:229–234. doi: 10.1038/hdy.2009.175. [DOI] [PubMed] [Google Scholar]
- 22.Cox H.C., Bellis C., Lea R.A., Quinlan S., Hughes R., Dyer T., Charlesworth J., Blangero J., Griffiths L.R. Principal component and linkage analysis of cardiovascular risk traits in the Norfolk isolate. Hum. Hered. 2009;68:55–64. doi: 10.1159/000210449. [DOI] [PMC free article] [PubMed] [Google Scholar]
- 23.Bellis C., Cox H.C., Ovcaric M., Begley K.N., Lea R.A., Quinlan S., Burgner D., Heath S.C., Blangero J., Griffiths L.R. Linkage disequilibrium analysis in the genetically isolated Norfolk Island population. Heredity (Edinb) 2008;100:366–373. doi: 10.1038/sj.hdy.6801083. [DOI] [PubMed] [Google Scholar]
- 24.Bellis C., Cox H.C., Dyer T.D., Charlesworth J.C., Begley K.N., Quinlan S., Lea R.A., Heath S.C., Blangero J., Griffiths L.R. Linkage mapping of CVD risk traits in the isolated Norfolk Island population. Hum. Genet. 2008;124:543–552. doi: 10.1007/s00439-008-0580-y. [DOI] [PMC free article] [PubMed] [Google Scholar]
- 25.Maher B.H., Lea R.A., Benton M., Cox H.C., Bellis C., Carless M., Dyer T.D., Curran J., Charlesworth J.C., Buring J.E. An X chromosome association scan of the Norfolk Island genetic isolate provides evidence for a novel migraine susceptibility locus at Xq12. PLoS ONE. 2012;7:e37903. doi: 10.1371/journal.pone.0037903. [DOI] [PMC free article] [PubMed] [Google Scholar]
- 26.Bellis C., Hughes R.M., Begley K.N., Quinlan S., Lea R.A., Heath S.C., Blangero J., Griffiths L.R. Phenotypical characterisation of the isolated norfolk island population focusing on epidemiological indicators of cardiovascular disease. Hum. Hered. 2005;60:211–219. doi: 10.1159/000090545. [DOI] [PubMed] [Google Scholar]
- 27.R Development Core Team (2008). R: A language and environment for statistical computing. R Foundation for Statistical Computing, Vienna. ISBN 3-900051-07-0, http://www.R-project.org.
- 28.Eckel R.H., Alberti K.G., Grundy S.M., Zimmet P.Z. The metabolic syndrome. Lancet. 2010;375:181–183. doi: 10.1016/S0140-6736(09)61794-3. [DOI] [PubMed] [Google Scholar]
- 29.Chen L., Magliano D.J., Balkau B., Colagiuri S., Zimmet P.Z., Tonkin A.M., Mitchell P., Phillips P.J., Shaw J.E. AUSDRISK: an Australian Type 2 Diabetes Risk Assessment Tool based on demographic, lifestyle and simple anthropometric measures. Med. J. Aust. 2010;192:197–202. doi: 10.5694/j.1326-5377.2010.tb03507.x. [DOI] [PubMed] [Google Scholar]
- 30.Bannink L., Wells S., Broad J., Riddell T., Jackson R. Web-based assessment of cardiovascular disease risk in routine primary care practice in New Zealand: the first 18,000 patients (PREDICT CVD-1) N. Z. Med. J. 2006;119:U2313. [PubMed] [Google Scholar]
- 31.Scharpf R.B., Irizarry R.A., Ritchie M.E., Carvalho B., Ruczinski I. Using the R Package crlmm for Genotyping and Copy Number Estimation. J. Stat. Softw. 2011;40:1–32. [PMC free article] [PubMed] [Google Scholar]
- 32.Purcell S., Neale B., Todd-Brown K., Thomas L., Ferreira M.A.R., Bender D., Maller J., Sklar P., de Bakker P.I.W., Daly M.J., Sham P.C. PLINK: a tool set for whole-genome association and population-based linkage analyses. Am. J. Hum. Genet. 2007;81:559–575. doi: 10.1086/519795. [DOI] [PMC free article] [PubMed] [Google Scholar]
- 33.Aulchenko Y.S., Ripke S., Isaacs A., van Duijn C.M. GenABEL: an R library for genome-wide association analysis. Bioinformatics. 2007;23:1294–1296. doi: 10.1093/bioinformatics/btm108. [DOI] [PubMed] [Google Scholar]
- 34.Almasy L., Blangero J. Multipoint quantitative-trait linkage analysis in general pedigrees. Am. J. Hum. Genet. 1998;62:1198–1211. doi: 10.1086/301844. [DOI] [PMC free article] [PubMed] [Google Scholar]
- 35.Manichaikul A., Mychaleckyj J.C., Rich S.S., Daly K., Sale M., Chen W.M. Robust relationship inference in genome-wide association studies. Bioinformatics. 2010;26:2867–2873. doi: 10.1093/bioinformatics/btq559. [DOI] [PMC free article] [PubMed] [Google Scholar]
- 36.Hindorff L.A., Sethupathy P., Junkins H.A., Ramos E.M., Mehta J.P., Collins F.S., Manolio T.A. Potential etiologic and functional implications of genome-wide association loci for human diseases and traits. Proc. Natl. Acad. Sci. USA. 2009;106:9362–9367. doi: 10.1073/pnas.0903103106. [DOI] [PMC free article] [PubMed] [Google Scholar]
- 37.Alberti K.G., Eckel R.H., Grundy S.M., Zimmet P.Z., Cleeman J.I., Donato K.A., Fruchart J.C., James W.P., Loria C.M., Smith S.C., Jr., International Diabetes Federation Task Force on Epidemiology and Prevention. Hational Heart, Lung, and Blood Institute. American Heart Association. World Heart Federation. International Atherosclerosis Society. International Association for the Study of Obesity Harmonizing the metabolic syndrome: a joint interim statement of the International Diabetes Federation Task Force on Epidemiology and Prevention; National Heart, Lung, and Blood Institute; American Heart Association; World Heart Federation; International Atherosclerosis Society; and International Association for the Study of Obesity. Circulation. 2009;120:1640–1645. doi: 10.1161/CIRCULATIONAHA.109.192644. [DOI] [PubMed] [Google Scholar]
- 38.Cameron A.J., Magliano D.J., Zimmet P.Z., Welborn T., Shaw J.E. The metabolic syndrome in Australia: prevalence using four definitions. Diabetes Res. Clin. Pract. 2007;77:471–478. doi: 10.1016/j.diabres.2007.02.002. [DOI] [PubMed] [Google Scholar]
- 39.Fox C.S., Liu Y., White C.C., Feitosa M., Smith A.V., Heard-Costa N., Lohman K., Johnson A.D., Foster M.C., Greenawalt D.M., GIANT Consortium. MAGIC Consortium. GLGC Consortium Genome-wide association for abdominal subcutaneous and visceral adipose reveals a novel locus for visceral fat in women. PLoS Genet. 2012;8:e1002695. doi: 10.1371/journal.pgen.1002695. [DOI] [PMC free article] [PubMed] [Google Scholar]
- 40.Cox H.C., Lea R.A., Bellis C., Nyholt D.R., Dyer T.D., Haupt L.M., Charlesworth J., Matovinovic E., Blangero J., Griffiths L.R. Heritability and genome-wide linkage analysis of migraine in the genetic isolate of Norfolk Island. Gene. 2012;494:119–123. doi: 10.1016/j.gene.2011.11.056. [DOI] [PMC free article] [PubMed] [Google Scholar]
- 41.Siebert P.D., Fukuda M. Molecular cloning of a human glycophorin B cDNA: nucleotide sequence and genomic relationship to glycophorin A. Proc. Natl. Acad. Sci. USA. 1987;84:6735–6739. doi: 10.1073/pnas.84.19.6735. [DOI] [PMC free article] [PubMed] [Google Scholar]
- 42.Pritlove D.C., Gu M., Boyd C.A.R., Randeva H.S., Vatish M. Novel placental expression of 2,3-bisphosphoglycerate mutase. Placenta. 2006;27:924–927. doi: 10.1016/j.placenta.2005.08.010. [DOI] [PubMed] [Google Scholar]
- 43.Price A.L., Helgason A., Thorleifsson G., McCarroll S.A., Kong A., Stefansson K. Single-tissue and cross-tissue heritability of gene expression via identity-by-descent in related or unrelated individuals. PLoS Genet. 2011;7:e1001317. doi: 10.1371/journal.pgen.1001317. [DOI] [PMC free article] [PubMed] [Google Scholar]
- 44.Nicolae D.L., Gamazon E., Zhang W., Duan S., Dolan M.E., Cox N.J. Trait-associated SNPs are more likely to be eQTLs: annotation to enhance discovery from GWAS. PLoS Genet. 2010;6:e1000888. doi: 10.1371/journal.pgen.1000888. [DOI] [PMC free article] [PubMed] [Google Scholar]
- 45.Nica A.C., Montgomery S.B., Dimas A.S., Stranger B.E., Beazley C., Barroso I., Dermitzakis E.T. Candidate causal regulatory effects by integration of expression QTLs with complex trait genetic associations. PLoS Genet. 2010;6:e1000895. doi: 10.1371/journal.pgen.1000895. [DOI] [PMC free article] [PubMed] [Google Scholar]
- 46.Zhang B., Kirov S., Snoddy J. WebGestalt: an integrated system for exploring gene sets in various biological contexts. Nucleic Acids Res. 2005;33(Web Server issue):W741–W748. doi: 10.1093/nar/gki475. [DOI] [PMC free article] [PubMed] [Google Scholar]
- 47.Nyhan W.L. Disorders of purine and pyrimidine metabolism. Mol. Genet. Metab. 2005;86:25–33. doi: 10.1016/j.ymgme.2005.07.027. [DOI] [PubMed] [Google Scholar]
- 48.Franceschini A., Szklarczyk D., Frankild S., Kuhn M., Simonovic M., Roth A., Lin J., Minguez P., Bork P., von Mering C., Jensen L.J. STRING v9.1: protein-protein interaction networks, with increased coverage and integration. Nucleic Acids Res. 2013;41(Database issue):D808–D815. doi: 10.1093/nar/gks1094. [DOI] [PMC free article] [PubMed] [Google Scholar]
- 49.Di Marzo V., Bifulco M., De Petrocellis L. The endocannabinoid system and its therapeutic exploitation. Nat. Rev. Drug Discov. 2004;3:771–784. doi: 10.1038/nrd1495. [DOI] [PubMed] [Google Scholar]
- 50.Van Gaal L.F., Rissanen A.M., Scheen A.J., Ziegler O., Rössner S., RIO-Europe Study Group Effects of the cannabinoid-1 receptor blocker rimonabant on weight reduction and cardiovascular risk factors in overweight patients: 1-year experience from the RIO-Europe study. Lancet. 2005;365:1389–1397. doi: 10.1016/S0140-6736(05)66374-X. [DOI] [PubMed] [Google Scholar]
- 51.Payne L.S., Brown P.M., Middleditch M., Baker E., Cooper G.J., Loomes K.M. Mapping of the ATP-binding domain of human fructosamine 3-kinase-related protein by affinity labelling with 5′-[p-(fluorosulfonyl)benzoyl]adenosine. Biochem. J. 2008;416:281–288. doi: 10.1042/BJ20080389. [DOI] [PubMed] [Google Scholar]
- 52.Szwergold B.S. Fructosamine-6-phosphates are deglycated by phosphorylation to fructosamine-3,6-bisphosphates catalyzed by fructosamine-3-kinase (FN3K) and/or fructosamine-3-kinase-related-protein (FN3KRP) Med. Hypotheses. 2007;68:37–45. doi: 10.1016/j.mehy.2006.06.030. [DOI] [PubMed] [Google Scholar]
- 53.Soranzo N., Sanna S., Wheeler E., Gieger C., Radke D., Dupuis J., Bouatia-Naji N., Langenberg C., Prokopenko I., Stolerman E., WTCCC Common variants at 10 genomic loci influence hemoglobin A1(C) levels via glycemic and nonglycemic pathways. Diabetes. 2010;59:3229–3239. doi: 10.2337/db10-0502. [DOI] [PMC free article] [PubMed] [Google Scholar]
- 54.Newton-Cheh C., Johnson T., Gateva V., Tobin M.D., Bochud M., Coin L., Najjar S.S., Zhao J.H., Heath S.C., Eyheramendy S., Wellcome Trust Case Control Consortium Genome-wide association study identifies eight loci associated with blood pressure. Nat. Genet. 2009;41:666–676. doi: 10.1038/ng.361. [DOI] [PMC free article] [PubMed] [Google Scholar]
- 55.Wain L.V., Verwoert G.C., O’Reilly P.F., Shi G., Johnson T., Johnson A.D., Bochud M., Rice K.M., Henneman P., Smith A.V., LifeLines Cohort Study. EchoGen consortium. AortaGen Consortium. CHARGE Consortium Heart Failure Working Group. KidneyGen consortium. CKDGen consortium. Cardiogenics consortium. CardioGram Genome-wide association study identifies six new loci influencing pulse pressure and mean arterial pressure. Nat. Genet. 2011;43:1005–1011. doi: 10.1038/ng.922. [DOI] [PMC free article] [PubMed] [Google Scholar]
- 56.Kato N., Takeuchi F., Tabara Y., Kelly T.N., Go M.J., Sim X., Tay W.T., Chen C.-H., Zhang Y., Yamamoto K. Meta-analysis of genome-wide association studies identifies common variants associated with blood pressure variation in east Asians. Nat. Genet. 2011;43:531–538. doi: 10.1038/ng.834. [DOI] [PMC free article] [PubMed] [Google Scholar]
- 57.Qian X., Lu Z., Tan M., Liu H., Lu D. A meta-analysis of association between C677T polymorphism in the methylenetetrahydrofolate reductase gene and hypertension. Eur. J. Hum. Genet. 2007;15:1239–1245. doi: 10.1038/sj.ejhg.5201914. [DOI] [PubMed] [Google Scholar]
- 58.Lowe J.K., Maller J.B., Pe’er I., Neale B.M., Salit J., Kenny E.E., Shea J.L., Burkhardt R., Smith J.G., Ji W. Genome-wide association studies in an isolated founder population from the Pacific Island of Kosrae. PLoS Genet. 2009;5:e1000365. doi: 10.1371/journal.pgen.1000365. [DOI] [PMC free article] [PubMed] [Google Scholar]
- 59.Sanna S., Li B., Mulas A., Sidore C., Kang H.M., Jackson A.U., Piras M.G., Usala G., Maninchedda G., Sassu A. Fine mapping of five loci associated with low-density lipoprotein cholesterol detects variants that double the explained heritability. PLoS Genet. 2011;7:e1002198. doi: 10.1371/journal.pgen.1002198. [DOI] [PMC free article] [PubMed] [Google Scholar]
- 60.Gerrits A., Li Y., Tesson B.M., Bystrykh L.V., Weersing E., Ausema A., Dontje B., Wang X., Breitling R., Jansen R.C., de Haan G. Expression quantitative trait loci are highly sensitive to cellular differentiation state. PLoS Genet. 2009;5:e1000692. doi: 10.1371/journal.pgen.1000692. [DOI] [PMC free article] [PubMed] [Google Scholar]
- 61.Powell J.E., Henders A.K., McRae A.F., Wright M.J., Martin N.G., Dermitzakis E.T., Montgomery G.W., Visscher P.M. Genetic control of gene expression in whole blood and lymphoblastoid cell lines is largely independent. Genome Res. 2012;22:456–466. doi: 10.1101/gr.126540.111. [DOI] [PMC free article] [PubMed] [Google Scholar]
- 62.Bullaughey K., Chavarria C.I., Coop G., Gilad Y. Expression quantitative trait loci detected in cell lines are often present in primary tissues. Hum. Mol. Genet. 2009;18:4296–4303. doi: 10.1093/hmg/ddp382. [DOI] [PMC free article] [PubMed] [Google Scholar]
- 63.Nath A.P., Arafat D., Gibson G. Using blood informative transcripts in geographical genomics: impact of lifestyle on gene expression in fijians. Front. Genet. 2012;3:243. doi: 10.3389/fgene.2012.00243. [DOI] [PMC free article] [PubMed] [Google Scholar]
- 64.Garnier S., Truong V., Brocheton J., Zeller T., Rovital M., Wild P.S., Ziegler A., Munzel T., Tiret L., Blankenberg S., Cardiogenics Consortium Genome-wide haplotype analysis of cis expression quantitative trait loci in monocytes. PLoS Genet. 2013;9:e1003240. doi: 10.1371/journal.pgen.1003240. [DOI] [PMC free article] [PubMed] [Google Scholar]
- 65.Meyre D., Delplanque J., Chèvre J.-C., Lecoeur C., Lobbens S., Gallina S., Durand E., Vatin V., Degraeve F., Proença C. Genome-wide association study for early-onset and morbid adult obesity identifies three new risk loci in European populations. Nat. Genet. 2009;41:157–159. doi: 10.1038/ng.301. [DOI] [PubMed] [Google Scholar]
- 66.Paré G., Chasman D.I., Parker A.N., Zee R.R.Y., Mälarstig A., Seedorf U., Collins R., Watkins H., Hamsten A., Miletich J.P., Ridker P.M. Novel associations of CPS1, MUT, NOX4, and DPEP1 with plasma homocysteine in a healthy population: a genome-wide evaluation of 13 974 participants in the Women’s Genome Health Study. Circ Cardiovasc Genet. 2009;2:142–150. doi: 10.1161/CIRCGENETICS.108.829804. [DOI] [PMC free article] [PubMed] [Google Scholar]
- 67.Goyette P., Sumner J.S., Milos R., Duncan A.M., Rosenblatt D.S., Matthews R.G., Rozen R. Human methylenetetrahydrofolate reductase: isolation of cDNA, mapping and mutation identification. Nat. Genet. 1994;7:195–200. doi: 10.1038/ng0694-195. [DOI] [PubMed] [Google Scholar]
- 68.Huo Y., Zou H., Lang M., Ji S.-X., Yin X.-L., Zheng Z., Liu W., Chen C.-L., Yuan R.-D., Ye J. Association between MTHFR C677T polymorphism and primary open-angle glaucoma: a meta-analysis. Gene. 2013;512:179–184. doi: 10.1016/j.gene.2012.10.067. [DOI] [PubMed] [Google Scholar]
- 69.Christensen B., Arbour L., Tran P., Leclerc D., Sabbaghian N., Platt R., Gilfix B.M., Rosenblatt D.S., Gravel R.A., Forbes P., Rozen R. Genetic polymorphisms in methylenetetrahydrofolate reductase and methionine synthase, folate levels in red blood cells, and risk of neural tube defects. Am. J. Med. Genet. 1999;84:151–157. doi: 10.1002/(sici)1096-8628(19990521)84:2<151::aid-ajmg12>3.0.co;2-t. [DOI] [PubMed] [Google Scholar]
- 70.Mornet E., Muller F., Lenvoisé-Furet A., Delezoide A.-L., Col J.-Y., Simon-Bouy B., Serre J.-L. Screening of the C677T mutation on the methylenetetrahydrofolate reductase gene in French patients with neural tube defects. Hum. Genet. 1997;100:512–514. doi: 10.1007/s004390050544. [DOI] [PubMed] [Google Scholar]
- 71.Oterino A., Valle N., Bravo Y., Muñoz P., Sánchez-Velasco P., Ruiz-Alegría C., Castillo J., Leyva-Cobián F., Vadillo A., Pascual J. MTHFR T677 homozygosis influences the presence of aura in migraineurs. Cephalalgia. 2004;24:491–494. doi: 10.1111/j.1468-2982.2004.00692.x. [DOI] [PubMed] [Google Scholar]
- 72.Scher A.I., Terwindt G.M., Verschuren W.M.M., Kruit M.C., Blom H.J., Kowa H., Frants R.R., van den Maagdenberg A.M.J.M., van Buchem M., Ferrari M.D., Launer L.J. Migraine and MTHFR C677T genotype in a population-based sample. Ann. Neurol. 2006;59:372–375. doi: 10.1002/ana.20755. [DOI] [PubMed] [Google Scholar]
- 73.Sauzeau V., Sevilla M.A., Rivas-Elena J.V., de Alava E., Montero M.J., López-Novoa J.M., Bustelo X.R. Vav3 proto-oncogene deficiency leads to sympathetic hyperactivity and cardiovascular dysfunction. Nat. Med. 2006;12:841–845. doi: 10.1038/nm1426. [DOI] [PMC free article] [PubMed] [Google Scholar]
- 74.Sauzeau V., Carvajal-González J.M., Riolobos A.S., Sevilla M.A., Menacho-Márquez M., Román A.C., Abad A., Montero M.J., Fernández-Salguero P., Bustelo X.R. Transcriptional factor aryl hydrocarbon receptor (Ahr) controls cardiovascular and respiratory functions by regulating the expression of the Vav3 proto-oncogene. J. Biol. Chem. 2011;286:2896–2909. doi: 10.1074/jbc.M110.187534. [DOI] [PMC free article] [PubMed] [Google Scholar]
- 75.Taylor J.M.W., Borthwick F., Bartholomew C., Graham A. Overexpression of steroidogenic acute regulatory protein increases macrophage cholesterol efflux to apolipoprotein AI. Cardiovasc. Res. 2010;86:526–534. doi: 10.1093/cvr/cvq015. [DOI] [PubMed] [Google Scholar]
- 76.Vernochet C., Peres S.B., Davis K.E., McDonald M.E., Qiang L., Wang H., Scherer P.E., Farmer S.R. C/EBPalpha and the corepressors CtBP1 and CtBP2 regulate repression of select visceral white adipose genes during induction of the brown phenotype in white adipocytes by peroxisome proliferator-activated receptor gamma agonists. Mol. Cell. Biol. 2009;29:4714–4728. doi: 10.1128/MCB.01899-08. [DOI] [PMC free article] [PubMed] [Google Scholar]
- 77.Boissan M., Dabernat S., Peuchant E., Schlattner U., Lascu I., Lacombe M.-L. The mammalian Nm23/NDPK family: from metastasis control to cilia movement. Mol. Cell. Biochem. 2009;329:51–62. doi: 10.1007/s11010-009-0120-7. [DOI] [PubMed] [Google Scholar]
- 78.Dzeja P.P., Terzic A. Phosphotransfer networks and cellular energetics. J. Exp. Biol. 2003;206:2039–2047. doi: 10.1242/jeb.00426. [DOI] [PubMed] [Google Scholar]
- 79.Lindsay J., Wang L.-L., Li Y., Zhou S.-F. Structure, function and polymorphism of human cytosolic sulfotransferases. Curr. Drug Metab. 2008;9:99–105. doi: 10.2174/138920008783571819. [DOI] [PubMed] [Google Scholar]
- 80.Lutz S., Hippe H.-J., Niroomand F., Wieland T. Nucleoside diphosphate kinase-mediated activation of heterotrimeric G proteins. Methods Enzymol. 2004;390:403–418. doi: 10.1016/S0076-6879(04)90025-0. [DOI] [PubMed] [Google Scholar]
- 81.Hippe H.-J., Luedde M., Lutz S., Koehler H., Eschenhagen T., Frey N., Katus H.A., Wieland T., Niroomand F. Regulation of cardiac cAMP synthesis and contractility by nucleoside diphosphate kinase B/G protein beta gamma dimer complexes. Circ. Res. 2007;100:1191–1199. doi: 10.1161/01.RES.0000264058.28808.cc. [DOI] [PubMed] [Google Scholar]
- 82.Doenst T., Nguyen T.D., Abel E.D. Cardiac metabolism in heart failure: implications beyond ATP production. Circ. Res. 2013;113:709–724. doi: 10.1161/CIRCRESAHA.113.300376. [DOI] [PMC free article] [PubMed] [Google Scholar]
- 83.Kolwicz S.C., Jr., Purohit S., Tian R. Cardiac metabolism and its interactions with contraction, growth, and survival of cardiomyocytes. Circ. Res. 2013;113:603–616. doi: 10.1161/CIRCRESAHA.113.302095. [DOI] [PMC free article] [PubMed] [Google Scholar]
- 84.Neumann C.A., Cao J., Manevich Y. Peroxiredoxin 1 and its role in cell signaling. Cell Cycle. 2009;8:4072–4078. doi: 10.4161/cc.8.24.10242. [DOI] [PMC free article] [PubMed] [Google Scholar]
- 85.Tiganis T. Reactive oxygen species and insulin resistance: the good, the bad and the ugly. Trends Pharmacol. Sci. 2011;32:82–89. doi: 10.1016/j.tips.2010.11.006. [DOI] [PubMed] [Google Scholar]
Associated Data
This section collects any data citations, data availability statements, or supplementary materials included in this article.