Abstract
Background
In this study, we developed a pharmacokinetic (PK)- pharmacodynamic (PD) model of a new sustained release formulation of interferon-α-2a (SR-IFN-α) using the blood concentration of IFN-α and neopterin in order to quantify the magnitude and saturation of neopterin production over time in healthy volunteers. The SR-IFN-α in this study is a solid microparticular formulation manufactured by spray drying of a feeding solution containing IFN-α, a biocompatible polymer (polyethylene glycol) and sodium hyaluronate.
Methods
The full PK and PD (neopterin concentration) datasets from 24 healthy subjects obtained after single doses of 9, 18, 27 and 36 MIU of subcutaneous SR-IFN-α were used to build the mixed-effect model using NONMEM (version 7.2) with the GFORTRAN compiler.
Results
A one-compartment model with first-order elimination and a mixture of zero- and first-order absorption was chosen to describe the PK of SR-IFN-α. The time-concentration profile of neopterin, the PD marker, was described by a turnover model combined with a single transit compartment. The saturable pattern of the neopterin response blurring the dose–response relationship of SR-IFN-α was addressed by introducing the concept of the EC50 increasing over time.
Conclusions
The PK-PD model of SR-IFN-α developed in this study has presented a quantitative tool to assess the time-course of a saturable neopterin response in humans.
Keywords: PK-PD modeling, IFN-α, NONMEM, Neopterin
Background
Interferons are produced by peripheral blood leukocytes, fibroblasts, and activated T and NK cells in response to viral infection or other inducers including double-stranded RNA, lipopolysaccharide, micro-organisms, or endotoxins [1-3]. Based on immunological and physicochemical differences, human interferons are divided into α-, β-, and γ-interferon families, with numerous subtypes within each interferon family [4]. Because of its antiviral, antiproliferative and immunomodulating properties, recombinant interferon-α (IFN-α) has been used as a treatment for various diseases [5]. However, in the case of chronic hepatitis C, monotherapy with IFN-α has been persistently effective in only a small percentage of patients [6]. This low response rate is thought to be due to HCV genotype variation and/or the quite short half-life of IFN-α [7,8]. Combination therapy with other antiviral agents, such as ribavirin, is therefore recommended [9]. Frequent administration (3 times weekly) of IFN-α has been considered to be an additional cause for therapeutic failure of interferon due to the fact that frequent administration accelerates the formation of neutralizing antibodies and causes other adverse effects due to large variations in peak-to-trough plasma drug concentrations [10,11]. Hence, a long-acting formulation has been developed for IFN-α which can extend its effects to weeks and months.
Unlike small molecule drugs, the poor stability of protein drugs has been a hurdle to the development of long acting formulations [12]. Technologies for producing long-acting formulations of protein drugs can be roughly classified into chemical modification such as pegylation [13] or formulation changes allowing delayed release from depot sites. The new sustained release formulation of IFN-α-2a (SR-IFN-α, LG Life Sciences) used in our report is a solid microparticular formulation manufactured by the spray drying of a feeding solution containing IFN-α, a biocompatible polymer (polyethylene glycol) and sodium hyaluronate [14].
This report is based upon a first-in-human, single ascending dose trial of SR-IFN-α in healthy volunteers where the IFN-α concentration profile showed an extended release pattern through the doses studied. Blood neopterin concentrations were also measured as a biomarker demonstrating the activity of IFN-α in this first-in-human study. Neopterin is a soluble immune activation marker released from monocytes and macrophages by IFN-α [15]. Looking into the relationship between the exposure to IFN-α and neopterin in the healthy subjects’ data, we found that the magnitude of neopterin concentration changes was not clearly correlated with the dose of IFN-α. Although similar phenomena have been observed in animal experiments [16,17], this has never been reported in humans despite frequent clinical trials using neopterin as a biomarker. Because clear understanding of the relationship between exposure and response is one of the fundamental goals of early-phase exploratory clinical trials, we investigated the concentration-response relationship of IFN-α and neopterin in humans, which has never been elucidated. As results, we present a pharmacokinetic-pharmacodynamic (PK-PD) model that quantifies the peculiar time-course of neopterin responses to IFN-α in humans.
Methods
Inclusion and exclusion criteria
Healthy volunteers aged 18 to 45 years with BMI ranging from 19 to 29 kg/m2, with no clinically relevant conditions identified based on medical history, physical examination, laboratory tests or electrocardiography (ECG), were eligible for inclusion. Subjects with any history that indicated a possible alteration in IFN-α metabolism or with hypersensitivity to IFN-α were excluded. The final study enrollment was 32 subjects (Table 1).
Table 1.
Subject demographicsa
| Group | Control | 1 | 2 | 3 | 4 |
|---|---|---|---|---|---|
| Dose |
3 MIU |
9 MIU |
18 MIU |
27 MIU |
36 MIU |
| Number of Subjects |
8 |
6 |
6 |
6 |
6 |
| Sex |
Male |
Male |
Male |
Male |
Male |
| Age (years) |
24.0 (18 ~ 43) |
21.5 (19 ~ 37) |
22 (19 ~ 34) |
22 (18 ~ 42) |
24 (20 ~ 43) |
| Height (cm) |
181.65 (165.5 ~ 189.0) |
179.05 (171.0 ~ 191.5) |
183.5 (172.0 ~ 187.0) |
178.15 (168.0 ~ 191.5) |
181.75 (178.0 ~ 193.0) |
| Weight (kg) | 73.85 (69.0 ~ 82.2) | 78.65 (60.3 ~ 92.4) | 76.15 (63.0 ~ 86.5) | 74.40 (53.8 ~ 92.6) | 74.40 (70.7 ~ 98.8) |
aContinuous variables are shown as median (range).
Study design
A randomized, double-blind, active controlled, dose escalation phase I clinical study was conducted on 32 healthy subjects in the clinical pharmacology unit of the Kendle International BV, located in Utrecht, Netherlands. Subjects were randomly allocated into four groups (eight subjects per group). Within each group, six were given SR-IFN-α (test formulation) and the other two were given 3 MIU Roferon-A® (Roche, active comparator) via subcutaneous injection. The doses of SR-IFN-α allocated to groups 1, 2, 3 and 4 were 9 MIU, 18 MIU, 27 MIU, and 36 MIU, respectively.
The study was performed in compliance with the European Community rules of Good Clinical Practice (GCP), the International Conference on Harmonization (ICH) Tripartite Guidelines: Guideline for GCP, the current revision of the 'Declaration of Helsinki’ (Edinburgh, amendment October 2000). The Stichting Therapeutische Evaluatie Geneesmiddelen (STEG), an independent ethics committee, approved the protocol before execution of the trial, and all participants gave written informed consent.
Blood sampling
For the population PK analysis, peripheral blood samples (5 mL each) were taken just prior to the injection, and 0.75, 1.5, 3, 6, 8, 10, 12, 18, 24, 30, 36, 48, 60, 72, 96, 120, 144, 168, and 192 hours after the injection. For the PD marker, the sampling times differed slightly: just prior to the injection and 3, 8, 12, 18, 24, 36, 48, 72, 96, 120, 144, 168, 192, and 264 hours after the injection. The samples were collected in light-protective tubes and stored at < -70°C.
Assay of plasma concentrations of IFN-α and neopterin
IFN-α concentrations in the serum samples were analyzed using a commercial Human IFN-α Multi-Subtype ELISA Kit (product # 41105) with a detection limit of 12.5 pg/mL manufactured by Pestka Biomedical Laboratories, Inc. (Piscataway, NJ, USA). Neopterin concentrations in the serum samples were analyzed using a commercially-available Neopterin ELISA method (REF 40-371-25012, GenWay Biotech, Inc., San Diego, CA, USA) with a detection limit of 0.7 nmol/L and the specificity of about 99.95%.
Population PK-PD model
Because the aim of this study was to develop a PK-PD model for SR-IFN-α, data from the active control group participants, who were given the immediate release IFN-α formulation (8 subjects), were not included in the analysis (individual plots for PK-PD models are shown in Additional file 1).
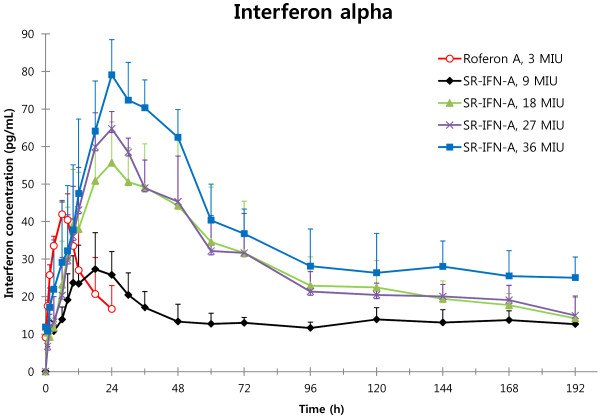
Mean plasma concentrations of IFN-α are shown in Figure 1, and non-compartmental analysis results of the PK of SR-IFN-α are summarized in Table 2. The population PK-PD analysis was performed using NONMEM (version 7.2, Icon Development Solutions, Ellicott City, MD, USA) with the GFORTRAN compiler.
Figure 1.
Plasma concentration–time curves of interferon-α (Mean and S.D.).
Table 2.
Non-compartmental analysis of interferon-α: Mean ± S.D. (CV%)
| Group | Dose | Formulation | Cmax (pg/mL) | Median Tmax (h) | AUClast (ng·h/mL) |
|---|---|---|---|---|---|
| Controla (N=8) |
3 MIU |
Roferon-A® |
43.27 ± 9.804 (22.66%) |
6 |
0.9664 ± 0.9322 (96.46%) |
| 1 (N=6) |
9 MIU |
SR-IFN-α |
28.33 ± 9.656 (34.08%) |
18 |
2.072 ± 1.134 (54.73%) |
| 2 (N=6) |
18 MIU |
SR-IFN-α |
62.12 ± 15.93 (25.64%) |
24 |
5.373 ± 1.382 (25.72%) |
| 3 (N=6) |
27 MIU |
SR-IFN-α |
65.73 ± 6.702 (10.20%) |
24 |
5.544 ± 0.5509 (9.94%) |
| 4 (N=6) | 36 MIU | SR-IFN-α | 80.31 ± 9.859 (12.28%) | 24 | 7.151 ± 1.132 (15.83%) |
aThere was not a separate control group, but data from a total of eight subjects (two subjects in each of the four groups) who received 3 MIU of Roferon-A® were shown.
To find the model that best described the absorption profile, which showed double peaks in many subjects, first- and zero-order absorption models and their combined form, with or without lag time, were tested. Based on first-order elimination, one- and two-compartment distribution models were tested for the three absorption (first-order, zero-order and combined) processes. The Michaelis-Menten absorption and elimination models were also tested considering the potential saturable absorption or elimination using the ADVAN subroutines (Table 3).
Table 3.
PK model development process
| Step | Model testeda | Objective function value |
|---|---|---|
| 1 |
One-compartment model with first-order absorption |
2138.416 |
| |
One-compartment model with first-order absorption (with lag-time) |
2130.609 |
| 2 |
Two-compartment model with first-order absorption |
2037.527 |
| |
Two-compartment model with first-order absorption (with lag-time) |
1993.071 |
| |
Two-compartment model with saturable absorption (Michaelis Menten absorption) |
2140.583 |
| 3 |
Two-compartment model with zero-order absorption |
1885.795 |
| 4 |
One-compartment model with a mixture of zero and first-order absorption |
1879.067 |
| One-compartment model with Michaelis Menten elimination and a mixture of zero- and first-order absorption | 2163.942 |
aThe elimination process was assumed to follow first-order kinetics.
The coupling of the PK model to the PD model was done in a sequential manner. The population PD modeling was performed using the individual PK parameters estimated from the final PK model, which were added to the PD dataset.
Turnover models, with or without transit compartments, were compared to find the most appropriate model that explained the delayed effect of IFN-α on neopterin concentrations. The turnover model was initially selected over the effect compartment model based upon the well-known action of IFN-α stimulating the release of neopterin, and the transit compartments were tested because their usefulness was reported in a previous preclinical study [16].
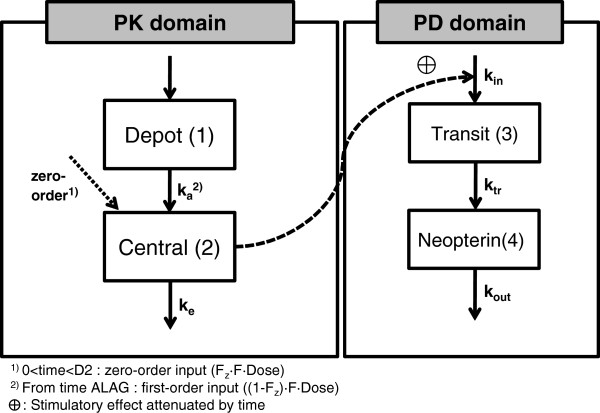
The differential equations for the drug effect model (model structures are shown in Figure 2) were:
Figure 2.
PK-PD model structure. The mixed absorption with one-compartment first-order elimination model (PK) and the turnover model with a single transit compartment (PD) are shown.
where Ka and Ke are the absorption and elimination rate constants for IFN-α, respectively. Kin is the production rate of neopterin, a zero-order constant, Ktr is the first-order transition rate leaving the transit compartment, Kout is the first-order rate constant for the elimination of neopterin, and E(C) is the effect as a function of the individual predicted drug concentration, C. A(4), which is the amount existing in the 4th compartment, indicates the concentration of neopterin.
The stimulatory function for the drug effect, E(C), was a sigmoid function:
where Emax is the maximum effect and EC50 is the IFN-α concentration that produces 50% of the maximum effect.
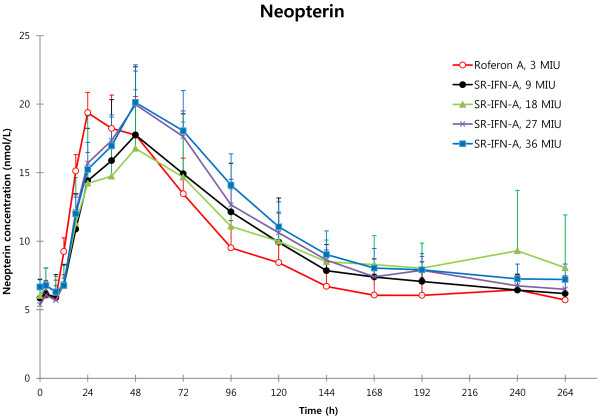
In our study, differences in the mean plasma neopterin concentrations between the groups receiving different doses of SR-IFN-α were not clearly discernible (Figure 3). To account for this phenomenon in our PD model, we incorporated the concept of time-dependent attenuation of the effect parameters [18], especially the increasing EC50 over time, as shown in the following equation:
Figure 3.
Plasma neopterin concentration changes in response to interferon-α (Mean and S.D.). Plasma neopterin concentrations after injection of Roferon-A® or SR-IFN-α show little difference between dose groups.
where ECB is the baseline of EC50 and CA and CB are coefficients to describe the EC50 increase to a certain level (ECB × CA) over time. This curve is the cumulative distribution function (CDF) of an exponential distribution to EC50. It has advantages in explaining the concave-shaped curves in relation to time.
The first-order conditional estimation (FOCE) method with interaction was used throughout the model building. Models were selected based upon a decrease in the objective function value (OFV) of more than 3.84 (P-value 0.05 in an approximate χ2 distribution) and improvement in the individual plots, as well as other scatterplots.
A log normal distribution was assumed for inter-individual variability (η), and PK or PD parameters of the jth subject (Pj) were described as:
where TVP represents the typical population value of PK-PD parameters, such as clearance (CL), volume of distribution (V), absorption rate constant (Ka), lag time (ALAG), the first-order elimination rate of serum neopterin (Kout), and maximum stimulation effect (Emax). The inter-individual variability eta (η) for each PK-PD parameter was assumed to follow a Gaussian distribution with a mean 0 and a variance ω2. Possible correlations between the inter-individual variability were also evaluated.
As for the residual error, the additive, proportional and combined forms were tested. An example of the combined error form is shown as follows:
where IPREDij is the individual predicted concentration, Yij is the measured concentration of the jth individual at the ith sampling time, and ϵij is residual error. Residual errors (ϵ) include intra-individual variability, assay error and model misspecification. They were also assumed to follow a Gaussian distribution with a mean 0 and variance σ2.
Covariate selection
Age, height, weight and creatinine clearance were screened as potential covariates of the parameters using Generalized Additive Modeling (GAM) implemented by Xpose version 4.2.3.
In the forward selection of covariates, variables that decreased the OFV by more than 3.84 (P < 0.05) and improved the inter-individual variability (omega value decrease) were selected. Covariates that did not increase the OFV more than 3.84 (P < 0.05) in the backward elimination step were removed from the model.
Model evaluation
The 95% confidence intervals (CIs) for mean population PK and PD parameters were determined using a re-sampling technique based on the bootstrap method. One thousand re-sampled datasets were collected and their parameters were estimated using our population models. The models were also evaluated by visual predictive checks (VPC) using 1,000 simulated datasets.
Results
Population PK-PD model
The results of non-compartmental PK analysis showing the trend of PK linearity of SR-IFN-α are briefly summarized in Table 2. A one-compartment model with first-order elimination and a mixture of zero- and first-order absorption best described the PK of SR-IFN-α. The delayed pattern of the time-concentration profile of neopterin was well described by the turnover model with a single transit compartment. There was no significant covariate. The structure of the final PK-PD model is shown in Figure 2. The population PK-PD parameter estimates, with corresponding standard error (SE) values, are summarized in Table 4. Basic goodness-of-fit plots are presented in Figure 4. Predicted concentration-time profiles of IFN-α and observed data from representative individuals are shown in Figure 5.
Table 4.
Final estimates of population PK-PD parameters
| Parameter | Description | Estimate | %RSE | Bootstrap median (95% CI)a |
|---|---|---|---|---|
|
Pharmacokinetics | ||||
| CL/F (L/h) |
Apparent clearance |
12.2 |
7.39 |
12.5 (4.9~14.9) |
| V/F (L) |
Apparent volume of distribution |
691 |
6.54 |
712 (324~980) |
| D2 (h) |
Duration of zero-order absorption |
20.2 |
7.08 |
19.9 (16.6~23.0) |
| KA (h-1) |
Absorption rate constant of first-order absorption |
0.00653 |
16.23 |
0.00721 (0.0010~0.1715) |
| ALAG (h) |
Lag time to the initiation of first-order absorption |
85.7 |
3.92 |
88.1 (80.9~108.0) |
| RFb |
Alternate variable for relative fraction absorbed in zero-order absorption process |
0.185 |
55.68 |
0.24 (-1.17~0.94) |
| ωCL (%) |
Between subject variability of CL |
26.1 |
35.1 |
24.5 (14.4~32.7) |
| ωV (%) |
Between subject variability of V |
23.8 |
58.0 |
23.7 (0.4~37.6) |
| ωD2 (%) |
Between subject variability of D2 |
35.7 |
27.1 |
34.8 (23.0~49.4) |
| ωRF (%) |
Between subject variability of RF |
34.7 |
64.1 |
32.1 (0.3~54.2) |
| ωka (%) |
Between subject variability of KA |
77.0 |
37.1 |
59.5 (0.7~95.4) |
| σadd (pg/mL) |
Additive error |
3.92 |
12.65 |
3.83 (-3.36~4.80) |
| σprop (%) |
Proportional error |
7.8 |
26.06 |
7.0 (-8.8~11.9) |
|
Pharmacodynamics | ||||
| BASE (nmol/L) |
Baseline of neopterin |
5.85 |
4.17 |
5.88 (5.39~6.34) |
| KOUT (h-1) |
First-order elimination rate of serum neopterin |
0.0311 |
17.20 |
0.03 (0.02~0.04) |
| EMAX |
Maximum stimulatory effect |
16.1 |
53.19 |
17.45 (7.06~62.42) |
| GA |
Hill coefficient (γ) |
1.24 |
11.85 |
1.27 (1.01~2.52) |
| CAc |
Coefficient |
405 |
115.80 |
616.5 (27~13115) |
| CBc |
Coefficient |
0.0068 |
27.73 |
0.0064 (0.0014~0.0119) |
| ECBc |
Baseline of EC50 |
2.17 |
152.07 |
1.66 (0.05~74.67) |
| MTT (h) |
Mean transit time |
14.6 |
11.37 |
14.5 (9.82~19.2) |
| ωBASE (%) |
Between subject variability of BASE |
13.85 |
51.84 |
12.63 (3.91~20.79) |
| ωCB (%) |
Between subject variability of CB |
57.31 |
43.31 |
46.21 (0.32~72.61) |
| ωGA (%) |
Between subject variability of GA |
13.51 |
55.80 |
13 (0.32~36.49) |
| ωECB (%) |
Between subject variability of ECB |
21.31 |
172.97 |
21.39 (0.45~55.86) |
| ωMTT (%) |
Between subject variability of MTT |
13.36 |
94.92 |
10.75 (0.55~24.21) |
| σadd (nmol/L) | Additive error | 1.14 | 11.05 | 1.11 (0.95~1.37) |
a95% CIs obtained from estimation of 1000 bootstrap-resampled datasets; bFraction absorbed in zero-order absorption, Fz = eRF/(1+ eRF); Fraction absorbed in first-order absorption: 1-Fz; cEC50 =ECB*(1+CA*(1-e-CB*Time)); RSE Relative standard error.
Figure 4.
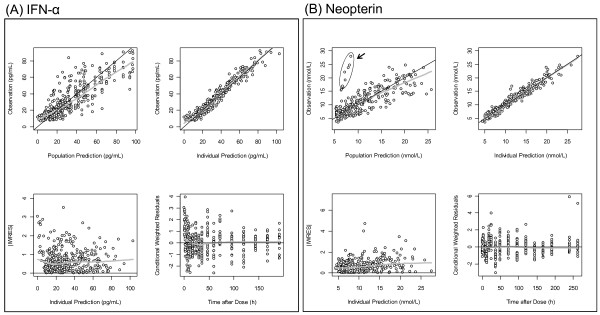
Basic goodness of fit plots for PK and PD models. (A) and (B) are goodness of fit plots for PK (IFN-α) and PD (neopterin) models, respectively. Black line, line of identity; gray line, LOESS (locally weighted regression) smooth line. The encircled dots in the PD plots represent one outlier (ID No. 2) whose IFN-α concentrations were very low, but whose neopterin concentrations were rather higher.
Figure 5.
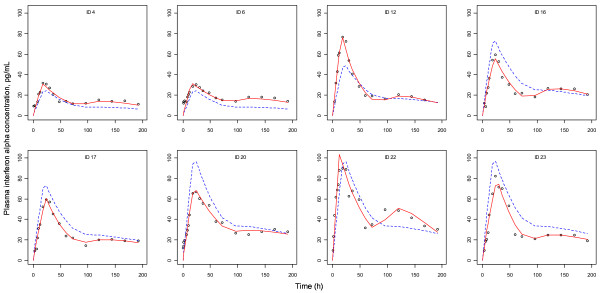
PK curves from representative individuals showing double peaks. Circle, observed value; dashed line, population predicted value; solid line, individual predicted value.
Model evaluation
The 95% confidence intervals (CIs) for population PK-PD parameter estimates, determined using the bootstrap re-sampling method, are shown in Table 4. VPC plots simulated concentrations of 1,000 virtual datasets (nsub=1000 in the $SIMULATION block, 24,000 virtual patients) from the final model. The results from the VPC showed that the PK-PD model gave acceptable predictive performance. Curves for the 12.5th, 50th and 87.5th percentiles of concentrations were overlaid on the observed concentrations (Figure 6).
Figure 6.
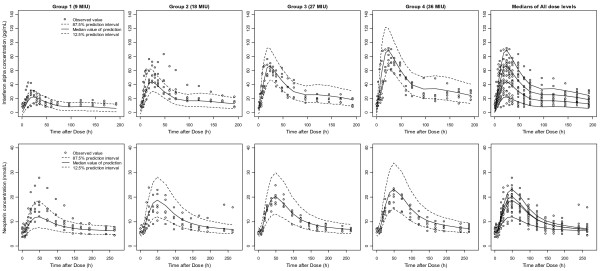
Visual predictive checks of PK (Top) and PD (Bottom) models. One thousand datasets (24,000 virtual subjects) were simulated using the final PK and PD parameter estimates. The simulated median (solid lines) and 75% prediction intervals (broken lines) were overlaid with observed data. The two rightmost panels presenting medians of all dose groups show dose-linearity in PK, but not in PD.
Discussion
In this study, we presented results of PK-PD modeling of the time-concentration profiles of IFN-α and neopterin after administration of SR-IFN-α in healthy subjects.
For PK characteristics, the combined absorption model was successful in describing the double peak phenomenon. A zero-order absorption model appropriately described the initial increase in concentration, as measured by relatively frequent sampling, before reaching the maximum concentration. Subsequent second peaks (observed around 100 h after injection) were, however, best described by a first-order absorption model. One possible explanation for this double-peak phenomenon is in the method of SR-IFN-α administration: SR-IFN-α should be mixed with medium chain triglycerides (MCT) right before subcutaneous injection. Micro-droplets with various sizes might be formed in this mixing step, and their absorption rates may differ by droplet diameters. Despite differences in formulation, the CL (12.2 L/h) and V (691 L) in our report were not much different from those reported in a previous study for IFN-α (7~8 L/h and 700~850 L, respectively) in healthy subjects [19].
As for the PD model, the addition of a transit compartment before the neopterin compartment gave better outcome when compared with a simple turnover model. The transit compartment for neopterin was used to model data from monkeys [16], and we found that it is also useful in a human PK-PD model in this study. As there are a few mechanistic models that tried to explain little PD differences between dose groups (saturation of responses) [16,20,21], we tested them for our neopterin data in the preliminary PD model development step; however, none of them were successfully converged by NONMEM. Neither the precursor turnover model [20] that explained tolerance with depletion of precursor molecules, nor the turnover feedback model [21] that explained tolerance with negative feedback via a moderator compartment provided acceptable parameter estimates, and the basic goodness of fit plots were even worse than those for the descriptive model of increasing EC50. The inhibitory feedback model in monkeys [16] also showed similar problems. Thus, we had to use the concept of time-dependent attenuation of EC50 that did not include mechanistic reasoning to describe our neopterin response.
There are conflicting reports on saturation of neopterin by IFN-α in patients. A report on patients with hairy cell leukemia showed that neopterin responses and clinical efficacies after low doses (0.5-0.8 MIU/day) were similar to those after a conventional dose (3 MIU/day) in a 6-month clinical trial [22]. In another clinical trial for a controlled release formulation of IFN-α, increases in the mean AUC of neopterin were marginal among the doses tested (4.09 mM·h after 20 μg IFN-α and 6.61 mM·h after 320 μg IFN-α) [23]. The forms of IFN-α used in those studies [22,23] were non-pegylated forms, like the SR-IFN-α used in this report; however, in phase I clinical trials of pegylated IFN-α, neopterin responses were well correlated with the doses used [24,25]. Such a discrepancy in neopterin responses between non-pegylated and pegylated IFN-α suggests that the polyethylene glycol tail attached to IFN-α changed its PD parameters related to neopterin production. To the best of our knowledge, although pegylated formulations have long been used, it has never been reported that their PD profile may be different from that of non-pegylated forms.
Because neopterin is a frequently-used marker of cell-mediated immunity, it can be used to monitor the degree of immune activation in various clinical conditions, including infections, autoimmune diseases, malignancies, and other conditions [26]. Neopterin is also known to mediate the cytotoxic action of activated macrophages and dendritic cells via interactions with reactive oxygen species [27]. Thus, saturation of the neopterin response suggests that the magnitude of cytotoxic action mediated by neopterin may be similar regardless of the doses of IFN-α.
Conclusions
We developed a human PK-PD model revealing the saturable neopterin response to IFN-α for the first time. Our model suggests that the magnitude of cytotoxic action mediated by neopterin may be similar regardless of the doses of non-pegylated IFN-α.
Competing interests
JHJ is an employee of LG Life Sciences Co., Ltd.
Authors’ contributions
SJ performed the PK-PD analysis and drafted the manuscript. JHJ participated in the planning and design of the clinical study and drafting the manuscript. SH, JL, TH, and JP participated in PK-PD analysis. DSY conceived the study, supervised the process of PK-PD analysis and edited the manuscript. All authors read and approved the final manuscript.
Supplementary Material
Individual plasma concentration curves of SR-IFN-α and neopterin.
Contributor Information
Sangil Jeon, Email: gainsay98@caholic.ac.kr.
Jae-Hyeon Juhn, Email: jhjuhn@lgls.com.
Seunghoon Han, Email: waystolove@catholic.ac.kr.
Jongtae Lee, Email: massive2@catholic.ac.kr.
Taegon Hong, Email: tghong@catholic.ac.kr.
Jeongki Paek, Email: calm100@catholic.ac.kr.
Dong-Seok Yim, Email: yimds@catholic.ac.kr.
References
- Pfeffer LM, Dinarello CA, Herberman RB, Williams BR, Borden EC, Bordens R, Walter MR, Nagabhushan TL, Trotta PP, Pestka S. Biological properties of recombinant α-interferons: 40th anniversary of the discovery of interferons. Cancer Res. 1998;58:2489–2499. [PubMed] [Google Scholar]
- Stark GR, Kerr IM, Williams BR, Silverman RH, Schreiber RD. How cells respond to interferons. Annu Rev Biochem. 1998;67:227–264. doi: 10.1146/annurev.biochem.67.1.227. [DOI] [PubMed] [Google Scholar]
- Bao Q, Zhao Y, Niess H, Conrad C, Schwarz B, Jauch K-W, Huss R, Nelson PJ, Bruns CJ. Mesenchymal stem cell-based tumor-targeted gene therapy in gastrointestinal cancer. Stem Cells Dev. 2012;21:2355–2363. doi: 10.1089/scd.2012.0060. [DOI] [PMC free article] [PubMed] [Google Scholar]
- Samarajiwa SA, Wilson W, Hertzog PJ. Type I interferons: genetics and structure. Characterization and Application: The Interferons; 2006. [Google Scholar]
- Jonasch E, Haluska FG. Interferon in oncological practice: review of interferon biology, clinical applications, and toxicities. Oncologist. 2001;6:34–55. doi: 10.1634/theoncologist.6-1-34. [DOI] [PubMed] [Google Scholar]
- Hoofnagle JH, Lau D. Chronic viral hepatitis — benefits of current therapies. N Engl J Med. 1996;334:1470–1471. doi: 10.1056/NEJM199605303342210. [DOI] [PubMed] [Google Scholar]
- Lutchman G, Hoofnagle JH. Viral kinetics in hepatitis C. Hepatology. 2003;37:1257–1259. doi: 10.1053/jhep.2003.50238. [DOI] [PubMed] [Google Scholar]
- Liang TJ, Rehermann B, Seeff LB, Hoofnagle JH. Pathogenesis, natural history, treatment, and prevention of hepatitis C. Ann Intern Med. 2000;132:296–305. doi: 10.7326/0003-4819-132-4-200002150-00008. [DOI] [PubMed] [Google Scholar]
- McHutchison JG, Gordon SC, Schiff ER, Shiffman ML, Lee WM, Rustgi VK, Goodman ZD, Ling M-H, Cort S, Albrecht JK. Interferon alfa-2b alone or in combination with ribavirin as initial treatment for chronic hepatitis C. N Engl J Med. 1998;339:1485–1492. doi: 10.1056/NEJM199811193392101. [DOI] [PubMed] [Google Scholar]
- Milella M, Antoneill G, Santantonio T, Currenti M, Monno L, Mariano N, Angarano G, Dianzanl F, Pastors G. Neutralizing antibodies to recombinant alpha‒interferon and response to therapy in chronic hepatitis C virus infection. Liver. 1993;13:146–150. doi: 10.1111/j.1600-0676.1993.tb00622.x. [DOI] [PubMed] [Google Scholar]
- Caliceti P. Pharmacokinetics of pegylated interferons: what is misleading? Dig Liver Dis. 2004;36:S334–S339. doi: 10.1016/s1590-8658(04)80002-1. [DOI] [PubMed] [Google Scholar]
- Roberts M, Bentley M, Harris J. Chemistry for peptide and protein PEGylation. Adv Drug Deliv Rev. 2002;54:459–476. doi: 10.1016/S0169-409X(02)00022-4. [DOI] [PubMed] [Google Scholar]
- Grace M, Youngster S, Gitlin G, Sydor W, Xie L, Westreich L, Jacobs S, Brassard D, Bausch J, Bordens R. Structural and biologic characterization of pegylated recombinant IFN-α2b. J Interferon Cytokine Res. 2001;21:1103–1115. doi: 10.1089/107999001317205240. [DOI] [PubMed] [Google Scholar]
- Choi SY, Jeh HS. Sustained release composition of protein drug. 2006. WO Patent 2,006,088,336.
- Murr C, Widner B, Wirleitner B, Fuchs D. Neopterin as a marker for immune system activation. Curr Drug Metab. 2002;3:175–187. doi: 10.2174/1389200024605082. [DOI] [PubMed] [Google Scholar]
- Hu X, Olivier K, Polack E, Crossman M, Zokowski K, Gronke RS, Parker S, Li Z, Nestorov I, Baker DP. In vivo pharmacology and toxicology evaluation of polyethylene glycol-conjugated interferon β-1a. J Pharmacol Exp Ther. 2011;338:984–996. doi: 10.1124/jpet.111.180661. [DOI] [PubMed] [Google Scholar]
- Pepinsky RB, LePage DJ, Gill A, Chakraborty A, Vaidyanathan S, Green M, Baker DP, Whalley E, Hochman PS, Martin P. Improved pharmacokinetic properties of a polyethylene glycol-modified form of interferon-β-1a with preserved in vitro bioactivity. J Pharmacol Exp Ther. 2001;297:1059–1066. [PubMed] [Google Scholar]
- Colburn WA, Eldon MA. Simultaneous pharmacokinetic/pharmacodynamic modeling. New York: Wiley; 1994. [Google Scholar]
- García-García I, González-Delgado CA, Valenzuela-Silva CM, Díaz-Machado A, Cruz-Díaz M, Nodarse-Cuní H, Pérez-Pérez O, Bermúdez-Badell CH, Ferrero-Bibilonia J, Páez-Meireles R. Pharmacokinetic and pharmacodynamic comparison of two "pegylated" interferon alpha-2 formulations in healthy male volunteers: a randomized, crossover, double-blind study. BMC Pharmacol. 2010;10:15. doi: 10.1186/1471-2210-10-15. [DOI] [PMC free article] [PubMed] [Google Scholar]
- Licko V, Ekblad E. Dynamics of a metabolic system: what single-action agents reveal about acid secretion. Am J Physiol Gastrointest Liver Physiol. 1992;262:G581–G592. doi: 10.1152/ajpgi.1992.262.3.G581. [DOI] [PubMed] [Google Scholar]
- Zuideveld KP, Maas HJ, Treijtel N, Hulshof J, van der Graaf PH, Peletier LA, Danhof M. A set-point model with oscillatory behavior predicts the time course of 8-OH-DPAT-induced hypothermia. Am J Physiol-Regul, Integ Comp Physiol. 2001;281:R2059–R2071. doi: 10.1152/ajpregu.2001.281.6.R2059. [DOI] [PubMed] [Google Scholar]
- Gastl G, Aulitzky W, Tilg H, Nachbaur K, Troppmair J, Flener R, Huber C. A biological approach to optimize interferon treatment in hairy cell leukemia. Immunobiology. 1986;172:262–268. doi: 10.1016/S0171-2985(86)80107-3. [DOI] [PubMed] [Google Scholar]
- De Leede LG, Humphries JE, Bechet AC, Van Hoogdalem EJ, Verrijk R, Spencer DG. Novel controlled-release lemna-derived IFN-α 2b (locteron): pharmacokinetics, pharmacodynamics, and tolerability in a phase I clinical trial. J Interferon Cytokine Res. 2008;28:113–122. doi: 10.1089/jir.2007.0073. [DOI] [PubMed] [Google Scholar]
- Motzer RJ, Rakhit A, Ginsberg M, Rittweger K, Vuky J, Yu R, Fettner S, Hooftman L. Phase I trial of 40-kd branched pegylated interferon alfa-2a for patients with advanced renal cell carcinoma. J Clin Oncol. 2001;19:1312–1319. doi: 10.1200/JCO.2001.19.5.1312. [DOI] [PubMed] [Google Scholar]
- Glue P, Fang JW, Rouzier-Panis R, Raffanel C, Sabo R, Gupta SK, Salfi M, Jacobs S. Pegylated interferon-α2b: pharmacokinetics, pharmacodynamics, safety, and preliminary efficacy data. Clin Pharmacol Ther. 2000;68:556–567. doi: 10.1067/mcp.2000.110973. [DOI] [PubMed] [Google Scholar]
- Berdowska A, Zwirska‒Korczala K. Neopterin measurement in clinical diagnosis. J Clin Pharm Ther. 2001;26:319–329. doi: 10.1046/j.1365-2710.2001.00358.x. [DOI] [PubMed] [Google Scholar]
- Hoffmann G, Wirleitner B, Fuchs D. Potential role of immune system activation-associated production of neopterin derivatives in humans. Inflamm Res. 2003;52:313–321. doi: 10.1007/s00011-003-1181-9. [DOI] [PubMed] [Google Scholar]
Associated Data
This section collects any data citations, data availability statements, or supplementary materials included in this article.
Supplementary Materials
Individual plasma concentration curves of SR-IFN-α and neopterin.


