

Abstract
Puffs are localized, transient elevations in cytosolic Ca2+ that serve both as the building blocks of global cellular Ca2+ signals and as local signals in their own right. They arise from clustered inositol 1,4,5-trisphosphate receptor/channels (IP3Rs), whose openings are coordinated by Ca2+-induced Ca2+ release (CICR). We utilized total internal reflection fluorescence imaging of Ca2+ signals in neuroblastoma cells with single-channel resolution to elucidate the mechanisms determining the triggering, amplitudes, kinetics, and spatial spread of puffs. We find that any given channel in a cluster has a mean probability of ∼66% of opening following opening of an initial “trigger” channel, and the probability of puff triggering thus increases steeply with increasing number of channels in a cluster (cluster size). Mean puff amplitudes scale with cluster size, but individual amplitudes vary widely, even at sites of similar cluster size, displaying similar proportions of events involving any given number of the channels in the cluster. Stochastic variation in numbers of Ca2+-inhibited IP3Rs likely contributes to the variability of amplitudes of repeated puffs at a site but the amplitudes of successive puffs were uncorrelated, even though we observed statistical correlations between interpuff intervals and puff amplitudes. Initial puffs evoked following photorelease of IP3—which would not be subject to earlier Ca2+-inhibition—also showed wide variability, indicating that mechanisms such as stochastic variation in IP3 binding and channel recruitment by CICR further determine puff amplitudes. The mean termination time of puffs lengthened with increasing puff amplitude size, consistent with independent closings of channels after a given mean open time, but we found no correlation of termination time with cluster size independent of puff amplitude. The spatial extent of puffs increased with their amplitude, and puffs of similar size were of similar width, independent of cluster size.
Introduction
Cytosolic Ca2+ signals arising from the activation of inositol 1,4,5-trisphosphate receptors (IP3Rs) play a central role in the regulation of numerous physiological processes (1–3). IP3R channels are tightly clustered on the endoplasmic reticulum (ER) membrane and liberate Ca2+ ions sequestered in the ER into the cytosol. Because the opening of a channel requires the binding of both IP3 and Ca2+ to its cytosolic face (4), Ca2+ ions diffusing in the cytosol from an open channel promote the opening of neighboring IP3Rs via regenerative Ca2+-induced Ca2+ release (CICR). Ca2+ efflux from a single channel (blip) (5) may spread to activate other channels in the same cluster, giving rise to a transient localized signal (puff) (6). Furthermore, successive cycles of CICR and Ca2+ diffusion between clusters can produce saltatory Ca2+ waves capable of engulfing an entire cell via a fire-diffuse-fire mechanism (7).
We seek to understand the factors that shape the size, duration, and spatial spread of the elemental puffs that form the building blocks of cellular Ca2+ signals. A simple model posits that puffs are initiated by the stochastic opening of an IP3R channel within a cluster by the random binding of Ca2+ ions to a channel that is rendered activatable by virtue of binding IP3 (8). This model predicts that important factors in shaping a puff include the probability that a “trigger” channel opening activates adjacent IP3R channels in a cluster; the number of functional channels present in a cluster (cluster size); and the opening probability of each channel, which in turn is a function of the concentrations of IP3 and Ca2+. Recent innovations in total internal reflection fluorescence (TIRF) microscopy allowing fast camera-based imaging within a thin optical section, combined with the functional isolation of puff sites through the cytosolic loading of the slow Ca2+ buffer EGTA (ethylene glycol-bis(β-aminoethyl ether)-N,N,N’,N’-tetraacetic acid), now enable the imaging of local Ca2+ signals in mammalian cells with single-channel resolution (9). Specifically, we can estimate both the number of channels contributing to a puff and the dynamics of channel gating during the evolution of individual puffs.
The mean amplitudes of local Ca2+ signals at given sites vary appreciably between different puff sites, even in the same cell, pointing to considerable heterogeneity in numbers of IP3Rs within different clusters (9–11). Analysis of larger data sets obtained by pooling many puff sites is thus confounded by the heterogeneity among sites. Moreover, it is difficult to extract statistically meaningful data from individual sites given the small numbers (typically a few tens) of stochastically varying events that can be experimentally recorded. We had previously overcome this problem by estimating cluster size (number of functional IP3Rs within puff sites) in SH-SY5Y cells from the maximum puff amplitude at a given site, allowing data to be grouped by sites of similar size. This analysis further enabled us to study the influence of cluster size on puff triggering. We found that the frequency of puffs increased linearly with cluster size, whereas the latency to occurrence of a first puff following flash photorelease of IP3 shortened (9,11). These results indicated that the probability with which a puff is triggered increases in direct proportion to the number of IP3R channels at a cluster.
Here, we extend our analysis to the subsequent evolution of puffs following their initial triggering. Specifically, we investigate the strength of interchannel coupling by which opening of one IP3R channel will promote opening of further channels in a cluster, and the factors that determine the amplitude, kinetics, and spatial spread of puffs.
Methods
SH-SY5Y human neuroblastoma cells were cultured and were loaded for imaging using membrane-permeant esters of fluo-4, EGTA, and caged IP3 (ci-IP3) as described (12). [Ca2+]i changes were imaged using a TIRF microscope system constructed around an Olympus IX 70 microscope (Olympus, Center Valley, PA) with a 60 × TIRF objective (NA, 1.45), as previously described (9,12). Fluo-4 fluorescence was excited by 488 nm laser light within an evanescent field extending a few hundred nanometers into the cells, and emitted fluorescence (λ > 510 nm) was imaged at a resolution of 128 × 128 pixels (1 pixel = 0.33 μm) at 500 frames sec−1 using a Cascade 128 electron-multiplied ccd camera (Roper Scientific, Tucson, AZ).
Photolysis of ci-IP3 was evoked by a single flash of UV (ultraviolet) light (350 to 400 nm) from an arc lamp focused to uniformly illuminate a region slightly larger than the imaging frame to uncage i-IP3, a metabolically stable isopropylidene analog of IP3, which evoked activity persisting for a few minutes. Image data were acquired as stack files using MetaMorph v7.7 (Universal Imaging/Molecular Devices, Sunnyvale, CA) for offline analysis using MetaMorph. Fluorescence signals are expressed as a ratio (ΔF/F0) of changes in fluorescence (ΔF) averaged over 3 × 3 pixel (1 × 1 μm) regions of interest, relative to the mean resting fluorescence at the same region before stimulation (F0). Measurements of the amplitude and timing (frequency, rise time, termination time, and full duration at half-maximal amplitude; FDHM) of individual events were made by visual inspection of traces. Measurements of the spatial extent of puffs (full-width at half-maximal amplitude of fluorescence signals; FWHM) were made by using the linescan feature of Metamorph for a 3-pixel-wide line running through the center of origin of a puff at the time of maximal amplitude.
Microcal Origin Version 8.0 (OriginLab, Northampton, MA) was used for analysis and graphing. Unless otherwise noted, data are presented as means ± 1 S.E.M. Regression lines are plotted with dashed curves indicating 95% confidence bounds.
Results
Estimating cluster size from maximal Ca2+ transient amplitudes
SH-SY5Y cells were loaded with EGTA to disrupt global Ca2+ waves, and localized transient Ca2+ events (blips and puffs) were evoked by photoreleasing i-IP3 with a flash of UV light of fixed intensity and varying durations. Data presented in this study were pooled from experiments with flash durations ≥ 60 ms, which all evoked similar mean responses (60 ms flash ΔF/F0 = 0.35 ± 0.25, n = 2027; 100 ms flash 0.37 ± 0.21, n = 265; 160 ms flash 0.37 ± 0.20, n = 977; and 200 ms flash 0.41 ± 0.19, n = 230. For comparison a 40 ms flash ΔF/F0 = 0.21 ± 0.21 SD, n = 299).
Fig. 1 A shows representative fluorescence traces obtained by TIRF microscopy from sites displaying different maximal event amplitudes. The site in the upper trace showed only two blips (amplitudes of ∼0.11 ΔF/F0). In the lower traces the largest puffs (marked by shading) had amplitudes of 0.66 and 0.88 ΔF/F0. We estimated the number of functional IP3R channels (cluster size) of a site by dividing the amplitude of the maximal event by that of a blip. The three sites in Fig. 1 A were thus assigned cluster sizes of one, six, and eight respectively. Examples of events of varying amplitudes are shown in Fig. 1 B, with interpolated lines depicting fluorescence levels corresponding to different integer numbers of open channels. For a more detailed description and validation of this methodology, see Dickinson et al. (11).
Figure 1.
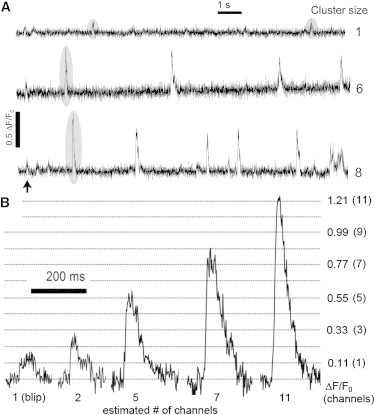
Variability in Ca2+ event amplitudes and frequencies at different puff sites. (A) Traces show representative fluorescence recordings from sites of differing cluster size (as indicated to the right of each trace). Cluster size was estimated by dividing the peak fluorescence amplitude (ΔF/F0) of the largest event observed by the mean amplitude of single-channel blips (ΔF/F0 = 0.11). Arrow indicates the time of the photolysis flash. (B) Expanded views of representative events estimated to involve openings of various numbers of IP3R channels, as indicated in parentheses. Horizontal lines denote stepwise Ca2+-fluorescence levels (ΔF/F0) corresponding to increasing numbers of open channels.
Probability of puff triggering following opening of an initial channel
We had previously examined how the stochastic opening probability of any one of the IP3R channels within a cluster varies with cluster size (11). In this study, we assessed the probability that the initial opening of a “trigger” channel would trigger a puff (i.e., open further channels), by measuring the frequencies of all events (puffs and blips) in comparison with the frequencies of blips (channel openings that failed to induce CICR). Data from 331 sites are plotted in Fig. 2 A as a function of cluster size. The overall mean frequency of all events (solid squares) increased about linearly with cluster size, which is consistent with our interpretation that events can be triggered by stochastic opening of any one of n independent and identical activatable channels within a cluster (11). Different to this, the frequency of blips declined with increasing cluster size (open circles, Fig. 2 A). From these data we investigated the strength of channel-channel coupling via CICR; that is to say, the probability that the initial opening of one IP3R channel would trigger the opening of at least one other channel in a cluster. Fig. 2 B plots the mean percentages of all events that were classified as blips, after grouping by cluster size. For cluster size one (a single, “lone” channel), by definition, 100% of events were blips. For cluster size two, ∼33% of events were blips, and the remaining events were puffs involving coordinated openings of both channels. Thus, for a two-channel site, there was a probability of roughly 66% that opening of one channel would trigger its neighbor. For cluster size three, the mean fraction of blips declined (to ∼12%), as would be expected because opening of an initial channel would now increase the opening probability of two neighbors. That is to say, the probability that one of these channels would fail to open is ∼1/3, so the probability that neither would open is 1/9. At larger clusters the fraction of blips tended to further reduce, but the small numbers of blips precluded accurate measurements.
Figure 2.
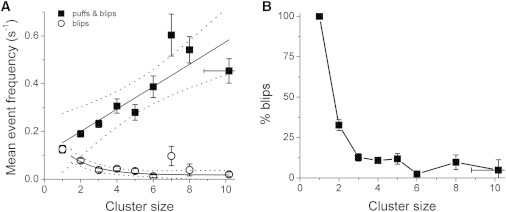
Probability of puff triggering assessed by measuring the relative frequencies of blips and puffs at sites of differing cluster size. (A) Mean frequencies of blips (open circles: single-channel events) and all events (solid squares: blips and puffs) as a function of cluster size. Frequencies are expressed as numbers of events per second, calculated from the number of events observed during the recording time (∼21 s) following a UV flash. Black lines show regression analysis fits, with 95% confidence intervals depicted by dotted lines. (B) The same data as in A, replotted to show the percentage of all events that were blips.
Variability in event amplitudes between sites
Fig. 3 A plots the overall distribution of event amplitudes from a data set of 3499 individual events (562 sites) evoked by maximal UV flashes (60 to 200 ms durations) in cells (n = 148) loaded with ci-IP3, fluo-4, and EGTA under identical conditions. As previously described (12), a wide spread of event sizes was observed, ranging from 0.05 to 2.75 ΔF/F0; skewed toward smaller events, and with a median value of 0.29 ΔF/F0. The inset graphs in Fig. 3 A show the distributions of mean and maximal event sizes (expressed as estimated number of channels opening during a puff) among the 562 sites. In accord with our earlier analysis of a smaller data set (11), a wide spread of values was observed, with the distribution of maximal event amplitudes indicating a large range of cluster sizes containing 1 to >12 functional channels.
Figure 3.
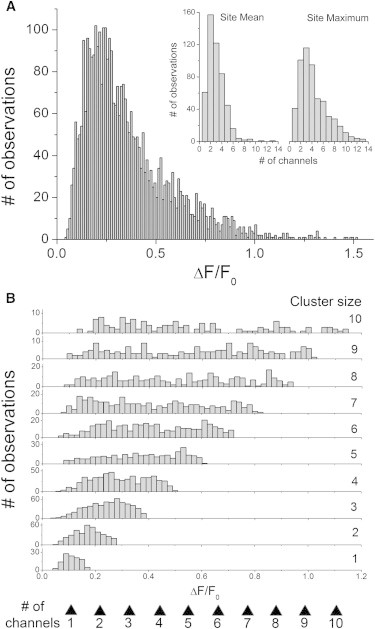
Distributions of event amplitudes at sites of differing cluster size. (A) Overall distribution of event amplitudes derived from 562 puff sites (n = 3499 events). For clarity two events with amplitudes >2.5 ΔF/F0 are omitted. Inset graphs show distributions of event amplitudes between different sites. Left, numbers of sites where the mean puff amplitude corresponded to the opening of one, two, three, etc., channels. Right, corresponding distribution of sites in terms of the largest event observed at a site. (B) Distributions of event amplitudes (scaled as both ΔF/F0 and estimated number of open channels) after grouping by cluster size (indicated at right).
Variability in event amplitudes at sites of given cluster size
We then examined distributions of event amplitudes at sites of a given cluster size. Fig. 3 B plots the distributions of event sizes (expressed as both ΔF/F0 and the equivalent number of channels open at the peak of the event) grouped by sites with estimated cluster sizes ranging from 1 to 10. For sites showing only blips (cluster size one), a roughly Gaussian distribution was observed, with a mean amplitude of 0.113 ± 0.003 ΔF/F0, in close agreement with that previously reported (0.114 ± 0.002 SE ΔF/F0 (11)). At larger cluster sizes, the mean event amplitude naturally increased. Surprisingly, however, the distributions of event sizes became remarkably “flat” rather than Gaussian-like, with similar probabilities of seeing events involving between one and the maximal number of open channels.
Distribution of first-event amplitudes
Factors that are likely to contribute to the variability in amplitudes of puffs arising at a given site include stochastic (Poissonian) variation in the number of IP3-bound receptors in a cluster that are available to open, stochasticity associated with interchannel coupling via CICR, and variability in the numbers of receptors that remain Ca2+-inhibited following a previous event (13,14). To evaluate the relative importance of these factors, we began by examining the amplitude distribution of the initial event evoked at each site following photorelease of IP3, on the basis that these arose without any earlier elevation of cytosolic [Ca2+] so that few or no IP3Rs would be in a Ca2+-inhibited state.
Fig. 4 A plots the mean sizes of initial and all subsequent transients as a function of cluster size for sites (n = 381) where ≥ 4 events were observed. On average, initial events were larger than the subsequent events at the same site, and the discrepancy became progressively larger at sites of greater cluster size, with the mean size of subsequent events being ∼70% of the first event for cluster sizes > 5. This diminution does not appear to reflect a run-down in ER Ca2+ store content and corresponding diminution in single-channel Ca2+ flux, because the mean amplitude of blips that occurred before an initial puff (ΔF/F0 = 0.124 ± 0.004) was not significantly greater than blips following the initial puff (ΔF/F0 = 0.123 ± 0.003: n = 56 sites with cluster size > 5 in which the first event was a blip). Instead, we conclude that, on average, more channels opened during initial puffs than during subsequent puffs.
Figure 4.
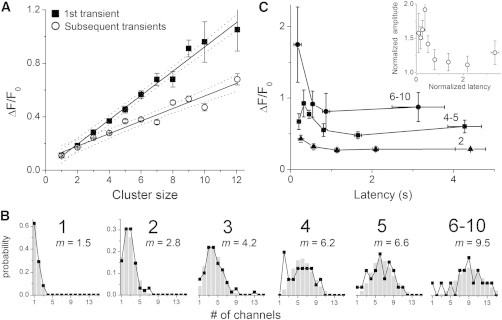
Amplitude distributions and latencies of initial events. (A) Mean amplitudes of initial (solid squares) and subsequent Ca2+ events (open circles) as a function of cluster size for sites (n = 381) where ≥ 4 events were observed. Solid lines represent linear regression fits, 95% confidence intervals are shown as dotted lines (initial events slope = 0.09 ± 0.01, R2 = 0.98; subsequent events slope = 0.05 ± 0.01, R2 = 0.93). (B) Amplitude distributions of initial events grouped by relative cluster size (indicated in bold above each graph). Experimental observations are shown as black symbols and lines. Gray histogram bars denote Poisson fits to the data, calculated from the mean numbers of channels (m) opening during an initial event in excess of the initial “trigger” channel. (C) Relationships between amplitude and latency of first-events. The main graph shows mean first-event amplitudes (ΔF/F0) plotted against latency for sites with relative cluster sizes of 2 (triangles), 4 and 5 (squares), and 6 to 10 (circles). Points are mean ± 1 SEM after binning measurements across time intervals chosen to include similar numbers of events (5–15). The inset shows pooled data from all 381 puff sites after normalizing first-event amplitudes at each site to the mean amplitude of all subsequent transients observed at that site, and normalizing first-event latencies to the mean interevent interval at that site.
To then evaluate the variability in first-puff amplitudes, we grouped the data using the mean amplitude of all subsequent puffs at each given site as a measure of cluster size. We refer to this as “relative cluster size,” in distinction from estimates of cluster size derived from the largest puff at a site. The black symbols in Fig. 4 B plot the observed amplitude distributions of initial puffs (expressed as numbers of open channels) for various cluster sizes. The resulting distributions were sharper than the corresponding distributions of all-event amplitudes (c.f. Fig. 3 B) but still showed appreciable variability. To further analyze the distributions, we derived Poisson functions for the numbers of additional channels that opened following opening of an initial trigger channel (gray bars, Fig. 4 B), calculated on the basis of the mean number of responding channels at sites of given relative cluster size. The data are fit well by the Poisson distributions.
First-event amplitude correlates inversely with latency
We had previously shown that the mean latency to appearance of an initial puff following flash photorelease of IP3 is shorter at sites containing more IP3Rs, and we proposed that the probability of triggering of a puff increases in direct proportion to the number of “activatable” IP3-bound receptors in a cluster (9,11). We were thus interested to see whether initial latencies correlated with the amplitude of the first event at a site, as would be predicted if the transient amplitudes were determined, at least in part, by variability in the fraction of IP3Rs in a cluster that had bound IP3 and were thus available to open. The main graph in Fig. 4 C plots the mean first-event amplitude vs. the first-event latency for different relative cluster sizes, and the inset graph plots data pooled from all clusters after normalizing amplitudes and latencies relative to, respectively, the mean puff size at a given site and the mean latency for all sites of that cluster size. The data show a strong correlation, with mean puff amplitudes being ∼50% greater following the shortest-observed latencies as compared with longest latencies.
Interactions between puff amplitudes and interpuff intervals
The high local [Ca2+] attained during a puff causes IP3Rs to become Ca2+-inhibited (15–17), from which state they gradually recover after cytosolic [Ca2+] has returned to close to basal levels (18). Thus, the number of noninhibited receptors will increase progressively with time after a puff, thereby affecting the mean interval before the next puff (19). Fig. 5 A shows the overall distribution of interpuff intervals obtained by pooling data from all puff sites and by expressing intervals relative to the mean interval at each given site to normalize for the variability in mean puff frequencies across different sites. The distribution shows two components: an initially increasing number of observations at increasing intervals, which we interpret as reflecting recovery of receptors from inhibition; followed by an exponentially decaying component reflecting stochastic triggering of events (6,19).
Figure 5.
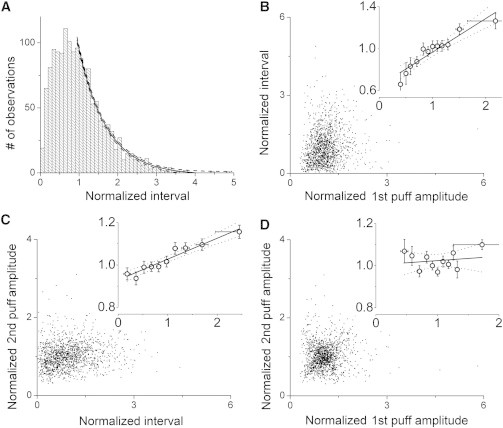
Interactions between puff amplitudes and interpuff intervals during repetitive trains of puffs. Blips were excluded from analyses in this figure. (A) Distribution of normalized interpuff intervals showing pooled data from 381 puff sites where ≥ 4 events were observed. Each interpuff interval was normalized relative to the mean interpuff interval at that site. The solid curve is a single-exponential fit; dashed curves indicate 95% confidence bands. (B and C) Scatter plots showing relationships between puff amplitudes and interpuff intervals. Puff amplitudes are normalized relative to the mean amplitude of puffs at that site, and intervals are normalized to the mean interpuff interval at that site. In each panel the main graph shows individual measurements, and the inset graph shows mean values replotted on expanded scales after binning across intervals on the x axis. Horizontal error bars denote ± 1 SD, to indicate the range of values used for binning. Black lines indicate regression fits, with 95% confidence intervals represented by dotted lines. (B) Relation between amplitude of a puff and the duration of the following interpuff interval. A linear regression fit to the data gave a slope of 0.32 ± 0.04; R2 = 0.87, P < 0.0001. (C) Relation between interpuff interval and amplitude of the following puff. Regression analysis gave a slope of 0.10 ± 0.01, R2 = 0.87, P < 0.0001. (D) Relation between the amplitude of a puff and the immediately following puff. Regression analysis did not reveal a significant correlation; slope = 0.05 ± 0.03, R2 = 0.12, P = 0.09.
Puff amplitudes and interpuff intervals are expected to be correlated, because a larger puff would, on average, cause a greater number of IP3Rs to become Ca2+-inhibited, resulting in a longer subsequent mean interpuff interval. Conversely, the amplitude of a puff is expected to be on average greater following a longer preceding interpuff interval, because of the increased time for recovery from inhibition (13). Fig. 5 B and C show respective scatter plots of these relationships, considering every pair of consecutive puffs throughout a record. There is a large stochastic scatter in the individual measurements, but mean data after binning show significant correlations (Fig. 5 B and C, inset plots). Normalized interpuff intervals lengthened by ∼40% with increasing size of the preceding puff (Fig. 5 B, inset), and the size of a second puff showed a smaller but clear relation with duration of the preceding interpuff interval (Fig. 5 C, inset). Despite these correlations, we found that the mean amplitude of the second puff in a pair was essentially independent of the amplitude of the preceding puff (Fig. 5 D).
Influence of puff amplitude and cluster size on puff kinetics
To quantify the kinetics of puff initiation and termination, we measured the time taken for a puff to reach its peak fluorescence amplitude from baseline (rise time); the full duration at half-maximal amplitude (FDHM); and the time to return from peak to baseline (termination time) for 702 puffs (events involving ≥ 2 channels). We obtained mean values of rise time = 34.3 ± 0.9 ms; FDHM = 69.0 ± 1.6 ms; and termination time = 93.5 ± 2.3 ms. Fig. 6 A, B, and C show respective scatter plots of these parameters as functions of peak puff amplitude (ΔF/F0), including data from individual events (gray dots) and mean values after binning over a range of amplitudes (open circles with error bars). Events within the smallest bin (ΔF/F0 < 0.165) correspond principally to blips and provide a measure of the kinetic resolution of our recordings (rise time, 12.0 ± 0.6 ms; fall time, 23.3 ± 1.1 ms), given that the opening and closing transitions of single-channel events are expected to be effectively instantaneous. These values are indicated as dashed lines in Fig. 6 A and C, to provide a baseline from which to better evaluate the true kinetics of channel gating after subtracting the lag in the fluorescence recordings.
Figure 6.
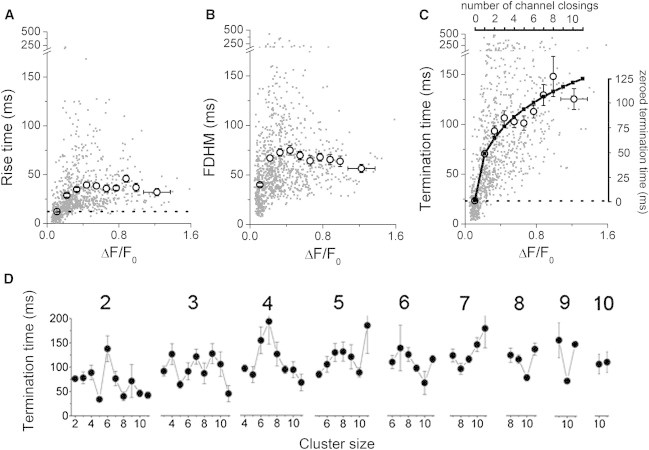
Event kinetics at sites of differing cluster size. (A) Scatter plot of event rise time vs. event size (ΔF/F0). Gray dots show individual measurements (n = 962; 260 blips, 702 puffs). Open circles show mean values binned across fluorescence signals corresponding to different integer numbers of open channels. The dashed horizontal line indicates the mean rise time of blips, as an indication of the temporal resolution of the fluorescence recordings. (B) Corresponding plots of individual and mean event durations (FDHM) versus event amplitudes. (C) Corresponding plots of puff termination times (time from peak to baseline) versus event amplitudes. Gray data points and left and bottom axes refer to “raw” measured data. The top axis rescales the amplitude measurements in terms of the estimated number of channels that remained open at the time the fluorescence signal began to fall (i.e., the number of open channels at the time the first channel had just closed). The right axis shows the termination time after rezeroing to account for the limited kinetic resolution of the recordings. The black curve plots the termination times predicted if channels closed independently following a mean open duration of 47 ms. See text for further explanation. (D) Plots show mean puff termination times as a function of cluster size, after grouping data by puff amplitude (estimated number of channels open at the peak of the puff; indicated above each graph). Each panel thus shows the mean termination times of puffs of the same amplitude recorded across different sites of differing cluster size.
The absolute rise time of events roughly doubled from those binned with mean ΔF/F0 0.1 (largely blips) to those with ΔF/F0 0.2 (largely two-channel events), but remained roughly the same (∼40 ms) for all larger events (Fig. 6 A). Thus, it seems that recruitment of additional channels following opening of an initial triggering IP3R channel takes around 20 to 30 ms, but that this delay is substantially independent of how many channels open. Event durations, expressed as FWHM, increased from ∼40 to ∼70 ms going from single- to double-channel events but remained about constant across larger events (Fig. 6 B). Subtracting the rise time, this indicates that multichannel puffs decay with a half-time of around 30 ms, substantially independent of their amplitude.
The time to puff termination (time for fluorescence to return to baseline from the peak) lengthened considerably from ∼20 ms for blips to nearly 150 ms for puffs involving around eight open channels (Fig. 6 C). We analyzed this relationship in terms of a model wherein channels that are open at the peak of a puff close randomly and independently following the same mean open time (9). The curve in Fig. 6 C shows the predicted relationship assuming a mean channel open time = 47 ms, and is plotted as the time from closing of a first channel to closing of the last channel, after subtracting the lag (23 ms) of the fluorescence recordings.
The data in Fig. 6 C show that the termination time of a puff varies strongly with its amplitude, but do not discriminate whether this is a function only of the number of open channels, or whether there may be a dependence on cluster size. For example, do small puffs arising at large clusters terminate as rapidly as equivalent-sized puffs arising at smaller clusters? We investigate this in Fig. 6 D by separately plotting the mean termination times of puffs of different amplitudes after grouping the data by cluster size. Overall, the results do not show any clear evidence that the termination times of puffs of a given size vary with cluster size.
Spatial extent of transients increases with event size but not cluster size
In Fig. 7 we explore how the spatial width of fluorescence signals during a transient (FWHM) varied with event amplitude and with cluster size. We recorded fluorescence ratio profiles along 3-pixel-wide lines centered on events arising away from the edges of the cell (Fig. 7 A), and measured the spatial widths of these profiles at the time of maximal amplitude, as illustrated by the horizontal bars in Fig. 7 B. Fig. 7 C shows a scatter plot of event width (FWHM) against event amplitude (ΔF/F0 and estimated peak number of open channels), including individual data points (gray dots) and mean measurements binned by amplitude (open circles with error bars). Mean widths increased progressively from ∼1 μm from the smallest events (principally blips) to ∼2 μm for puffs estimated to involve opening of five channels, and remained about constant at 2 μm for larger puffs. Fig. 7 D shows corresponding distributions of widths after grouping events less than and greater than 0.165 ΔF/F0. Both distributions were fit well by Gaussian functions, with respective widths (SD) of 0.93 and 1.7 μm.
Figure 7.
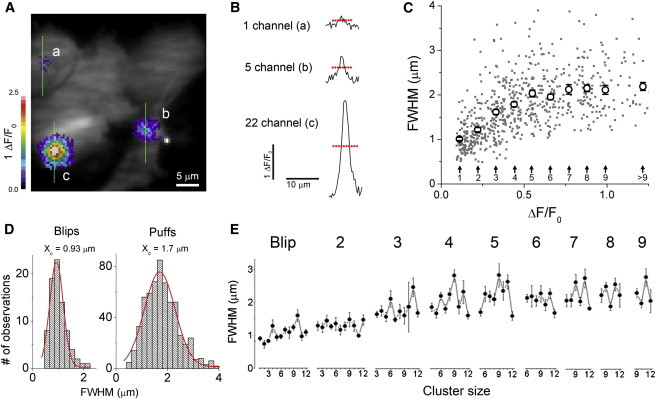
Dependence of spatial width (FWHM) of puffs on their amplitude. (A) Fluorescence image superimposing three puffs. Ca2+-fluorescence signals are depicted on a pseudocolor scale with “warmer” colors (grayscale in print) representing increasing ΔF/F0. Images of the puffs were separately captured at the times of their peaks and are superimposed on a grayscale image of resting fluorescence to show cell outlines. Vertical lines indicate the locations of 3-pixel-wide regions used to generate fluorescence profiles as shown in B. (B) Examples of Ca2+-fluorescence profiles taken at the times of peak fluorescence of the events, estimated to involve 1 (a), 5 (b), and ∼22 (c) open channels. Event widths were measured at half-maximum amplitude, as indicated by the dashed horizontal lines. (C) Scatter plot showing the relationship between puff width (FWHM) and puff amplitude. Individual events are depicted as gray dots, plotted as a function of ΔF/F0. Open circles show mean values pooled by the estimated number of channels open at the peak of the events. (D) Histograms showing the distributions of widths (FWHM) of blips (left, n = 80) and puffs (amplitudes ΔF/F0 0.165-2.54; right, n = 586). Curves are Gaussian fits. (E) Plots of mean event spatial widths (FWHM) as a function of cluster size, grouped by the estimated peak number of open channels during each event. To see this figure in color, go online.
We then examined whether cluster size affects the spatial width of the Ca2+ fluorescence signals, independently from the amplitude of any given event. Fig. 7 E shows plots of event widths (FWHM) as functions of cluster size, after grouping the data by event size (estimated peak number of channels open). Although our results show an increase in FWHM with event amplitude, there is little evidence of a systematic effect of cluster size on FWHM for puffs of any given amplitude. In particular, we expected that puffs involving two to four open channels would provide the most sensitive indicator, because these were observed across a wide range of cluster sizes and had mean widths below the maximal observed value of ∼2 μm. However, slopes of regression lines fitted to these data were not significantly different from zero.
Discussion
Puffs and blips are transient, localized elevations in cytosolic Ca2+ that arise from the coordinated openings of closely clustered IP3Rs (5,6). Acting as both local signals and as the initiators and building blocks of global calcium waves, these events are involved in a wide variety of disparate signaling processes (2,3). It is, therefore, important to understand the mechanisms underlying their generation, and the factors that determine their amplitudes, frequency, and kinetics. Recent improvements in imaging techniques enabling resolution of the contributions of individual IP3R channels during local Ca2+ events have greatly facilitated this aim (9,20). The observations indicate that puffs are initiated by Ca2+ released during the stochastic opening of an initial “trigger” channel, which then recruits neighboring channels in a cluster by CICR. We had previously shown that, in accordance with this simple model, the probability of puff triggering increases about linearly with the number of functional IP3Rs in a cluster (cluster size) (11). Here, we extended this analysis to consider the subsequent evolution of puffs, and in particular their dependence on cluster size.
Interchannel coupling
The strength of CICR to couple openings of IP3R channels within a cluster crucially determines whether opening of one channel will trigger a puff, and the number of channels activated during that puff. We estimated the strength of this interchannel coupling by measuring the proportion of events when opening of a channel failed to evoke opening of any further channel(s). At sites estimated to contain only two functional IP3Rs about one-third of events were blips (i.e., when only a single-channel opened), indicating a mean coupling probability of ∼66% between paired channels. At sites containing three channels, the proportion of blips further reduced to ∼12%, roughly as would be expected because opening of the initial channel would result in a puff if either (or both) of the remaining two channels opened. The proportion of blips decreased further at sites of yet greater cluster size, but their numbers became too small for accurate measurement. This estimate of coupling strength represents a mean value and will show considerable variability from event to event at a given site, depending both on the duration of the trigger channel opening and the stochastic probability of Ca2+-activation of neighboring channels. The mean coupling strength is also likely to vary systematically between puff sites, depending on the spatial proximity and location of channels within a cluster. For example, the initial opening of a channel in the center of a cluster would have a higher probability of triggering its closely adjacent neighbors than would a channel on the periphery with fewer neighbors.
Variability in puff amplitudes
In light of the relatively high coupling strength between IP3R channels, one might predict that events at larger cluster sizes would tend to show an all-or-none characteristic. The initial opening of a channel might fail to trigger other channels, resulting only in a blip; or the opening of a second channel would double the local Ca2+ concentration to further increase the probability of opening of a third channel, and that in turn would elevate local [Ca2+], leading to an explosively regenerative cycle until all available channels were open. Different from this, we had previously reported that puffs showed a wide distribution of amplitudes (9). However, the limited data set in those experiments required pooling data across a range of cluster sizes, thereby possibly blurring the true distribution. Our present results with a larger data set confirm that puff sites of a specific cluster size display a wide range of puff amplitudes, and indeed show an even more dispersed distribution than previously reported, with roughly equal proportions of events involving openings of one, two, three, etc., channels up to the maximum number of functional channels estimated to be at that site.
What then might underlie this wide variability in puff amplitudes? Solovey and Dawson (14) modeled the numbers of IP3R channels opening during puffs in terms of two stochastic processes; IP3 binding and unbinding, and Ca2+-mediated interchannel coupling. In addition to these factors, our observation that the first puff at a site is on average greater than succeeding puffs suggests that Ca2+-inhibition of IP3Rs during a puff and their subsequent recovery may further contribute to variability in puff amplitudes during a train of events. We evaluated the relative importance of Ca2+-inhibition by examining the amplitudes of the first puff evoked at a cluster following photorelease of IP3, arguing that few or no IP3R channels would be in a Ca2+-inactivated state because the initial events arose without any earlier elevation of cytosolic [Ca2+]. The first-puff amplitude distributions at sites of similar relative cluster size (grouped by mean amplitude of subsequent puffs at a site) were sharper than for corresponding all-puff distributions, which is consistent with the notion that fluctuations in the numbers of Ca2+-inhibited IP3Rs contribute to the variability in amplitudes of repetitive puffs in a train. However, the distributions of first-puff amplitudes still showed appreciable variability, and approximated Poisson functions.
Remaining factors that might then account for the variability of first-puff amplitudes include stochastic variation in the numbers of IP3-bound, activatable IP3Rs; Ca2+-inhibition of receptors during the rising phase of puffs; and stochastic variation in the numbers of channels triggered by CICR. Our results lead to conflicting conclusions regarding the relative importance of these mechanisms. On the one hand, it seems that stochastic variation in the number of IP3-bound receptors would be unlikely to be an important factor in the variability of puff amplitudes under our experimental conditions because the photolysis flash durations (60 to 200 ms) were all sufficient to evoke maximal responses. Specifically, we found no significant increase in mean amplitude or decrease in variability (standard deviation) of puffs on increasing the flash duration from 60 to 200 ms. Thus, IP3-binding sites might be expected to have been almost fully occupied so that nearly all functional IP3Rs in a cluster would be in an activatable state. On the other hand, we observed a clear negative correlation between first-puff amplitude and latency, which may be interpreted as evidence for variability in numbers of activatable receptors. We had shown (11) that the mean first-puff latency shortens with increasing cluster size, and concluded that the latency is inversely proportional to the number of activatable channels, each of which has an equal probability of opening to trigger a puff. Thus, our present finding that short latency puffs have, on average, larger amplitudes suggests that some of the variability in puff amplitudes could be attributable to variations in numbers of IP3-bound, activatable IP3Rs.
Interactions between successive puffs
To further examine the extent to which Ca2+-inactivation of IP3Rs during a puff may affect the amplitude and timing of a subsequent puff, we looked for correlations between pairs of successive puffs during a train. A simple model (13) posits that the number of IP3Rs in a cluster that become Ca2+-inactivated during a puff is proportional to the puff amplitude (local [Ca2+] elevation), and that IP3Rs subsequently recover from inactivation with some given time course after [Ca2+] has returned to near basal levels. Concordant with this, the distribution of interpuff intervals showed an increasing number of puffs per unit time as IP3Rs recovered from inactivation and became “activatable,” followed by an exponentially decaying occurrence of puffs, consistent with a constant probability of stochastic triggering after receptors have reverted to an activatable state (Fig. 5 A; and see (19)). Thus, interpuff intervals following large puffs are predicted, on average, to be more prolonged, and the average size of a following puff is expected to increase with increasing interpuff interval. In agreement, this trend had been observed in records of puffs in Xenopus oocytes, although that data set was too small to reveal the precise relationship (13). We now show a strong dependence of interpuff interval on amplitude of the preceding puff (on average lengthening ∼two-fold for a four-fold increase in puff amplitude), and a weaker dependence of second puff amplitude on preceding interpuff interval (increasing by ∼20% for a 10-fold increase in interval). On the other hand, we found no significant correlation between the amplitude of a puff and that of its preceding puff. This may be explained if a second puff is triggered, on average, after a fixed fraction of IP3Rs in a cluster have recovered from inactivation. For example, a larger fraction of IP3Rs would be inhibited immediately following a large puff than after a small puff, but the succeeding interpuff interval would be longer, allowing more time for those IP3Rs to recover. The net result would be that interactions between successive puffs do not introduce any appreciably systematic puff-to-puff variability in amplitudes. However, stochastic variation in the number of inhibited receptors at the time a puff is triggered would still contribute to increased variability as compared with the initial puff in a train.
Temporal and spatial properties of puffs
Recruitment of a single additional channel following opening of an initial triggering IP3R channel to generate a two-channel puff took around 20 to 30 ms, but that delay lengthened only slightly for puffs involving three or four channels, and for larger puffs was independent of how many channels opened. Thus, the recruitment of channels during the rising phase of puffs does not progress sequentially, one-by-one. Instead, the increased local [Ca2+] once two or three channels are opened appears to cause rapid and near simultaneous opening of further channels during larger puffs.
The spatial spread of the local fluorescence signal resulting from Ca2+ entering the cytosol from a point source is determined by multiple factors including diffusion; the binding of Ca2+ to endogenous and exogenous buffers; and optical blurring by the microscope (21). Model simulations indicate that the extent of this spread increases with increasing Ca2+ flux (22). Consistent with this, we observed a graded increase in mean puff width (FWHM) with puffs of increasing amplitude. Simulations further demonstrate that the spatial spread becomes more extended if the Ca2+ arises not from a point source (such as a single channel), but from multiple channels distributed throughout a cluster of finite dimensions (22). By comparing model simulations with experimental data we had previously concluded that the spread of puffs in Xenopus oocytes was incompatible with a point source of Ca2+, but instead suggested that puffs involved several IP3R channels distributed through clusters a few hundred nm across (22). We now hoped to obtain a more direct estimate of the dimensions of IP3R clusters in SH-SY5Y cells by examining whether puff widths correlated with the number of functional IP3Rs present in a cluster, independent of the amplitude of the puff (i.e., the number of channels that actually opened). For example, a puff involving opening of four channels scattered among a larger cluster of 12 channels might be expected to have a wider spread than a puff of the same amplitude that arose from a more tightly grouped cluster containing only four channels. However, our results revealed no consistent relationship between cluster size and puff width. At present we do not know whether this is simply because cluster dimensions are below the resolution of our measurements, or whether puffs that involve only a fraction of the channels at a site may be restricted to a tight subgroup of IP3Rs rather than recruiting receptors dispersed throughout a more extensive cluster.
Summary
Based on the data presented in this study, together with previous findings, we describe a model for Ca2+ puff evolution in which the stochastic opening of an initial “trigger” channel within a preestablished cluster of IP3R channels has an average 66% chance of activating each neighboring channel. The probability of observing a puff (concerted openings of ≥ two channels), and hence puff frequency, therefore increase proportionally with cluster size. After the initial triggering, CICR leads to the rapid, explosive activation of other channels within the cluster. However, despite the expectation that this regenerative process would recruit all available channels in a cluster, puff amplitudes at a given site exhibit wide variability. Although we observed correlations between the amplitudes and intervening intervals between successive puffs that likely arose from Ca2+-inhibition of IP3Rs, this did not result in any systematic variation in puff amplitudes, and the factors underlying the stochastic variability in puff amplitudes remain to be fully elucidated.
Acknowledgments
This work was supported by grants (GM048071 and GM065830) from the National Institutes of Health.
References
- 1.Berridge M.J. Elementary and global aspects of calcium signalling. J. Physiol. 1997;499:291–306. doi: 10.1113/jphysiol.1997.sp021927. [DOI] [PMC free article] [PubMed] [Google Scholar]
- 2.Bootman M.D., Berridge M.J., Lipp P. Cooking with calcium: the recipes for composing global signals from elementary events. Cell. 1997;91:367–373. doi: 10.1016/s0092-8674(00)80420-1. [DOI] [PubMed] [Google Scholar]
- 3.Berridge M.J., Lipp P., Bootman M.D. The versatility and universality of calcium signalling. Nat. Rev. Mol. Cell Biol. 2000;1:11–21. doi: 10.1038/35036035. [DOI] [PubMed] [Google Scholar]
- 4.Foskett J.K., White C., Mak D.O. Inositol trisphosphate receptor Ca2+ release channels. Physiol. Rev. 2007;87:593–658. doi: 10.1152/physrev.00035.2006. [DOI] [PMC free article] [PubMed] [Google Scholar]
- 5.Parker I., Yao Y. Ca2+ transients associated with openings of inositol trisphosphate-gated channels in Xenopus oocytes. J. Physiol. 1996;491:663–668. doi: 10.1113/jphysiol.1996.sp021247. [DOI] [PMC free article] [PubMed] [Google Scholar]
- 6.Yao Y., Choi J., Parker I. Quantal puffs of intracellular Ca2+ evoked by inositol trisphosphate in Xenopus oocytes. J. Physiol. 1995;482:533–553. doi: 10.1113/jphysiol.1995.sp020538. [DOI] [PMC free article] [PubMed] [Google Scholar]
- 7.Dawson S.P., Keizer J., Pearson J.E. Fire-diffuse-fire model of dynamics of intracellular calcium waves. Proc. Natl. Acad. Sci. USA. 1999;96:6060–6063. doi: 10.1073/pnas.96.11.6060. [DOI] [PMC free article] [PubMed] [Google Scholar]
- 8.Rose H.J., Dargan S., Parker I. ‘Trigger’ events precede calcium puffs in Xenopus oocytes. Biophys. J. 2006;91:4024–4032. doi: 10.1529/biophysj.106.088872. [DOI] [PMC free article] [PubMed] [Google Scholar]
- 9.Smith I.F., Parker I. Imaging the quantal substructure of single IP3R channel activity during Ca2+ puffs in intact mammalian cells. Proc. Natl. Acad. Sci. USA. 2009;106:6404–6409. doi: 10.1073/pnas.0810799106. [DOI] [PMC free article] [PubMed] [Google Scholar]
- 10.Thomas D., Lipp P., Bootman M.D. Hormone-evoked elementary Ca2+ signals are not stereotypic, but reflect activation of different size channel clusters and variable recruitment of channels within a cluster. J. Biol. Chem. 1998;273:27130–27136. doi: 10.1074/jbc.273.42.27130. [DOI] [PubMed] [Google Scholar]
- 11.Dickinson G.D., Swaminathan D., Parker I. The probability of triggering calcium puffs is linearly related to the number of inositol trisphosphate receptors in a cluster. Biophys. J. 2012;102:1826–1836. doi: 10.1016/j.bpj.2012.03.029. [DOI] [PMC free article] [PubMed] [Google Scholar]
- 12.Smith I.F., Wiltgen S.M., Parker I. Localization of puff sites adjacent to the plasma membrane: functional and spatial characterization of Ca2+ signaling in SH-SY5Y cells utilizing membrane-permeant caged IP3. Cell Calcium. 2009;45:65–76. doi: 10.1016/j.ceca.2008.06.001. [DOI] [PMC free article] [PubMed] [Google Scholar]
- 13.Fraiman D., Pando B., Dawson S.P. Analysis of puff dynamics in oocytes: interdependence of puff amplitude and interpuff interval. Biophys. J. 2006;90:3897–3907. doi: 10.1529/biophysj.105.075911. [DOI] [PMC free article] [PubMed] [Google Scholar]
- 14.Solovey G., Dawson S.P. Intra-cluster percolation of calcium signals. PLoS ONE. 2010;5:e8997. doi: 10.1371/journal.pone.0008997. [DOI] [PMC free article] [PubMed] [Google Scholar]
- 15.Iino M. Biphasic Ca2+ dependence of inositol 1,4,5-trisphosphate-induced Ca release in smooth muscle cells of the guinea pig taenia caeci. J. Gen. Physiol. 1990;95:1103–1122. doi: 10.1085/jgp.95.6.1103. [DOI] [PMC free article] [PubMed] [Google Scholar]
- 16.Bezprozvanny I., Watras J., Ehrlich B.E. Bell-shaped calcium-response curves of Ins(1,4,5)P3- and calcium-gated channels from endoplasmic reticulum of cerebellum. Nature. 1991;351:751–754. doi: 10.1038/351751a0. [DOI] [PubMed] [Google Scholar]
- 17.Finch E.A., Turner T.J., Goldin S.M. Calcium as a coagonist of inositol 1,4,5-trisphosphate-induced calcium release. Science. 1991;252:443–446. doi: 10.1126/science.2017683. [DOI] [PubMed] [Google Scholar]
- 18.Parker I., Ivorra I. Inhibition by Ca2+ of inositol trisphosphate-mediated Ca2+ liberation: a possible mechanism for oscillatory release of Ca2+ Proc. Natl. Acad. Sci. USA. 1990;87:260–264. doi: 10.1073/pnas.87.1.260. [DOI] [PMC free article] [PubMed] [Google Scholar]
- 19.Thurley K., Smith I.F., Falcke M. Timescales of IP(3)-evoked Ca(2+) spikes emerge from Ca(2+) puffs only at the cellular level. Biophys. J. 2011;101:2638–2644. doi: 10.1016/j.bpj.2011.10.030. [DOI] [PMC free article] [PubMed] [Google Scholar]
- 20.Demuro A., Parker I. “Optical patch-clamping”: single-channel recording by imaging Ca2+ flux through individual muscle acetylcholine receptor channels. J. Gen. Physiol. 2005;126:179–192. doi: 10.1085/jgp.200509331. [DOI] [PMC free article] [PubMed] [Google Scholar]
- 21.Shuai J., Parker I. Optical single-channel recording by imaging Ca2+ flux through individual ion channels: theoretical considerations and limits to resolution. Cell Calcium. 2005;37:283–299. doi: 10.1016/j.ceca.2004.10.008. [DOI] [PubMed] [Google Scholar]
- 22.Shuai J., Rose H.J., Parker I. The number and spatial distribution of IP3 receptors underlying calcium puffs in Xenopus oocytes. Biophys. J. 2006;91:4033–4044. doi: 10.1529/biophysj.106.088880. [DOI] [PMC free article] [PubMed] [Google Scholar]