

Abstract
Determination of the absolute configuration (AC) is often a challenging aspect in the structure elucidation of natural products. When chiral compounds possess appropriate chromophore(s), electronic circular dichroism (ECD) may provide a powerful approach to the determination of their absolute configuration. Recently, ECD calculations by time-dependent density functional theory (TDDFT) have come to be used more commonly. In the present review, we give several examples of recent studies using TDDFT-calculated ECD spectra for the AC determination of natural products.
Keywords: Circular dichroism, Absolute configuration, Density functional theory
Introduction
Determination of the absolute configuration (AC) of natural products often poses a challenging problem in structure elucidation. There are various approaches to the solution of the problem, e.g., X-ray crystallography, chiroptical methods, and NMR anisotropy methods, each with its own limitations. When chiral compounds possess appropriate chromophore(s), electronic circular dichroism (ECD) may provide a powerful approach to the determination of their AC. In general, AC determination using ECD compares the spectrum of a new compound having unknown AC to those of analogous compounds of known AC. However, AC determination by predicting the sign of one or more bands in the ECD spectrum by using empirical, semi-empirical or non-empirical rules may be an option. Another option, which has become more widely used in the past 10 years, is to compare calculated and experimental ECD spectra.
ECD calculations have been used for the determination of ACs of natural products for decades, as seen in the π-SCF studies of ECD by Mason and coworkers [1]. However, its use was quite limited until the major advancement in ECD calculations of time-dependent density functional theory (TDDFT) was introduced, which resulted in a good compromise between computational costs and accuracy [2–10]. The principle of the determination of the ACs of natural products by ECD calculation is relatively simple: basically, calculated ECD spectra are compared with experimental ECD spectra. If the two data sets are very similar to each other, then highly reliable assignment is obtained. In the present review, we briefly explain the method of TDDFT calculation of ECD spectra and give several examples of its successful application to the determination of the AC of natural products, including our own previous works. There are hundreds of publications using TDDFT-calculated ECD spectra for the AC assignment of a broad range of compounds, and examples were selected from recently published studies, especially those from 2012.
Computational methods
ECD calculations generally involve two steps, first the conformational analysis of the compound to obtain the possible conformer(s), and second, the UV/ECD TDDFT calculation of each conformer(s). The conformational analysis is often done by Monte Carlo methods using molecular mechanics (MMFF94, etc.) and/or semi-empirical methods (AM1, etc.) for the relative energy evaluation of the conformers. The resulting conformers are then optimized further using density functional theory (DFT) methods before being subjected to the TDDFT calculations of the UV/ECD by using programs such as Gaussian [11], TURBOMOLE [12], or NWChem [13]. To obtain the calculated UV/ECD spectra of the isomers, the UV/ECD spectra of the conformers are Boltzmann averaged. The averaged UV spectra are then shifted to conform to the experimental UV spectrum and the same shifts are also applied to the corresponding calculated ECD spectra before comparing the calculated ECD spectra with the experimental ECD of the natural product in question. The calculation steps are summarized in Fig. 1.
Fig. 1.
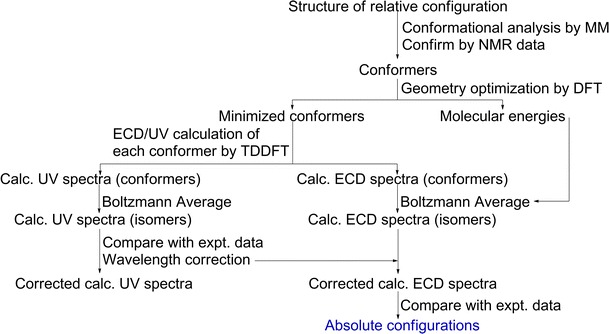
Steps for electronic circular dichroism (ECD) calculation by time-dependent density functional theory (TDDFT)
The accuracy of TDDFT calculations itself depends mainly on the basis set and functional used for the calculations. Use of a larger basis set generally increases the accuracy, but it also increases the computational time required. In ECD calculations, basis sets with polarization and diffuse functions, such as 6-31G* or aug-cc-pVDZ, and the B3LYP functional are commonly used and give satisfactory results [14]. The ECD calculation level is often expressed as [Functional 1]/[Basis set 1]//[Functional 2]/[Basis set 2], which means that the ECD calculation was performed using Functional 1 and Basis set 1 on a geometry optimized by using Functional 2 and Basis set 2.
The results of TDDFT calculations of UV/ECD are excitation energies, and their corresponding oscillator strength and rotatory strength. The oscillator strengths are used to simulate the UV curve, and rotatory strengths to simulate the ECD curve. Both oscillator strength and rotatory strength can be calculated using either dipole–velocity gauge or dipole–length gauge, but the use of dipole–length gauge generally gives better results [3, 15]. To take the solvent effect into account, a COnductor-like continuum Solvent MOdel (COSMO) can also be employed [16, 17].
The calculated rotatory strength values are generally converted to the line-shaped ECD curve using a Gaussian distribution function:
 |
1 |
where σ is the wavenumber (in cm−1),  is half of the width of the band at 1/e peak-height, and σi and Ri the excitation wavenumber and rotatory strength for transition i, respectively [18]. The value of
  can be evaluated from the corresponding UV spectrum, and is typically in the range of 0.05–0.4 eV. The use of Lorentzian distribution to simulate ECD curves has also been reported by using the function:
 |
2 |
where γ represents half the width of the band at half peak-height [18–22].
Use of TDDFT calculation of ECD spectra for the AC determination of natural products
This section gives examples where the TDDFT calculation of ECD was used for the AC determination of natural products. The examples include alkaloids, terpenoids, coumarins, anthraquinones, and other types of compounds, ranging from conformationally rigid to highly flexible compounds.
Alkaloids
Eucophylline [23]
Eucophylline (1), isolated from Leuconotis griffithii [23], has only one chiral center at C-20. Conformational analysis (MMFF94 force field, 50 kJ/mol window) generated conformations that can be divided into two groups: one group with the piperidine ring in a chair form, and the other with the ring in a boat form. Members of the same group differ in the three-dimensional (3D) location of the ethyl moiety at C-20 and the vinyl moiety at C-4. The group with the piperidine ring in chair form was predicted to be dominant, which agreed with NMR data (Fig. 2). The ECD spectra were calculated at the BP86/aug-cc-pVDZ//BP86/SVP and B3LYP/TZVPP//B3LYP/TZVPP level on two stable conformers differing in the location of the vinyl group because changes in the location of the ethyl moiety were expected to have no effect on the calculated ECD spectra. The ECD spectra for the two conformers were Boltzmann-averaged to obtain the ECD spectrum of the isomers. The two calculation levels lead to the same conclusion that the AC at C-20 of 1 was R. Of the calculation levels, the BP86/aug-cc-pVDZ//BP86/SVP calculated ECD spectrum matched the experimental spectrum well, but in the B3LYP/TZVPP//B3LYP/TZVPP calculated spectrum, the first and second cotton effects (CEs) apparently overlapped (Fig. 3).
Fig. 2.
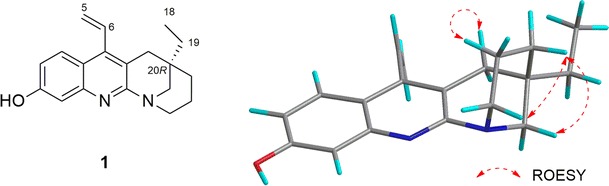
Structure and selected ROESY (rotating-frame nuclear Overhauser effect correlation spectroscopy) correlations for eucophylline (1)
Fig. 3.
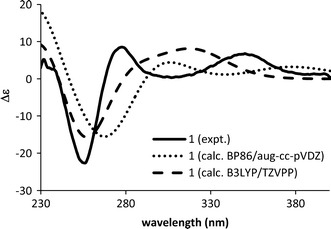
Calculated (20R) and experimental ECD spectra of eucophylline (1)
Leucomidines A and B [24]
Leucomidines A and B (2 and 3, Fig. 4) are indole alkaloids also isolated from L. griffithii [24]. Conformational analysis (MMFF94 force field, 50 kJ/mol window) for both 2 and 3 generated conformers differing only in the orientation of the side chain at C-20. The ECD spectra of the most stable conformation for 2 and 3 were each calculated at BP86/aug-cc-pVDZ//BP86/SVP and B3LYP/TZVPP//B3LYP/TZVPP levels. Both levels gave the same conclusion that both 2 and 3 had the 20R,21S configuration. In the case of 2, however, the B3LYP/TZVPP//B3LYP/TZVPP-calculated ECD spectrum agreed with the experimental ECD spectrum better than that calculated by BP86/aug-cc-pVDZ//BP86/SVP (Fig. 5). It is to be noted that the calculated ECD spectrum for 3dis (Fig. 5)—a model compound for 3 in which the side chain at C-20 was substituted with a methylgroup—reproduced the experimental ECD spectrum better.
Fig. 4.
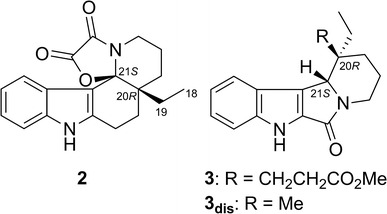
Structures of leucomidines A (2) and B (3)
Fig. 5.
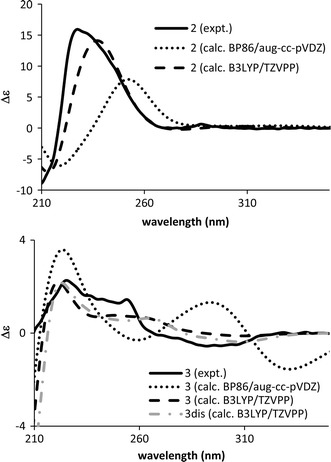
Calculated (20R,21S) and experimental ECD spectra of leucomidines A (2) and B (3)
Rupestines F–M [25]
Rupestines F–M (4–11, Fig. 6) are guaipyridine alkaloids isolated from Artemisia rupestris [25]. Of those eight compounds, 5–11 showed the CE at about 270 nm in the experimental ECD spectra, which can be attributed to transition of the pyridine moiety. To study the effect of conformation on the CE sign at 270 nm, the ECD spectra of possible conformations of 10, 11 and a model compound, 2-methylpyridinecycloheptene (12), were calculated (Figs. 7, 8). The calculation results may be summarized as follows, (1) B3LYP/TZVPP calculations overestimated the excitation energy of pyridine’s first absorption band (calc. ~250 nm vs expt. ~270 nm), so that the calculated CE at around 250 nm are observed experimentally at around 270 nm; (2) when the plane of C-6, C-7, and C-8 was over the pyridine ring, a positive CE at around 215 nm and a negative CE at around 250 nm were observed regardless of the chirality at C-5. Thus, by using the CE sign at around 270 nm, the absolute structure of the molecules can be deduced or the AC at C-8 of 5–11 could be assigned accordingly; 5–11 were shown to possess the same 8S configuration.
Fig. 6.
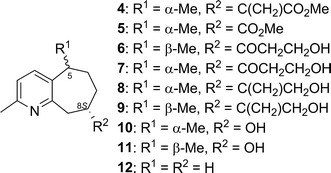
Structures of rupestines F–M (4–11) and 2-methylpyridinecycloheptene (12)
Fig. 7.
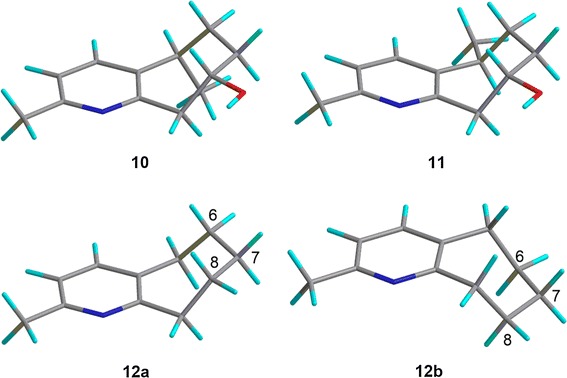
Calculated conformations of model compounds
Fig. 8.
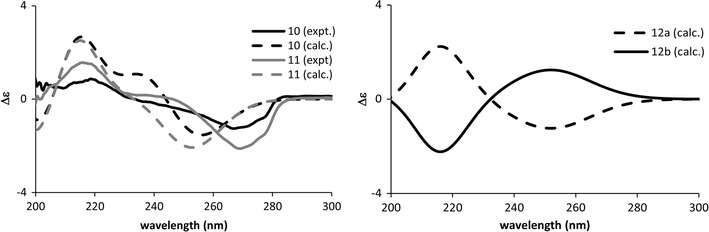
Calculated circular dichroism (CD) spectra of model compounds together with the experimental CD spectra of rupestines L (10) and M (11)
The ECD spectrum of 4 is different from those of 5–11. By comparing the ECD spectrum calculated at B3LYP/TZVPP//B3LYP/TZVPP level with the experimental spectrum (Fig. 9), the AC of 4 was assigned as 5S,8S.
Fig. 9.
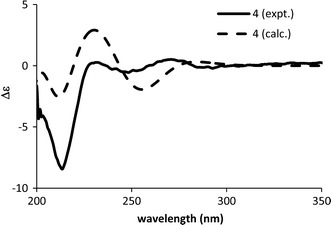
Calculated (5S,8S) and experimental ECD spectra of rupestine F (4)
Bisnicalaterines B and C [26]
Bisnicalaterines B and C (13 and 14) are rotamers isolated from Hunteria zeylanica [26]. By changing the dihedral angle N-1–C-16–C-9′–C-10′, two stable conformations were obtained, one corresponding to the structure of 13 and the other to that of 14 (Fig. 11). Monte Carlo conformational analysis (MMFF94 force field, 50 kJ/mol window) of each structure generated conformers differing only in conformation at C-20 (ethyl group, C-18 and C-19) and/or at C-15′ (hydroxyethyl group, C-16′ and C-17′), which should have little or no effect on the calculated ECD spectra. Thus, the ECD calculation was performed at BP86/aug-cc-pVDZ//BP86/SVP level only for the most stable conformation of 13 and 14. The calculated and experimental ECD spectra for 13 and 14 are shown in Fig. 12, suggesting their AC to be as shown in Fig. 10.
Fig. 11.
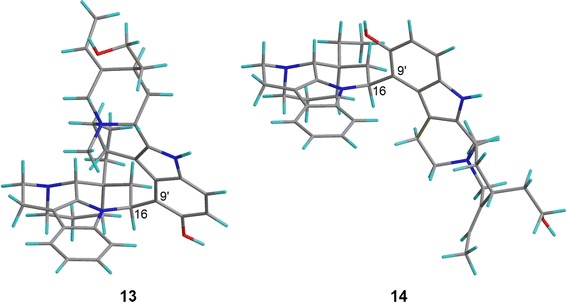
3D structures of bisnicalaterines B (13) and C (14)
Fig. 12.
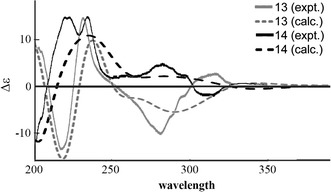
Calculated (16S,20R,21R,3′R,15′R) and experimental ECD spectra of bisnicalaterines B (13) and C (14)
Fig. 10.
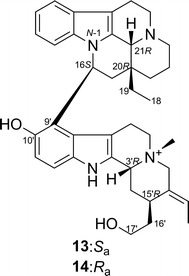
Structures of bisnicalaterines B (13) and C (14)
Schizozygine [27]
Schizozygine (15) is an alkaloid isolated from Schizozygia caffaeoides [28]. Monte Carlo conformational search by using MMFF94 force field for the energy evaluation generated two stable conformations within the 20 kcal/mol window. The two conformations were then re-optimized at the B3LYP/6-31G* level, and the results were subjected to a potential energy scan (PES) at the B3LYP/6-31G* level. By varying the dihedral angle C-9–C-10–O–C-24 of both of the conformations, two additional conformations were identified. The ECD calculations for all four conformers were done at the B3LYP/aug-cc-pVDZ//B3LYP/6-31G*, B3LYP/aug-cc-pVDZ//B3LYP/TZ2P, and B3LYP/aug-cc-pVDZ//B3PW1/TZ2P levels. For each conformer, calculations at all three levels gave similar results. The ECD spectra were Boltzmann-averaged, and the resulting ECD spectrum agreed well with the experimental ECD spectrum. The AC of 15 was assigned as shown in Fig. 13 [27].
Fig. 13.
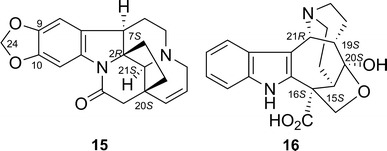
Structures of schizozygine (15) and actinophyllic acid (16)
Actinophyllic acid [29]
The AC of actinophyllic acid (16)—an alkaloid isolated from Alstonia actinophylla [30]—was assigned as shown in Fig. 13 indirectly on the basis of its methyl ester derivative because of the expected complication due to the presence of the carboxylic acid group [29]. A preliminary conformational search (MMFF94) gave two stable conformers within a 10-kcal/mol window. Of the ECD spectra calculated at B3LYP/6-31G(d,p)//B3LYP/6-31G(d,p) and B3LYP/aug-cc-pVDZ//B3LYP/6-31G(d,p) levels, the one calculated at the B3LYP/6-31G(d,p) level generally agreed well with the experimental ECD spectrum, but did not give the negative shoulder at around 230 nm. On the other hand, the B3LYP/aug-cc-pVDZ-calculated ECD spectrum clearly reproduced the negative shoulder around 230 nm, but the region around 250 nm became slightly positive.
Mariline A1 and A2 [31]
Mariline A1 (17) and A2 are enantiomeric phthalimidines isolated from sponge-derived fungus Stachylidium sp. [31]. Detailed investigation of the highly flexible conformations of 17 was carried out at the B3LYP/SV(P) level, yielding more than 550 conformers. ECD calculations were performed at the B3LYP/SV(P) level with the COSMO model. Comparison of the calculated ECD spectra with the experimental spectrum did not allow an unambiguous assignment of the AC. Almeida and coworkers [31] associated the problem with dispersion effects caused by the highly flexible alkoxy side chain. Instead of using a dispersion-corrected functional in combination with a larger basis set to perform a DFT optimization of the conformations, they used single-point energy calculations for all previously DFT-optimized structures at the RI-SCS-MP2/TZVPP level since a very accurate valuation of the energies for the Boltzmann weighting for such a high number of conformers was indispensable. Boltzmann weighting with these more reliable energy values yielded a significantly improved overall ECD spectrum, which almost agreed with the experimental one. Thus the AC of 17 was determined to be as shown in Fig. 14.
Fig. 14.
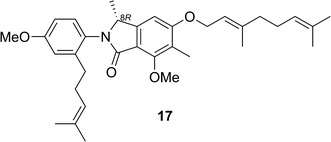
Structure of mariline A1 (17)
Chaetoglobosin Vb [32]
Chaetoglobosin Vb (18)—a cytochalasan alkaloid—was isolated from Chaetomium globosum [32]. Xue and coworkers performed a TDDFT ECD calculation [B3LYP/6-311 + G(d,p)//B3LYP/6-311 + G(d,p)] using a model compound of 18 in which the 3-methylindole moiety was replaced by a hydrogen atom. They considered that the 3-methylindole ring should contribute only weakly to the observed ECD spectrum of 18 in the long-wavelength region, because (1) it is connected to the chiral skeleton by two flexible bonds; (2) it is quite distant from the other chromophores in the molecule, especially the cyclopentenone; and (3) its transitions above 220 nm are either very weak or directed roughly perpendicular to the C-3′/C-10 bond; so its coupling with other chromophores should be near zero. The use of this model compound simplified ECD calculations, since it gives only two conformers to be considered for the calculations. Based on the calculation results, the AC of 18 was suggested to be as shown in Fig. 15.
Fig. 15.
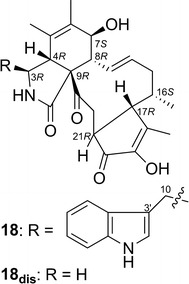
Structure of chaetoglobosin Vb (18)
Terpenoids
Chisomicine A [33] and sanjecumin B [34]
Chisomicine A (19) [33] and sanjecumin B (20) [34] are limonoids isolated from Chisocheton ceramicus (Meliaceae), and from Sandoricum koetjape (Meliaceae), respectively. ECD calculations by TDDFT suggested the ACs of 19 and 20 to be as shown in Fig. 16. Calculations were performed at B3LYP/SVP//B3LYP/SVP level and at BP86/aug-cc-pVDZ//BP86/SVP level for chisomicine A and sanjecumin B, respectively. The calculated ECD spectra are shown in Fig. 17 along with the experimentally obtained spectra.
Fig. 16.
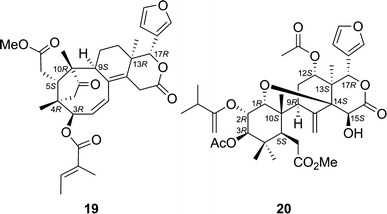
Structures of chisomicine A (19) and sanjecumin B (20)
Fig. 17.
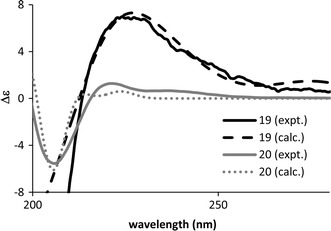
Calculated (17R) and experimental ECD spectra of chisomicine A (19) and sanjecumin B (20)
Ximaolides [35]
Ximaolides, including ximaolide A (21, Fig. 18), are a series of bis-cembrane diterpenoids obtained from the Hainan soft coral Sarcophyton tortuosum [36, 37]. Kurtán and coworker [35] assigned the AC of 21 by comparing the solid-state ECD spectrum of 21 with the TDDFT-calculated ECD spectrum of the solid-state geometry obtained from X-ray crystallography analysis. By this method, they managed to reduce the number of input conformers for the ECD calculation of this highly flexible compound to only one, and thus the AC of 21 was determined as shown in Fig. 18.
Fig. 18.
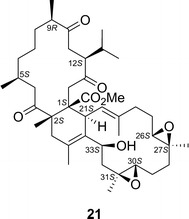
Structure of ximaolide A (21)
Coumarins
5-O-methyldiphysin and 5,5″-di-O-methyldiphysin [38]
Bis-dihydrocoumarins, 5-O-methyldiphysin (22) [38] and 5,5″-di-O-methyldiphysin [39] were isolated from Ormocarpum kirkii. By using the non-empirical aromatic quadrant rule [40]. Dhooghe and coworkers [39] assigned the AC of 5,5″-O-dimethyldiphysin to be of the 3R,4S,3″R,4″S configuration. However, Xu and coworkers [38] showed that the TDDFT ECD calculation of (3S,4R,3″S,4″R)-22 in both gas and solution phases [(B3LYP/6-31G(d,p)//B3LYP/6-31G(d,p)] produced an ECD spectrum quite similar to the reported experimental spectrum of 5,5″-di-O-methyldiphysin, indicating that the non-empirical aromatic quadrant rule is not appropriate for defining the AC of C-4 of this class of compounds (Fig. 19).
Fig. 19.
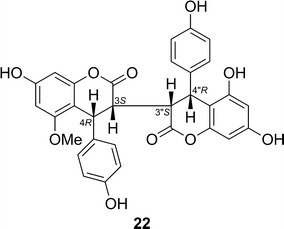
Structure of 5-O-methyldiphysin (22)
Anthraquinones
Altersolanol N [41]
Altersolanol N (23) is an anthraquinone derivative isolated from Stemphylium globuliferum—an endophytic fungus isolated from Mentha pulegium (Lamiaceae) [41]. First, DFT minimizations were executed at B3LYP/6-31G(d) level, and all the resulting DFT minima with relative internal energies within 10 kcal/mol were reoptimized at the B3LYP/6-311G + (d,p) level with the polarizable continuum model (PCM) for acetonitrile. For the TDDFT ECD calculations, a preliminary screening of various functionals (B3LYP, CAM-B3LYP, BH&HLYP, PBE0) and basis sets (SVP, TZVP, aug-TZVP) showed that CAM-B3LYP provided the best result, and the results obtained by the use of the smallest basis set used (SVP) was compatible with those obtained by the use of larger ones. Therefore, the CAM-B3LYP/SVP combination was chosen for the final calculations, which determined the AC of 23 to be as shown in Fig. 20.
Fig. 20.
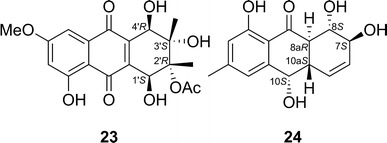
Structures of altersolanol N (23) and coniothyrinone A (24)
Coniothyrinone A [42]
Coniothyrinone A (24), an anthraquinone derivative, was isolated from Coniothyrium sp.—an endophytic fungus isolated from Salsola oppositifolia [42]. The TDDFT ECD calculations were performed using the TZVP basis set and three functionals (B3LYP, BH&HLYP, CAM-B3LYP) and all of them produced ECD spectra that agreed well with the experimental ECD spectrum; the use of CAM-B3LYP gave the best agreement. Thus, the AC of 24 was assigned to be as shown in Fig. 20.
Others
Phomopsinones A–D [43]
Phomopsinones A–D (25–28) were obtained from an endophytic strain of Phomopsis sp., isolated from the halotolerant plant Santolina chamaecyparissus [43]. Hussain and coworkers used (S)-4-methoxy-7-methyl-7,8-dihydropyrano[4,3-b]pyran-2(5H)-one (29) as a model compound to find the best functional and basis set level for ECD calculations. The DFT optimized geometry [B3LYP/6-31G(d)] with equatorial 7-methyl was used as input in TDDFT ECD calculations with various combinations of hybrid functionals (CAM-B3LYP, B3LYP, PBE0) and basis sets (SVP, TZVP, aug-TZVP). The calculated ECD spectra for 29 were then compared with the experimental ECD spectrum of 25. The long-range functional CAM-B3LYP gave the best agreement, and all the basis sets performed similarly. Thus, the CAM-B3LYP/SVP combination was employed in subsequent ECD calculations of 25, 26, and 28 to assign their ACs to be as shown in Fig. 21.
Fig. 21.
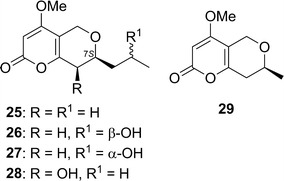
Structures of phomopsinones A–D (25–28) and (S)-4-methoxy-7-methyl-7,8-dihydropyrano[4,3-b]pyran-2(5H)-one (29)
Conclusion
TDDFT calculation of ECD simplified the interpretation of the ECD–AC relationship and is a promising tool for the AC determination of natural products with chiral centers. Successful application of TDDFT calculations of ECD spectra to the AC determination of various type of natural products, ranging from conformationally rigid to highly flexible compounds, are exemplified in this review. Further improvements both in the computer system technologies and TDDFT, may make the TDDFT calculation of ECD an integral part of the AC determination of natural products.
Acknowledgment
Our isolation work was supported by a Grant-in-Aid for Scientific Research from the Ministry of Education, Culture, Sports, Science, and Technology of Japan.
References
- 1.Brickell WS, Mason SF, Roberts DR (1971) [π]-SCF studies of the circular dichroism and electronic spectra of alkaloids containing the aniline chromophore. The stereochemical configuration of calycanthine and caracurine-II. J Chem Soc B 1971:691–695
- 2.Li X-C, Ferreira D, Ding Y. Determination of absolute configuration of natural products. Curr Org Chem. 2010;14:1678–1697. doi: 10.2174/138527210792927717. [DOI] [PMC free article] [PubMed] [Google Scholar]
- 3.Diedrich C, Grimme S. Systematic investigation of modern quantum chemical methods to predict electronic circular dichroism spectra. J Phys Chem A. 2003;107:2524–2539. doi: 10.1021/jp0275802. [DOI] [Google Scholar]
- 4.Stephens PJ, McCann DM, Butkus E, Stoncius S, Cheeseman JR, Frisch MJ. Determination of absolute configuration using concerted ab initio DFT calculations of electronic circular dichroism and optical rotation: bicyclo[3.3.1]nonane diones. J Org Chem. 2004;69:1948–1958. doi: 10.1021/jo0357061. [DOI] [PubMed] [Google Scholar]
- 5.Stephens PJ, McCann DM, Devlin FJ, Cheeseman JR, Frisch MJ. Determination of the absolute configuration of [32](1,4)barrelenophanedicarbonitrile using concerted time-dependent density functional theory calculations of optical rotation and electronic circular dichroism. J Am Chem Soc. 2004;126:7514–7521. doi: 10.1021/ja049185q. [DOI] [PubMed] [Google Scholar]
- 6.Schühly W, Crockett SL, Fabian WMF. Hyperolactone C: determination of its absolute configuration by comparison of experimental and calculated CD spectra. Chirality. 2005;17:250–256. doi: 10.1002/chir.20164. [DOI] [PubMed] [Google Scholar]
- 7.McCann DM, Stephens PJ. Determination of absolute configuration using density functional theory calculations of optical rotation and electronic circular dichroism: chiral alkenes. J Org Chem. 2006;71:6074–6098. doi: 10.1021/jo060755+. [DOI] [PubMed] [Google Scholar]
- 8.Crawford TD, Tam MC, Abrams ML. The current state of ab initio calculations of optical rotation and electronic circular dichroism spectra. J Phys Chem A. 2007;111:12057–12068. doi: 10.1021/jp075046u. [DOI] [PubMed] [Google Scholar]
- 9.Stephens PJ, Devlin FJ, Gasparrini F, Ciogli A, Spinelli D, Cosimelli B. Determination of the absolute configuration of a chiral oxadiazol-3-one calcium channel blocker, resolved using chiral chromatography, via concerted density functional theory calculations of its vibrational circular dichroism, electronic circular dichroism, and optical rotation. J Org Chem. 2007;72:4707–4715. doi: 10.1021/jo070302k. [DOI] [PubMed] [Google Scholar]
- 10.Bringmann G, Bruhn T, Maksimenka K, Hemberger Y. The assignment of absolute stereostructures through quantum chemical circular dichroism calculations. Eur J Org Chem. 2009;2009:2717–2727. doi: 10.1002/ejoc.200801121. [DOI] [Google Scholar]
- 11.“Gaussian09.” from http://www.gaussian.com
- 12.“TURBOMOLE 6.3.” from http://www.turbomole.com
- 13.“NWChem 6.0.” from http://www.nwchem-sw.org
- 14.Berova N, Bari LD, Pescitelli G. Application of electronic circular dichroism in configurational and conformational analysis of organic compounds. Chem Soc Rev. 2007;36:914–931. doi: 10.1039/b515476f. [DOI] [PubMed] [Google Scholar]
- 15.Pecul M, Ruud K, Helgaker T. Density functional theory calculation of electronic circular dichroism using London orbitals. Chem Phys Lett. 2004;388:110–119. doi: 10.1016/j.cplett.2004.03.008. [DOI] [Google Scholar]
- 16.Klamt A, Schuurmann G. COSMO: a new approach to dielectric screening in solvents with explicit expressions for the screening energy and its gradient. J Chem Soc Perkin Trans. 1993;2:799–805. doi: 10.1039/p29930000799. [DOI] [Google Scholar]
- 17.Klamt A. Conductor-like screening model for real solvents: a new approach to the quantitative calculation of solvation phenomena. J Phys Chem. 1995;99:2224–2235. doi: 10.1021/j100007a062. [DOI] [Google Scholar]
- 18.Stephens PJ, Harada N. ECD cotton effect approximated by the Gaussian curve and other methods. Chirality. 2010;22:229–233. doi: 10.1002/chir.20733. [DOI] [PubMed] [Google Scholar]
- 19.Pedersen TB, Koch H, Ruud K. Coupled cluster response calculation of natural chiroptical spectra. J Chem Phys. 1999;110:2883–2892. doi: 10.1063/1.477931. [DOI] [Google Scholar]
- 20.Petrovic AG, Polavarapu PL. Chiroptical spectroscopic determination of molecular structures of chiral sulfinamides: t-butanesulfinamide. J Phys Chem A. 2007;111:10938–10943. doi: 10.1021/jp075077p. [DOI] [PubMed] [Google Scholar]
- 21.Petrovic AG, Polavarapu PL, Drabowicz J, Lyżwa P, Mikolajczyk M, Wieczorek W, Balinska A. Diastereomers of N-α-phenylethyl-t-butylsulfinamide: absolute configurations and predominant conformations. J Org Chem. 2008;73:3120–3129. doi: 10.1021/jo702544g. [DOI] [PubMed] [Google Scholar]
- 22.Petrovic AG, Vick SE, Polavarapu PL. Determination of the absolute stereochemistry of chiral biphenanthryls in solution phase using chiroptical spectroscopic methods: 2,2′-diphenyl-[3,3′-biphenanthrene]-4,4′-diol. Chirality. 2008;20:501–510. doi: 10.1002/chir.20490. [DOI] [PubMed] [Google Scholar]
- 23.Deguchi J, Shoji T, Nugroho AE, Hirasawa Y, Hosoya T, Shirota O, Awang K, Hadi AHA, Morita H. Eucophylline, a tetracyclic vinylquinoline alkaloid from Leuconotis eugenifolius. J Nat Prod. 2010;73:1727–1729. doi: 10.1021/np100458b. [DOI] [PubMed] [Google Scholar]
- 24.Motegi M, Nugroho AE, Hirasawa Y, Arai T, Hadi AHA, Morita H. Leucomidines A–C, novel alkaloids from Leuconotis griffithii. Tetrahedron Lett. 2012;53:1227–1230. doi: 10.1016/j.tetlet.2011.12.116. [DOI] [Google Scholar]
- 25.He F, Nugroho AE, Wong CP, Hirasawa Y, Shirota O, Morita H, Aisa HA. Rupestines F–M, new guaipyridine sesquiterpene alkaloids from Artemisia rupestris. Chem Pharm Bull. 2012;60:213–218. doi: 10.1248/cpb.60.213. [DOI] [PubMed] [Google Scholar]
- 26.Hirasawa Y, Hara M, Nugroho AE, Sugai M, Zaima K, Kawahara N, Goda Y, Awang K, Hadi AHA, Litaudon M, Morita H. Bisnicalaterines B and C, atropisomeric bisindole alkaloids from Hunteria zeylanica, showing vasorelaxant activity. J Org Chem. 2010;75:4218–4223. doi: 10.1021/jo1006762. [DOI] [PubMed] [Google Scholar]
- 27.Stephens PJ, Pan J-J, Devlin FJ, Urbanová M, Hájíček J. Determination of the absolute configurations of natural products via density functional theory calculations of vibrational circular dichroism, electronic circular dichroism and optical rotation: the schizozygane alkaloid schizozygine. J Org Chem. 2007;72:2508–2524. doi: 10.1021/jo062567p. [DOI] [PubMed] [Google Scholar]
- 28.Renner U, Kernweisz P. Alkaloide aus Schizozygia caffaeoides (Boj.) Baill. Experientia. 1963;19:244–246. doi: 10.1007/BF02151358. [DOI] [PubMed] [Google Scholar]
- 29.Taniguchi T, Martin CL, Monde K, Nakanishi K, Berova N, Overman LE. Absolute configuration of actinophyllic acid as determined through chiroptical data. J Nat Prod. 2009;72:430–432. doi: 10.1021/np800665s. [DOI] [PMC free article] [PubMed] [Google Scholar]
- 30.Carroll AR, Hyde E, Smith J, Quinn RJ, Guymer G, Forster PI. Actinophyllic acid, a potent indole alkaloid inhibitor of the coupled enzyme assay carboxypeptidase U/Hippuricase from the leaves of Alstonia actinophylla (Apocynaceae) J Org Chem. 2005;70:1096–1099. doi: 10.1021/jo048439n. [DOI] [PubMed] [Google Scholar]
- 31.Almeida C, Hemberger Y, Schmitt SM, Bouhired S, Natesan L, Kehraus S, Dimas K, Gütschow M, Bringmann G, König GM. Marilines A–C: novel phthalimidines from the sponge-derived fungus Stachylidium sp. Chem Eur J. 2012;18:8827–8834. doi: 10.1002/chem.201103278. [DOI] [PubMed] [Google Scholar]
- 32.Xue M, Zhang Q, Gao J-M, Li H, Tian J-M, Pescitelli G. Chaetoglobosin Vb from endophytic Chaetomium globosum: absolute configuration of chaetoglobosins. Chirality. 2012;24:668–674. doi: 10.1002/chir.22068. [DOI] [PubMed] [Google Scholar]
- 33.Najmuldeen IA, Hadi AHA, Awang K, Mohamad K, Ketuly KA, Mukhtar MR, Chong S-L, Chan G, Nafiah MA, Weng NS, Shirota O, Hosoya T, Nugroho AE, Morita H. Chisomicines A–C, limonoids from Chisocheton ceramicus. J Nat Prod. 2011;74:1313–1317. doi: 10.1021/np200013g. [DOI] [PubMed] [Google Scholar]
- 34.Nagakura Y, Nugroho AE, Hirasawa Y, Hosoya T, Rahman A, Kusumawati I, Zaini N, Morita H. Sanjecumins A and B: new limonoids from Sandoricum koetjape. J Nat Med. 2013;67:381–385. doi: 10.1007/s11418-012-0677-4. [DOI] [PubMed] [Google Scholar]
- 35.Kurtán T, Jia R, Li Y, Pescitelli G, Guo Y-W. Absolute configuration of highly flexible natural products by the solid-state ECD/TDDFT method: ximaolides and sinulaparvalides. Eur J Org Chem. 2012;2012:6722–6728. doi: 10.1002/ejoc.201200862. [DOI] [Google Scholar]
- 36.Jia R, Guo Y-W, Chen P, Yang Y-M, Mollo E, Gavagnin M, Cimino G. Biscembranoids and their probable biogenetic precursor from the Hainan soft coral Sarcophyton tortuosum. J Nat Prod. 2007;70:1158–1166. doi: 10.1021/np060220b. [DOI] [PubMed] [Google Scholar]
- 37.Jia R, Guo Y-W, Mollo E, Gavagnin M, Cimino G. Further new bis-cembranoids from the Hainan soft coral Sarcophyton tortuosum. Helv Chim Acta. 2008;91:2069–2074. doi: 10.1002/hlca.200890220. [DOI] [Google Scholar]
- 38.Xu Y-J, Foubert K, Dhooghe L, Lemière F, Maregesi S, Coleman CM, Zou Y, Ferreira D, Apers S, Pieters L. Rapid isolation and identification of minor natural products by LC–MS, LC–SPE–NMR and ECD: isoflavanones, biflavanones and bisdihydrocoumarins from Ormocarpum kirkii. Phytochemistry. 2012;79:121–128. doi: 10.1016/j.phytochem.2012.04.004. [DOI] [PubMed] [Google Scholar]
- 39.Dhooghe L, Maregesi S, Mincheva I, Ferreira D, Marais JPJ, Lemière F, Matheeussen A, Cos P, Maes L, Vlietinck A, Apers S, Pieters L. Antiplasmodial activity of (I-3, II-3)-biflavonoids and other constituents from Ormocarpum kirkii. Phytochemistry. 2010;71:785–791. doi: 10.1016/j.phytochem.2010.02.005. [DOI] [PubMed] [Google Scholar]
- 40.DeAngelis GG, Wildman WC. Circular dichroism studies—I: a quadrant rule for the optically active aromatic chromophore in rigid polycyclic systems. Tetrahedron. 1969;25:5099–5112. doi: 10.1016/S0040-4020(01)83255-5. [DOI] [Google Scholar]
- 41.Debbab A, Aly AH, Edrada-Ebel R, Wray V, Pretsch A, Pescitelli G, Kurtan T, Proksch P. New anthracene derivatives—structure elucidation and antimicrobial activity. Eur J Org Chem. 2012;2012:1351–1359. doi: 10.1002/ejoc.201101442. [DOI] [Google Scholar]
- 42.Sun P, Huo J, Kurtán T, Mándi A, Antus S, Tang H, Draeger S, Schulz B, Hussain H, Krohn K, Pan W, Yi Y, Zhang W. Structural and stereochemical studies of hydroxyanthraquinone derivatives from the endophytic fungus Coniothyrium sp. Chirality. 2013;25:141–148. doi: 10.1002/chir.22128. [DOI] [PubMed] [Google Scholar]
- 43.Hussain H, Krohn K, Ahmed I, Draeger S, Schulz B, Di Pietro S, Pescitelli G. Phomopsinones A–D: four new pyrenocines from endophytic fungus Phomopsis sp. Eur J Org Chem. 2012;2012:1783–1789. doi: 10.1002/ejoc.201101788. [DOI] [Google Scholar]