

Abstract
The objective of this study was to investigate the effect of different cone beam CT scan parameters on trabecular bone microstructure measurements. A human mandibular cadaver was scanned using a cone beam CT (3D Accuitomo 170; J.Morita, Kyota, Japan). 20 cone beam CT images were obtained using 5 different fields of view (4×4 cm, 6×6 cm, 8×8 cm, 10×10 cm and 10×5 cm), 2 types of rotation steps (180° and 360°) and 2 scanning resolutions (standard and high). Image analysis software was used to assess the trabecular bone microstructural parameters (number, thickness and spacing). All parameters were measured twice by one trained observer. Intraclass correlation coefficients showed high intraobserver repeatability (intraclass correlation coefficient, 0.95–0.97) in all parameters across all tested scan parameters. Trabecular bone microstructural measurements varied significantly, especially in smaller fields of view (p = 0.001). There was no significant difference in the trabecular parameters when using different resolutions (number, p = 0.988; thickness, p = 0.960; spacing, p = 0.831) and rotation steps (number, p = 1.000; thickness, p = 0.954; spacing, p = 0.759). The scan field of view significantly influences the trabecular bone microstructure measurements. Rotation steps (180° or 360°) and resolution (standard or high) selections are not relevant.
Keywords: cone beam CT, trabecular bone, diagnostic imaging, scanning parameter
Introduction
Bone quality is one of the essential factors in predicting the success of implant treatment.1 Because of the advantages of cone beam CT (CBCT) over other CT systems,2 CBCT has been widely used to facilitate the pre-operative evaluation of bone quality for dental implant treatment.3 Until now, the application of CBCT in dental implant assessment has been mostly based on linear measurements of bone width and height,4 density of the jaw bone5–7 and applications in guided surgery.8 However, it is recommended that the evaluation of bone quality should not be based on bone density alone.9,10 The mechanical aspects such as trabecular bone microstructural characteristics should also be assessed to aid in predicting the success of a dental implant.6,10
Although the number of studies on the application of CBCT in assessing bone quality has noticeably increased during the last few years, the validity of the measurements produced by this technology remains questionable.11 This is because image quality in CBCT is influenced by the type of system used to acquire the image data, the field of view (FOV) and the selection of scan parameters.5 It has been emphasized that FOV selection has a significant influence on image quality in CBCT and the visibility of anatomical structures.12 In addition, CBCT has a low contrast-to-noise ratio compared with multislice CT, a larger amount of scatter radiation owing to the cone-beam geometry and several other image artefacts specific to CBCT.13 It has been indicated in studies that beam hardening artefacts and the relative positioning of the structures in the scan volume also influence the validity of CBCT bone density measurements.5,14 Consequently, image segmentation, which is required for the assessment of bone quality, may also be influenced by these limitations.15 Different scanning positions, FOVs and types of detector can produce different levels of artefacts.16 Although image-processing algorithms could be used to filter and reduce these image artefacts,17 their application in CBCT remains limited as they requires extensive computational technology.18 The potential application of CBCT for trabecular bone microstructure assessment has been suggested in earlier studies.19,20 Recently, CBCT has been validated as a non-invasive imaging tool for trabecular bone microstructure measurement at dental implant sites.21 The effect of scanning parameters on microstructural measurements has been extensively studied in other high-resolution systems, including micro- and multislice CT.22–25 However, its influence on CBCT remains unknown. Therefore, the aim of this study was to evaluate the effect of scan parameters (FOV, rotation steps and resolution) on trabecular bone microstructural measurements using CBCT.
Materials and methods
Image acquisition and processing
A human mandibular cadaver was obtained from the Department of Functional Anatomy, Academic Center for Dentistry Amsterdam, Amsterdam, Netherlands, and approved for research purposes. The mandible was scanned using a CBCT system (3D Accuitomo 170; J. Morita, Kyoto, Japan) at 90 kVp and at 5 mA using 5 different FOVs (4×4 cm, 6×6 cm, 8×8 cm, 10×10 cm and 10×5 cm), 2 types of rotation steps (180° and 360°) and 2 scanning resolutions (standard and high), resulting in a total of 20 scans. All data sets derived from CBCT were formatted as digital imaging and communications in medicine 3 files. An edentulous posterior region was identified as the region of interest and carefully compared among all images. The comparison was conducted by creating three-dimensional (3D) isosurface data sets using image analysis software (Amira v. 4.1; Visage Imaging Inc., Carlsbad, CA). The isosurfaces were manually matched and superimposed onto each other to provide maximum alignment by using the 4×4 cm FOV data sets as a reference standard (Figure 1). For each image, a smaller volume of interest (VOI) was identified within the boundaries of the cortical bone (Figure 2). The selected VOIs were imported into analysis software CTAn v. 1.11 (Skyscan, Kontich, Belgium) as 16-bit images (65 536 Gy values). To compare the measurements obtained from different scan parameters, the software was operated using separate windows for matching and comparing the slices obtained from using different CBCT scanning parameters with the corresponding slice derived from the 4×4 cm FOV as the reference model (Figure 3a). A rectangular region of interest limited to trabecular bone structure was manually selected on each data set slice by slice (Figure 3b) and binarized (Figure 3c) to allow the measurement process (Figure 3d). Because of the different voxel sizes of the FOVs, the quantity of trabecular bone on 10 consecutive slices of a small FOV (e.g. 4×4 cm images, 80 µm) may correspond to a quantity of 3 consecutive slices of a larger FOV (e.g. 10×10 cm images, 250 µm). Therefore, to standardize the amount of assessed trabecular bone, the measurements were averaged in each image data set. The measurement using CTAn software was performed twice with a 1 week interval by one trained observer.
Figure 1.
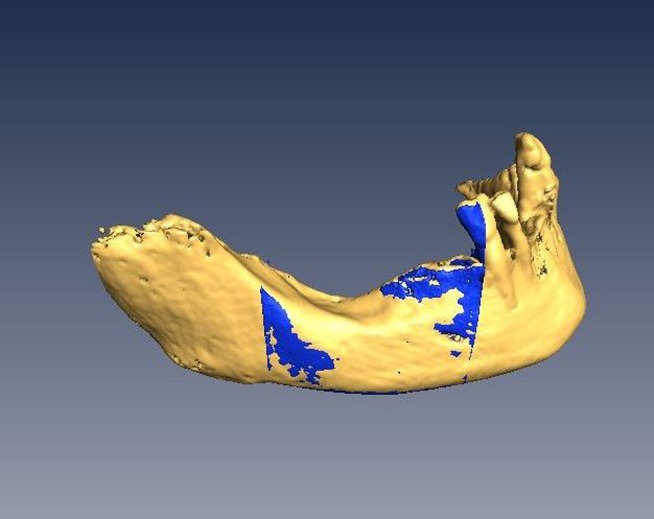
Two data sets from cone beam CT with a 4×4 cm field of view (FOV) and 10×10 cm FOV were matched in Amira v. 4.1 (Visage Imaging Inc., Carlsbad, CA)
Figure 2.
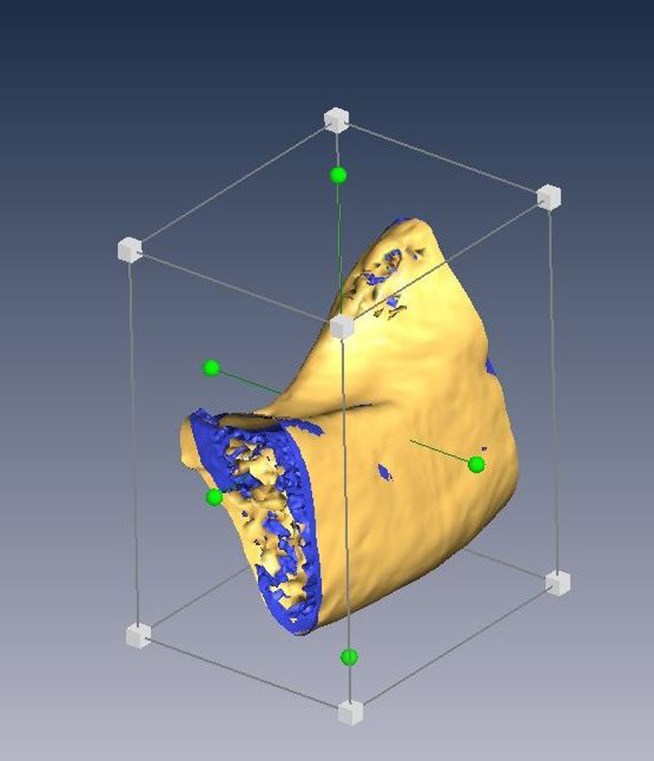
A smaller volume of interest of 4×4 cm field of view (FOV) and 10×10 cm FOV was cropped within the boundaries of cortical bone in Amira v. 4.1 (Visage Imaging Inc., Carlsbad, CA)
Figure 3.

(a) Data sets from 4×4 cm and 10×10 cm fields of view (FOVs) were compared slice by slice using the 4×4 cm FOV data sets as the reference model. (b) A rectangular region of interest limited to trabecular bone structure was selected for each data set. (c) Images were binarized and (d) processed to allow the microstructural measurements
Statistical analysis
Three trabecular bone microstructural parameters were considered to describe the trabecular characteristics. These parameters were the trabecular number (Tb.N), thickness (Tb.Th) and spacing (Tb.Sp). All parameters were measured on the CBCT images obtained using the 20 different combinations of scan parameters. Data were analysed using SPSS® v. 20.0 (SPSS Inc., Chicago, IL). The intraobserver reliability in reproducing the measurements was analysed using intraclass correlation coefficients (ICCs). Independent sample t-tests were used to assess the difference in trabecular microstructure parameters between the two scanning resolutions and the two rotation steps. Finally, one-way ANOVA was used to assess the difference between the five FOV options of the microstructural parameters. The least significant difference was used for the post-hoc analysis. The level of significance was set at p = 0.05.
Results
Table 1 demonstrates the first and second measurements across all tested scan parameters. The intraobserver reproducibility of trabecular bone microstructure measurements was excellent: the ICCs were 0.96, 0.97 and 0.95 for Tb.Th, Tb.Sp and Tb.N, respectively. The independent sample t-tests showed no significant differences in the trabecular microstructural parameters when using different rotations and resolutions (Table 2). However, significant differences in the measurements were observed when using different FOVs (p = 0.001). Post-hoc analysis (least significant difference) illustrated generally that Tb.Th and Tb.Sp measurements decreased, whereas Tb.N increased when a larger FOV was used (Table 2). This trend is observed among the lower range of the FOVs (Table 2).
Table 1.
The cone beam CT scan parameters and the repeated measurements of trabecular thickness (Tb.Th), spacing (Tb.Sp) and number (Tb.N)
| Field of view (cm) | Rotation | Resolution mode | Exposure time (s) | Voxel size (µm3) | Tb.Th1 (µm) | Tb.Th2 (µm) | Tb.Sp1 (µm) | Tb.Sp2 (µm) | Tb.N1 (µm−1) | Tb.N2 (µm−1) |
| 4×4 | 180° | Standard | 9.0 | 80 | 3.15 | 3.06 | 6.64 | 6.53 | 1.02 | 1.04 |
| High | 15.8 | 80 | 3.18 | 3.38 | 6.70 | 7.32 | 1.01 | 0.94 | ||
| 360° | Standard | 17.5 | 80 | 3.23 | 3.04 | 5.03 | 5.06 | 1.21 | 1.23 | |
| High | 30.8 | 80 | 3.06 | 3.83 | 6.62 | 5.36 | 1.03 | 1.09 | ||
| 6×6 | 180° | Standard | 9.0 | 125 | 2.63 | 2.84 | 3.71 | 3.96 | 1.57 | 1.47 |
| High | 15.8 | 125 | 2.18 | 2.46 | 3.75 | 3.60 | 1.71 | 1.64 | ||
| 360° | Standard | 17.5 | 125 | 2.42 | 2.65 | 3.25 | 3.68 | 1.76 | 1.58 | |
| High | 30.8 | 125 | 2.53 | 2.50 | 4.27 | 3.98 | 1.47 | 1.54 | ||
| 8×8 | 180° | Standard | 9.0 | 160 | 1.88 | 1.78 | 3.37 | 3.20 | 1.91 | 2.01 |
| High | 15.8 | 160 | 2.06 | 2.38 | 2.85 | 2.83 | 2.04 | 1.92 | ||
| 360° | Standard | 17.5 | 160 | 2.07 | 2.01 | 2.96 | 3.22 | 1.99 | 1.91 | |
| High | 30.8 | 160 | 2.23 | 2.17 | 2.90 | 3.49 | 1.95 | 1.77 | ||
| 10×10 | 180° | Standard | 9.0 | 250 | 1.66 | 2.04 | 2.02 | 1.88 | 2.72 | 2.55 |
| High | 15.8 | 250 | 1.77 | 1.95 | 1.86 | 2.16 | 2.76 | 2.44 | ||
| 360° | Standard | 17.5 | 250 | 1.95 | 1.95 | 1.86 | 2.41 | 2.62 | 2.29 | |
| High | 30.8 | 250 | 1.42 | 1.66 | 2.87 | 2.39 | 2.32 | 2.46 | ||
| 10×5 | 180° | Standard | 9.0 | 250 | 1.68 | 1.96 | 2.91 | 3.51 | 2.18 | 1.82 |
| High | 15.8 | 250 | 1.44 | 1.72 | 2.10 | 2.69 | 2.82 | 2.27 | ||
| 360° | Standard | 17.5 | 250 | 1.60 | 1.87 | 1.88 | 2.95 | 2.87 | 2.07 | |
| High | 30.8 | 250 | 1.65 | 1.65 | 2.60 | 2.59 | 2.35 | 2.35 |
Table 2.
The mean and standard deviation (SD) of trabecular microstructural measurements analysed using independent t-test for different resolutions (standard and high) and rotation steps (180° and 360°)
| Scanning parameter | n | Trabecular thickness | Trabecular spacing | Trabecular number | ||||||
| Mean | SD | p-value | Mean | SD | p-value | Mean | SD | p-value | ||
| Resolution | ||||||||||
| Standard | 10 | 2.28 | 0.55 | 0.960 | 3.50 | 1.40 | 0.831 | 1.89 | 0.54 | 0.988 |
| High | 10 | 2.26 | 0.67 | 3.65 | 1.64 | 1.90 | 0.59 | |||
| Rotation | ||||||||||
| 180° | 10 | 2.26 | 0.59 | 0.954 | 3.68 | 1.77 | 0.759 | 1.89 | 0.60 | 1.000 |
| 360° | 10 | 2.28 | 0.64 | 3.47 | 1.23 | 1.89 | 0.52 | |||
| FOV | ||||||||||
| 4×4 | 4 | 3.25 | 0.16 | 6.15 | 0.86 | 1.07 | 0.10 | |||
| 6×6 | 0.001 | 0.001 | 0.001 | |||||||
| 8×8 | 0.001 | 0.001 | 0.001 | |||||||
| 10×10 | 0.001 | 0.001 | 0.001 | |||||||
| 10×5 | 0.001 | 0.001 | 0.001 | |||||||
| 6×6 | 4 | 2.53 | 0.17 | 3.78 | 0.28 | 1.60 | 0.09 | |||
| 4×4 | 0.001 | 0.001 | 0.001 | |||||||
| 8×8 | 0.001 | 0.001 | 0.001 | |||||||
| 10×10 | 0.001 | 0.001 | 0.001 | |||||||
| 10×5 | 0.001 | 0.001 | 0.001 | |||||||
| 8×8 | 4 | 2.07 | 0.18 | 3.10 | 0.19 | 1.94 | 0.53 | |||
| 4×4 | 0.001 | 0.001 | 0.001 | |||||||
| 6×6 | 0.001 | 0.060 | 0.003 | |||||||
| 10×10 | 0.030 | 0.014 | 0.001 | |||||||
| 10×5 | 0.005 | 0.198 | 0.001 | |||||||
| 10×10 | 4 | 1.80 | 0.18 | 2.19 | 0.31 | 2.52 | 0.12 | |||
| 4×4 | 0.001 | 0.001 | 0.001 | |||||||
| 6×6 | 0.001 | 0.001 | 0.001 | |||||||
| 8×8 | 0.030 | 0.014 | 0.001 | |||||||
| 10×5 | 0.382 | 0.175 | 0.084 | |||||||
| 10×5 | 4 | 1.70 | 0.10 | 2.66 | 0.38 | 2.34 | 0.24 | |||
| 4×4 | 0.001 | 0.001 | 0.001 | |||||||
| 6×6 | 0.001 | 0.004 | 0.001 | |||||||
| 8×8 | 0.005 | 0.198 | 0.001 | |||||||
| 10×5 | 0.382 | 0.175 | 0.084 | |||||||
FOV, field of view.
The differences among FOVs (4×4 cm, 6×6 cm, 8×8 cm, 10×10 cm and 10×5 cm) were analysed using the post-hoc test. Mean difference is significant at the 0.05 level.
Discussion
The capacity of CBCT to display 3D images has increased its value for bone assessment,11 including linear bone measurements4,26–28 and bone density measurements.5–7 Recently, its potential application in structural analysis of trabecular bone has been suggested19,20 and validated.21 Undeniably, different CBCT applications require different image resolutions.29 For the assessment of the microstructure of trabecular bone, the resolution of the CBCT images is of paramount importance. Since CBCT image resolution is directly influenced by the scan parameters,30 a precise scanning protocol is essential to obtain accurate image resolution for fine bony structures.31 The present study observed the effect of different CBCT scan parameters on trabecular bone microstructure measurements. CBCT showed reproducible measurements for all tested scan parameters (ICC, 0.95–0.97). Previous CBCT studies mainly reported excellent reliability for linear mandibular measurements.26–28 In addition, recently, the reliability of the use of CBCT for bone density measurements has been studied.5 To the best of our knowledge, the present study is the first to report the reliability of CBCT trabecular microstructure measurements.
The size of the selected FOV has been described as an essential factor in assessing maxillofacial structures when using 3D surface models.12 Although recommended for better structural visualization, the increased image artefacts in a smaller FOV may decrease the image quality more than in a larger FOV. This is because the image reconstruction is heavily disturbed by the grey values of structures outside the FOV, which contribute in relatively greater extents when using smaller FOVs.12,14 Similarly, the present study demonstrated that the trabecular bone microstructure measurements were significantly different when using different FOVs. When a larger FOV was selected, the trabecular number increased, but the trabecular thickness and trabecular spacing decreased correspondingly. Unlike in previous studies,21,32 Tb.N increased when a larger FOV was selected. The voxel sizes used in the present study were 80 µm, 125 µm and 160 µm for the FOVs 4×4 cm, 6×6 cm and 8×8 cm, respectively. The 10×10 cm and 10×5 cm FOVs had the same voxel size, i.e. 250 µm. When evaluating fine structures, a small voxel size is always recommended for its high spatial resolution.33,34 However, an image with a larger voxel and a higher contrast-to-noise ratio (CNR) may have a better visual resolution than an image composed of smaller voxels with a lower CNR image.30 CNR is described as the ability to differentiate the contrast values of the diagnosed structures from the image background.24 Thus, the current results might be related to the higher CNR for larger CBCT voxel sizes. It would be interesting if the outcome of the present study could be extended to validate the significance of using a small voxel size for trabecular bone microstructure assessment by comparing the measurements from various CBCT voxel sizes with a gold standard modality such as micro-CT.
The 360° scan has more basis projections (resulting in a larger data set) and, theoretically, should therefore have a better image resolution than the 180° scan.35 However, the current measurements showed no difference between different rotation parameters (180° and 360°). Bechara et al30 also reported that the diagnostic image quality derived from a 180° (half) rotation setting was comparable to the 360° (full) rotation. In addition to the rotation setting, the present study also demonstrated that the trabecular microstructure measurements were not different when the type of resolution was changed from standard to high in the same FOV. This benefits the patients, as the half-rotation and standard resolution setting reduces the exposure dose. The advantages for the clinicians are that the lower number of images helps to reduce the required storage space and shortens the image reconstruction time. However, when metal artefacts are inevitable, a full rotation scan setting was recommended to increase the image quality.30 In short, the present study highlights the role of scan parameters in balancing the diagnostic image quality with radiation dose when using CBCT specifically for the assessment of the trabecular bone microstructure.
The 3D CBCT image contains a wide range of grey values. Owing to the inconsistencies in the CBCT histogram, it is difficult to identify the correct threshold value to accurately separate different densities in CBCT systems. Although an automated threshold value was used in our study, which should increase the reproducibility of the segmentation process, CBCT grey values have also been influenced by the so-called partial volume effect (PVE).13 When images are binarized, voxels are assigned either as bone or as marrow according to their grey values. The voxels that contain both bone and marrow information show a grey value between that of bone and marrow. It is difficult to predict whether such a voxel is displayed as bone or marrow as a result of the thresholding process. When larger voxel sizes are used, the voxel values under the influence of PVE can result in an image with thicker trabeculae or suggesting loss of thin trabeculae.32 Unlike other higher resolution modalities,22,23,32 the influence of PVE on trabecular measurement has not yet been studied in CBCT. Thus, future research on image diagnostic quality should also report on the influence of PVE on CBCT measurements as part of the thresholding procedure.
The accuracy of the coregistration procedure in this study was dependant on the accuracy with which the 3D isosurfaces could be created and matched. In CBCT, 3D surface segmentation is limited by spatial and contrast resolution, which is determined by technical factors such as modulation transfer function, the voxel size of volume and the trilinear interpolation algorithm of grey values between the voxels. All these factors limit the accuracy of the visualized volume to 100–150 µm.36 Additionally, relevant scan settings, including FOV, play an important role in setting the upper maximum attainable geometric accuracy, thereby limiting the accuracy of 3D surfaces. For CBCT 3D surfaces, this has ranged between 150 µm and 500 µm depending on the chosen system and scan protocol.37 In this study, the registration and cropping of two volumetric data sets (e.g. FOV, 4×4 cm and 8×8 cm) was performed manually to obtain the requested region of interest. The registration process was dependant on the 3D isosurfaces in providing coordinates of the original volumes of both data sets. The smaller VOI was then confined in the vertical and horizontal slice directions to the cortical bone margins.
An automated voxel-based registration algorithm such as maximization of mutual information is superior to (semi)automated or manual 3D isosurface registration methods because its results are insensitive to image resolution or the segmentation technique.38 Unfortunately, it was not possible to perform voxel-based registration in the present study owing to the technical limitations of the analysis software used. As such, the two volumes could not be automatically matched based on voxel data. Therefore, a manual approach was chosen instead. To ascertain the registration accuracy, the measurements were repeated twice, and the ICC shows strong agreement between the first and the second measurements (ICC, 0.95–0.97). This means that the manual registration was reproducible. In addition, the two data sets were carefully compared slice by slice using the CTAn software to ensure that the images used for the analysis were selected from the same region. The measurements were then averaged to reduce the bias that may occur during the manual registration procedure in Amira software. This is also another effort to standardize the amount of assessed trabecular bone on each image data set of both compared systems.21
In a previous study, the variability of the trabecular microstructure was observed on 24 human mandibular cadavers.21 Because, in the present study, the focus was on the effect of scan parameters rather than the biological trabecular variation, only one specimen was used. This may reduce the bias caused by the biological variation (e.g. bone density) and allow us to generalize the results.
Conclusions
This study assessed the difference in trabecular bone parameters using different scan parameters of a CBCT system. The results show that trabecular bone microstructure parameters are significantly influenced by the choice of FOV regardless of the resolution (standard or high) of FOV and rotation mode (180° or 360°). Therefore, it is recommended to select the shortest scanning time, thereby reducing the probability of motion artefacts and thus enhancing image quality whilst minimizing radiation dose.
The measurements in our study were performed on a cadaver specimen and can deviate from actual measurements in patients. Therefore, in vivo studies should be conducted to validate the current results and to help formulate a standard scanning protocol39 for accurate and reproducible trabecular bone microstructural assessment at prospective implant sites.
Funding
This work was financially supported by the University of Malaya, Kuala Lumpur, Malaysia.
References
- 1.Song YD, Jun SH, Kwon JJ. Correlation between bone quality evaluated by cone-beam computerized tomography and implant primary stability. Int J Oral Maxillofac Implants 2009; 24: 59–64 [PubMed] [Google Scholar]
- 2.Patcas R, Markic G, Müller L, Ullrich O, Peltomäki T, Kellenberger CJ, et al. Accuracy of linear intraoral measurements using cone beam CT and multidetector CT: a tale of two CTs. Dentomaxillofac Radiol 2012; 41: 637–644 10.1259/dmfr/21152480 [DOI] [PMC free article] [PubMed] [Google Scholar]
- 3.Guerrero ME, Jacobs R, Loubele M, Schutyser F, Suetens P, van Steenberghe D. State-of-the-art on cone beam CT imaging for preoperative planning of implant placement. Clin Oral Investig 2006; 10: 1–7 10.1007/s00784-005-0031-2 [DOI] [PubMed] [Google Scholar]
- 4.Kobayashi K, Shimoda S, Nakagawa Y, Yamamoto A. Accuracy in measurement of distance using limited cone-beam computerized tomography. Int J Oral Maxillofac Implants 2004; 19: 228–231 [PubMed] [Google Scholar]
- 5.Parsa A, Ibrahim N, Hassan B, Motroni A, van der Stelt P, Wismeijer D. Influence of cone beam CT scanning parameters on grey value measurements at implant site. Dentomaxillofac Radiol 2013; 42: 79884780 10.1259/dmfr/79884780 [DOI] [PMC free article] [PubMed] [Google Scholar]
- 6.González-García R, Monje F. The reliability of cone-beam computed tomography to assess bone density at dental implant recipient sites: a histomorphometric analysis by micro-CT. Clin Oral Implants Res 2012; 24: 871–879 10.1111/j.1600-0501.2011.02390.x [DOI] [PubMed] [Google Scholar]
- 7.Fanuscu MI, Chang TL. Three-dimensional morphometric analysis of human cadaver bone: microstructural data from maxilla and mandible. Clin Oral Implants Res 2004; 15: 213–218 [DOI] [PubMed] [Google Scholar]
- 8.Dreiseidler T, Neugebauer J, Ritter L, Lingohr T, Rothamel D, Mischkowski RA, et al. Accuracy of a newly developed integrated system for dental implant planning. Clin Oral Implants Res 2009; 20: 1191–1199 10.1111/j.1600-0501.2009.01764.x [DOI] [PubMed] [Google Scholar]
- 9.Felsenberg D, Boonen S. The bone quality framework: determinants of bone strength and their interrelationships, and implications for osteoporosis management. Clin Ther 2005; 27: 1–11 10.1016/j.clinthera.2004.12.020 [DOI] [PubMed] [Google Scholar]
- 10.De Oliveira RC, Leles CR, Lindh C, Ribeiro-Rotta RF. Bone tissue microarchitectural characteristics at dental implant sites. Part 1: identification of clinical-related parameters. Clin Oral Implants Res 2012; 23: 981–986 10.1111/j.1600-0501.2011.02243.x [DOI] [PubMed] [Google Scholar]
- 11.Spin-Neto R, Marcantonio E, Jr, Gotfredsen E, Wenzel A. Exploring CBCT-based DICOM files. A systematic review on the properties of images used to evaluate maxillofacial bone grafts. J Digit Imaging 2011; 24: 959–966 10.1007/s10278-011-9377-y [DOI] [PMC free article] [PubMed] [Google Scholar]
- 12.Hassan B, Couto Souza P, Jacobs R, de Azambuja Berti S, van der Stelt P. Influence of scanning and reconstruction parameters on quality of three-dimensional surface models of the dental arches from cone beam computed tomography. Clin Oral Investig 2010; 14: 303–310 10.1007/s00784-009-0291-3 [DOI] [PMC free article] [PubMed] [Google Scholar]
- 13.Schulze R, Heil U, Gross D, Bruellmann DD, Dranischnikow E, Schwanecke U, Schoemer E. Artefacts in CBCT: a review. Dentomaxillofac Radiol 2011; 40: 265–273 10.1259/dmfr/30642039 [DOI] [PMC free article] [PubMed] [Google Scholar]
- 14.Araki K, Okano T. The effect of surrounding conditions on pixel value of cone beam computed tomography. Clin Oral Implants Res 2011; 24: 862–865 10.1111/j.1600-0501.2011.02373.x [DOI] [PubMed] [Google Scholar]
- 15.Loubele M, Maes F, Schutyser F, Marchal G, Jacobs R, Suetens P. Assessment of bone segmentation quality of cone-beam CT versus multislice spiral CT: a pilot study. Oral Surg Oral Med Oral Pathol Oral Radiol Endod 2006; 102: 225–234 10.1016/j.tripleo.2005.10.039 [DOI] [PubMed] [Google Scholar]
- 16.Katsumata A, Hirukawa A, Noujeim M, Okumura S, Naitoh M, Fujishita M, et al. Image artifact in dental cone-beam CT. Oral Surg Oral Med Oral Pathol Oral Radiol Endod 2006; 101: 652–657 10.1016/j.tripleo.2005.07.027 [DOI] [PubMed] [Google Scholar]
- 17.Bechara B, McMahan CA, Geha H, Noujeim M. Evaluation of a cone beam CT artefact reduction algorithm. Dentomaxillofac Radiol 2012; 41: 422–428 10.1259/dmfr/43691321 [DOI] [PMC free article] [PubMed] [Google Scholar]
- 18.Scarfe WC, Farman AG. What is cone-beam CT and how does it work? Dent Clin North Am 2008; 52: 707–730 10.1016/j.cden.2008.05.005 [DOI] [PubMed] [Google Scholar]
- 19.Corpas LS, Jacobs R, Quirynen M, Huang Y, Naert I, Duyck J. Peri-implant bone tissue assessment by comparing the outcome of intra-oral radiograph and cone beam computed tomography analyses to the histological standard. Clin Oral Implants Res 2011; 22: 492–499 10.1111/j.1600-0501.2010.02029.x [DOI] [PubMed] [Google Scholar]
- 20.Ibrahim N, Parsa A, Hassan B, van der Stelt P, Wismeijer D. Diagnostic imaging of trabecular bone microstructure for oral implants: a literature review. Dentomaxillofac Radiol 2013; 42: 20120075 10.1259/dmfr.20120075 [DOI] [PMC free article] [PubMed] [Google Scholar]
- 21.Ibrahim N, Parsa A, Hassan B, van der Stelt P, Aartman IH, Wismeijer D. Accuracy of trabecular bone microstructural measurement at planned dental implant sites using cone-beam CT datasets. Clin Oral Implants Res Apr 2013. Epub ahead of print 10.1111/clr.12163 [DOI] [PubMed] [Google Scholar]
- 22.Peyrin F, Salome M, Cloetens P, Laval-Jeantet AM, Ritman E, Rüegsegger P. Micro-CT examinations of trabecular bone samples at different resolutions: 14, 7 and 2 micron level. Technol Health Care 1998; 6: 391–401 [PubMed] [Google Scholar]
- 23.Verdelis K, Lukashova L, Atti E, Mayer-Kuckuk P, Peterson MG, Tetradis S, et al. MicroCT morphometry analysis of mouse cancellous bone: intra- and inter-system reproducibility. Bone 2011; 49: 580–587 10.1016/j.bone.2011.05.013 [DOI] [PMC free article] [PubMed] [Google Scholar]
- 24.Kalender WA, Deak P, Kellermeier M, van Straten M, Vollmar SV. Application- and patient size-dependent optimization of x-ray spectra for CT. Med Phys 2009; 36: 993–1007 [DOI] [PubMed] [Google Scholar]
- 25.Klink T, Regier M, van Stevendaal U, Grass M, Adam G, Begemann P. Accelerating image acquisition in 64-MDCT: the influence of scan parameters on image resolution and quality in a phantom study. Clin Imaging 2012; 36: 334–344 10.1016/j.clinimag.2011.11.006 [DOI] [PubMed] [Google Scholar]
- 26.Gribel BF, Gribel MN, Frazäo DC, McNamara JA, Jr, Manzi FR. Accuracy and reliability of craniometric measurements on lateral cephalometry and 3D measurements on CBCT scans. Angle Orthod 2011; 81: 26–35 10.2319/032210-166.1 [DOI] [PMC free article] [PubMed] [Google Scholar]
- 27.Sheikhi M, Ghorbanizadeh S, Abdinian M, Goroohi H, Badrian H. Accuracy of linear measurements of galileos cone beam computed tomography in normal and different head positions. Int J Dent 2012; 2012: 214954 10.1155/2012/214954 [DOI] [PMC free article] [PubMed] [Google Scholar]
- 28.Tomasi C, Bressan E, Corazza B, Mazzoleni S, Stellini E, Lith A. Reliability and reproducibility of linear mandible measurements with the use of a cone-beam computed tomography and two object inclinations. Dentomaxillofac Radiol 2011; 40: 244–250 10.1259/dmfr/17432330 [DOI] [PMC free article] [PubMed] [Google Scholar]
- 29.European Commission. Cone beam CT for dental and maxillofacial radiology: evidence-based guidelines. Radiation Protection Publication 172. Luxembourg: European Commission; 2012 [Google Scholar]
- 30.Bechara B, McMahan CA, Moore WS, Noujeim M, Geha H, Teixeira FB. Contrast-to-noise ratio difference in small field of view cone beam computed tomography machines. J Oral Sci 2012; 54: 227–232 [DOI] [PubMed] [Google Scholar]
- 31.Liang X, Jacobs R, Hassan B, Li L, Pauwels R, Corpas L, et al. A comparative evaluation of cone beam computed tomography (CBCT) and multi-slice CT (MSCT) part I. on subjective image quality. Eur J Radiol 2010; 75: 265–269 10.1016/j.ejrad.2009.03.042 [DOI] [PubMed] [Google Scholar]
- 32.Kothari M, Keaveny TM, Lin JC, Newitt DC, Genant HK, Majumdar S. Impact of spatial resolution on the prediction of trabecular architecture parameters. Bone 1998; 22: 437–443 [DOI] [PubMed] [Google Scholar]
- 33.Bauman R, Scarfe W, Clark S, Morelli J, Scheetz J, Farman A. Ex vivo detection of mesiobuccal canals in maxillary molars using CBCT at four different isotropic voxel dimensions. Int Endod J 2011; 44: 752–758 10.1111/j.1365-2591.2011.01882.x [DOI] [PubMed] [Google Scholar]
- 34.Maret D, Telmon N, Peters OA, Lepage B, Treil J, Inglèse JM, et al. Effect of voxel size on the accuracy of 3D reconstructions with cone beam CT. Dentomaxillofac Radiol 2012; 41: 649–655 10.1259/dmf/81804525 [DOI] [PMC free article] [PubMed] [Google Scholar]
- 35.Chappard D, Retailleau-Gaborit N, Legrand E, Baslé MF, Audran M. Comparison insight bone measurements by histomorphometry and microCT. J Bone Miner Res 2005; 20: 1177–1184 10.1359/JBMR.050205 [DOI] [PubMed] [Google Scholar]
- 36.Dreiseidler T, Tandon D, Kreppel M, Neugebauer J, Mischkowski RA, Zinser MJ, et al. CBCT device dependency on the transfer accuracy from computer-aided implantology procedures. Clin Oral Impl Res 2012; 23: 1089–1097 10.1111/j.1600-0501.2011.02272.x [DOI] [PubMed] [Google Scholar]
- 37.Liang X, Lambrichts I, Sun Y, Denis K, Hassan B, Li L, et al. A comparative evaluation of cone beam computed tomography (CBCT) and multi-slice CT (MSCT). Part II: on 3D model accuracy. Eur J Radiol 2010; 75: 270–274 10.1016/j.ejrad.2009.04.016 [DOI] [PubMed] [Google Scholar]
- 38.Maes F, Vandermeulen D, Suetens P. Comparative evaluation of multiresolution optimization strategies for multimodality image registration by maximization of mutual information. Med Image Anal 1999; 3: 373–386 [DOI] [PubMed] [Google Scholar]
- 39.Spin-Neto R, Gotfredsen E, Wenzel A. Impact of voxel size variation on CBCT-based diagnostic outcome in dentistry: a systematic review. J Digit Imaging 2013; 26: 26813–26820 10.1007/s10278-012-9562-7 [DOI] [PMC free article] [PubMed] [Google Scholar]