

Abstract
Aims
Given the similarities in QTc response between dogs and humans, dogs are used in pre-clinical cardiovascular safety studies. The objective of our investigation was to characterize the PKPD relationships and identify translational gaps across species following the administration of three compounds known to cause QTc interval prolongation, namely cisapride, d, l-sotalol and moxifloxacin.
Methods
Pharmacokinetic and pharmacodynamic data from experiments in conscious dogs and clinical trials were included in this analysis. First, pharmacokinetic modelling and deconvolution methods were applied to derive drug concentrations at the time of each QT measurement. A Bayesian PKPD model was then used to describe QT prolongation, allowing discrimination of drug-specific effects from other physiological factors known to alter QT interval duration. A threshold of ≥10 ms was used to explore the probability of prolongation after drug administration.
Results
A linear relationship was found to best describe the pro-arrhythmic effects of cisapride, d,l-sotalol and moxifloxacin both in dogs and in humans. The drug-specific parameter (slope) in dogs was statistically significantly different from humans. Despite such differences, our results show that the probability of QTc prolongation ≥10 ms in dogs nears 100% for all three compounds at the therapeutic exposure range in humans.
Conclusions
Our findings indicate that the slope of PKPD relationship in conscious dogs may be used as the basis for the prediction of drug-induced QTc prolongation in humans. Furthermore, the risk of QTc prolongation can be expressed in terms of the probability associated with an increase ≥10 ms, allowing direct inferences about the clinical relevance of the pro-arrhythmic potential of a molecule.
Keywords: model-based drug development, pre-clinical studies, QTc interval prolongation, translational science
WHAT IS ALREADY KNOWN ABOUT THIS SUBJECT
In vivo experiments in conscious dogs are often used for the assessment of pro-arrhythmic effects before a new chemical entity is tested in clinical trials.
The current ICH guideline for the evaluation of drug-induced QTc interval prolongation in humans relies primarily on pairwise comparison between active and placebo arms after correction for changes from baseline (i.e. double delta method).
A systematic approach based on concentration–effect relationships is lacking for establishing the clinical relevance of drug-induced effects on QTc interval in the early stages of drug development.
WHAT THIS STUDY ADDS
Our investigation shows the feasibility of characterizing pharmacokinetic–pharmacodynamic (PKPD) relationships as the basis for the evaluation of the pro-arrhythmic risk in conscious dogs and humans.
It also shows that the magnitude of drug-induced effects varies across species as a result of underlying differences in pharmacokinetics, pharmacodynamics or homeostasis.
These findings raise important questions about the relevance of empirical protocols in preclinical species and thorough QT studies in healthy subjects as the basis for the assessment of cardiovascular risk. Understanding of the therapeutic exposure and PKPD relationship is critical for decision-making and progression of novel molecules into clinical development.
Introduction
Cardiovascular safety issues are one of the main causes of failure and attrition in drug discovery and development [1, 2]. One challenge has been the possibility to translate pre-clinical findings and anticipate the implications for further clinical development. A major pre-requisite in translational research remains, however, the characterization of the concentration–effect relationships, which can be used as the basis for extrapolation of pharmacokinetic and pharmacodynamic data across species [3]. The aforementioned pre-requisite has been overlooked by the focus on compliance to regulatory guidelines, which currently do not endorse the requirement for the generation of safety data in an integrated manner. By contrast, this could be achieved by applying a model-based approach, which allows one to assess how drug exposure and/or relevant biomarkers relate to drug effects [2, 4, 5].
One area which can benefit substantially from such an approach is the evaluation of the propensity of non-antiarrhythmic drugs to prolong the QT/QTc interval [2, 6]. Prolongation of the QT interval has been associated with the development of polymorphic ventricular tachycardia or torsades de pointes (TdP), one of the major reasons for post-market withdrawal [1, 7]. Despite the fact that the QT interval can easily be measured as part of routine electrocardiogram (ECG) monitoring, assessment of drug-induced QTc interval prolongation relies on empirical criteria, preventing the accurate scaling of drug effects across species [8].
Currently, various in vitro and in vivo systems are available for assessing QT prolongation [9–11], which support decision making for the progression of drug candidates into clinical development. These assays provide in most cases qualitative measures of drug effect and must consequently be complemented by safety data in a thorough-QT (TQT) trial [2, 12–14]. In contrast, the use of a model-based approach offers a strictly quantitative basis for translational research, which can enhance the integration and extrapolation of preclinical data, eventually dismissing the need for additional evidence from a TQT trial.
Recently, we have proposed a pharmacokinetic–pharmacodynamic (PKPD) model to assess the probability of QTc interval prolongation of three compounds known to prolong the QT/QTc interval (d,l-sotalol, moxifloxacin, grepafloxacin) using data from phase I trials in healthy subjects [15]. Our method relies on model parameterization that allows drug-specific properties to be distinguished from the biological or physiological system properties, facilitating the translation of data from preclinical to clinical conditions. In addition, the approach readily allows for the incorporation of prior knowledge, which is abundant from historical data on system-related parameters describing e.g. QT/RR relationship and circadian variability. It also offers the possibility to estimate posterior parameter distributions, which fully reflect all acknowledged sources of uncertainty. From a drug development perspective, this approach can be highly relevant, as it allows prospective evaluation of compounds. Given the distinction between drug- and system-specific parameters, drug effects can be characterised even if hysteresis occurs, as in the case of indirect mechanisms or metabolite-induced QTc interval prolongation.
The objective of this investigation was therefore to explore the predictive value of exposure–effect relationships and corresponding probability of QTc interval prolongation in vivo in conscious dogs as the basis for translating the effects of cisapride, d,l-sotalol and moxifloxacin in humans. Even though any threshold values can be defined for probability curves, our analysis assumes comparable effect size for the increase in QTc interval in dogs and in humans (i.e. ≥10 ms).
Methods
Experimental data
Pre-clinical protocols
A four-way crossover design was used for the evaluation of the QTc interval in conscious, freely moving beagle dogs. All dogs were chronically instrumented with radio telemetry probes measuring blood pressure (BP), ECG and body temperature (T). The ECG electrodes were placed in the lead II position. Animals were administered vehicle, a sub-therapeutic, a therapeutic and a supra-therapeutic oral dose of each compound.
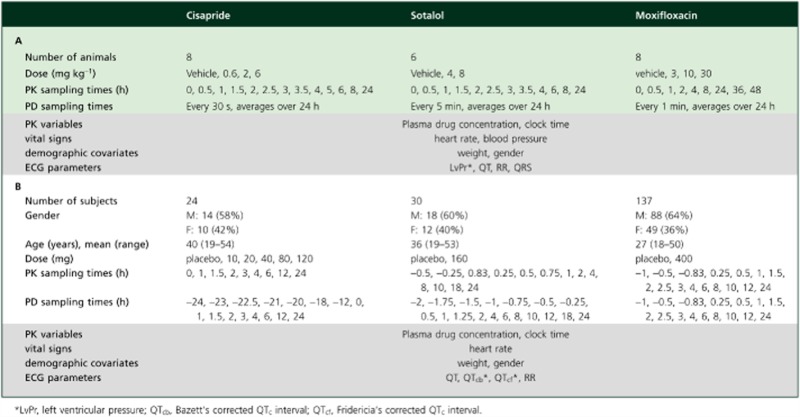
The blood sampling scheme for pharmacokinetics was based on preliminary pharmacokinetic data to ensure accurate characterisation of absorption, distribution and elimination phases. ECG was monitored continuously over the period of 24 h, and averaged every 30 s (cisapride), 1 min (moxifloxacin), or 5 min (d,l-sotalol). Further details on the experimental design and data acquisition are summarized in Table 1A. All studies were approved by the institutional Ethics Committee and conducted according to ethical standards and GLP procedures.
Table 1.
Treatment, measurement variables and sampling scheme details for pre-clinical experiments in conscious dogs (A) and clinical studies in healthy subjects (B)
 |
Clinical protocols
All three protocols were Phase I studies in healthy volunteers. For cisapride, a randomised, placebo-controlled, dose-escalating design was used in which subjects received up to five doses. Due to safety issues, the study was not continued after the fourth dose. d,l-Sotalol data were extracted from a double-blind, randomized, placebo-controlled, three way crossover design in which each subject received one active treatment and two placebo doses. Data for moxifloxacin were available from the positive control arm of a two-way crossover, single-blind, randomised, placebo-controlled trial aimed at evaluating the effect of repeated oral doses of lamotrigine on cardiac conduction. The results of the analysis with moxifloxacin and d,l-sotalol studies were also previously published elsewhere [15]. The studies were conducted in full conformance with the principles of the Declaration of Helsinki and with the local laws and regulations concerning clinical trials. The protocol and the informed consent documents for each study were formally approved by the relevant research Ethics Committee. Further details on the experimental design and data acquisition are summarized in Table 1B.
Pharmacokinetic sampling procedures and bioanalytical methods
Pre-clinical experiments
Cisapride
Approximately 0.5 ml samples were obtained from the jugular vein and transferred into uniquely labelled EDTA tubes. All samples were mixed gently and placed on crushed water-ice until centrifugation at 3000 g for 5 min, which was carried out at approximately 4°C. The resultant plasma was separated, transferred to uniquely labelled clear matrix tubes, frozen immediately over solid carbon dioxide and stored at approximately −80°C until analysis. Cisapride concentrations were analyzed using a method based upon protein precipitation followed by LC-MS/MS analysis. The lower limit of quantification (LLQ) was 0.5 ng ml−1 for a 25 μl aliquot of dog plasma.
Sotalol
Approximately 0.6 ml blood samples were obtained from the jugular vein and transferred to BD-microtainers K2E with K2EDTA, and centrifuged at 8000 rev min−1 for 3 min in a cooled centrifuge. The resultant plasma was separated, transferred to uniquely labelled clear matrix tubes and stored at approximately −18°C or below until analysis. Racemic d,l-sotalol was analyzed using a LC-MS/MS method (Waters UPLC) and an API 4000 mass spectrometer. An Acquity UPLC® BEH hilic, 1.7 μm: 2.1 × 100 mm column was used for the separation by the LC method (with A = 0.1% formic acid and B = CH3OH). The lower limit of quantification (LLQ) was 1 ng ml−1.
Moxifloxacin
Approximately 1.0 ml whole blood samples were obtained from the jugular vein and transferred into uniquely labelled potassium EDTA tubes where plasma was separated by centrifugation. Serum concentrations of moxifloxacin (Ryan Scientific, Mt. Pleasant, SC, USA) were determined by acetonitrile precipitation, followed by analysis using the LC-MS/MS method. Samples were prepared by addition 600 μl of acetonitrile containing 500 ng ml−1 of lomefloxacin (Sigma Chemical Co. Ltd, St Louis, MO) as an internal standard to 25 μl of serum. Moxifloxacin serum concentrations were determined by an API4000 triple quadrupole mass spectrometer (Applied Biosystems, Foster City, CA, USA) equipped with a TurboV™ source. Spectra were acquired by multiple reaction monitoring (MRM) in the positive ionisation mode. The lower limit of quantification (LLQ) was 1 ng ml−1 and the upper limit was 5000 ng ml−1. The same procedure was used for two separate analysis days.
Clinical protocols
For all bio-analysis pertaining to the clinical studies, 3-ml blood samples were collected into vacutainers for the determination of serum concentrations of the specific compound. Blood samples were left to clot at room temperature. After clot retraction occurred, samples were centrifuged at 4°C at 1500 g for 10 min with the minimum of delay. Serum (approximately 1 ml) was carefully pipetted into pre-labelled Nunc 1.8 ml polypropylene tubes, then frozen in an upright position at −20°C until assay. All samples were kept frozen in Cardice pellets during transit and transport to various analysis facilities.
Cisapride
Plasma concentrations of cisapride were determined by a validated HPLC method. The analytical range was between 5.0 and 500 ng ml−1. Each analytical batch of cisapride assays consisted of a set of eight calibrators, freshly prepared in blank heparinized plasma. The lowest calibrator was at the level of the lower limit of quantification and the highest calibrator was at the level of the upper limit of quantification. Back-calculated values of the calibration standards had to be within 15% validation-criterion (20% at LLOQ). The coefficient of variance (CV) per calibration level never exceeded the validation-criterion of ≤15% CV (at LLOQ ≤ 20%) and at 1.6% maximum.
Sotalol
Serum d,l-sotalol concentrations were analyzed using 96-well solid phase extraction/liquid chromatography-tandem mass spectrometry with a quantifiable range of 1.0 to 750 ng ml−1 with % CV ranging from 5.8–13.2 and % accuracy ranging from 93.9–109.9%.
Moxifloxacin
Moxifloxacin was extracted from human plasma by solid-phase extraction using Oasis HLB cartridges with moxifloxacin-d4 as an internal standard. Extracts were analyzed by HPLC-MS/MS using a TurboIonspray interface and multiple reaction monitoring. This method has a lower limit of quantification (LLQ) of 25.0 ng ml−1 using a 50 μl aliquot of human plasma. The analytical range was 25.0–5000 ng ml−1. Within and between-run precision, and accuracy of quantification during the validation was better than 9.62% across the concentration range.
ECG monitoring and sampling procedures
Preclinical experiments
The ECG waveforms were captured with DSI implants, with EMKA IOX (EMKA technologies, France). The data were recorded throughout the experiments. An EMKA ECG Auto analysis software (IOX EMKA technologies, France) was used for the analysis of cisapride, while the Notocord (Notocord-hem, KRN42a, Notocord, France) and the PONEMAH (Cardiovascular Toxicology Laboratory, Covance Laboratories, Greenfield, USA) were used for d,l-sotalol and moxifloxacin, respectively. ECG scans were averaged every 30 s (cisapride), 1 min (moxifloxacin) or 5 min (d,l-sotalol) and individually corrected for RR. The QT intervals were capped if there was more than 10% difference between consecutive QT measurements. This was done to prevent telemetry equipment noise affecting the assessment of drug-induced effects on QT interval. Capping of the data occurred mainly during feeding time (6 h after dosing).
Given the limited number of sampling points required for modelling purposes, somewhat sparse sampling times were subsequently extracted from the original recordings. Sampling windows were selected according the pharmacokinetic properties of each compound, in such a way that data were collected more frequently during the absorption phase and during peak concentrations. Each data point used in the PKPD analysis reflected the average of QT and RR observed during the corresponding sampling interval. In brief, the following sampling intervals were used:
Cisapride 0–2 h after dose: 2 min averaged intervals, 2–10 h after dose: 5 min averaged intervals, 10–24 h after dose: 15 min averaged intervals.
Sotalol 0–10 h after dose: 5 min averaged intervals, 10–24 h after dose: 15 min averaged intervals.
Moxifloxacin 0–2 h after dose: 2 min averaged intervals, 2–10 h after dose: 5 min average samples, 10–47 h after dose: 15 min averaged intervals.
Clinical protocols
ECG monitoring was performed with 12-lead electrocardiogram, using Marquette ECG machines measuring QT, QTc[Bazett], QTc[Fridericia], RR, and HR for the three compounds. The time used to reference the ECG measurements was actual clock-time as recorded in the data collection forms, rather than the planned sampling time indicated in the study protocol. For each study, subjects were kept in a supine position while ECG recordings were made.
In general, subjects in all three studies were restricted to the type and amount of beverages allowed during the study period. Food in predefined amounts was served at strict times of the day. Subjects were asked to refrain from strenuous exercise while on treatment.
Pharmacokinetic (PK) modelling
Time-matched concentration and QT interval values were required for the assessment of the PKPD relationships. Therefore, pharmacokinetic modelling and deconvolution techniques were used to generate the corresponding concentration values for each ECG sampling time. Modelling of the pharmacokinetic data from the clinical studies as well as preclinical experiments with d,l-sotalol and moxifloxacin was performed using non-linear mixed effects techniques in nonmem 6.0 and 7.1.2. (ICON, Maryland, USA). No satisfactory results could be obtained by modelling of the pre-clinical experiments with cisapride. Therefore, deconvolution was selected as the method of choice for the description of the cisapride data in dogs. The use of deconvolution was deemed suitable for the purposes of our investigation, i.e. interpolation of data at time points between the available blood sampling times [16]. This methodology allows the evaluation of drug release and drug absorption (i.e. input function) from orally administered formulations. WINNONLIN v4.1. (Pharsight, USA) uses the basic principle of deconvolution through convolution (DTC) to determine the input function and the optimal smoothing.
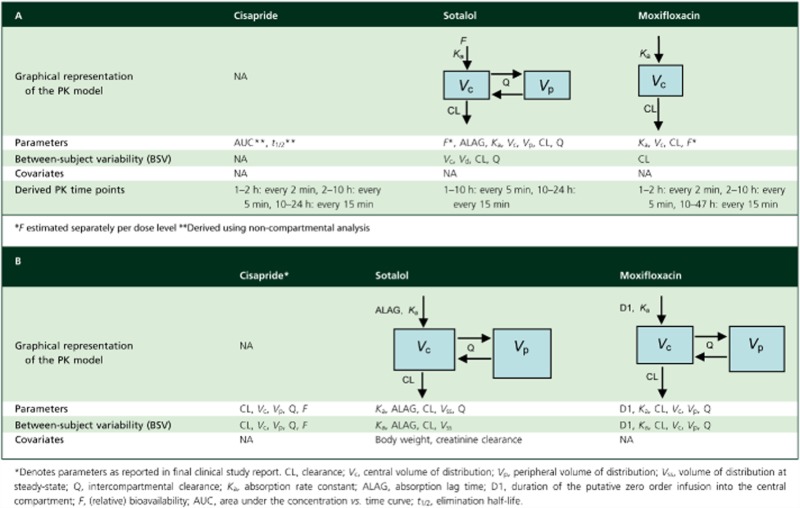
Models and parameters are summarised in Table 2A and B for the three different compounds for dogs and humans, respectively.
Table 2.
Pharmacokinetic models and parameters describing the disposition of cisapride, d,l-sotalol and moxifloxacin in conscious dogs (A) and healthy subjects (B)
 |
PKPD modelling
Model building was performed in WinBUGS version 1.4.2 [17–20]. While the same model describing QTc interval was created for all three compounds for both species, each analysis was conducted independently. A Bayesian adaptation of a model comprising of three components, i.e. an individual correction factor for RR interval (heart rate), an oscillatory component describing the circadian variation and a truncated Emax model to capture drug effects [13, 21], was used as presented in Equation1:
| (1) |
where, QT0 (ms) is the intercept of the QT–RR relationship (gender was included as a covariate for this parameter), RR (s) is the interval between successive R waves, α is the individual heart rate correction factor, A (ms) is the amplitude of circadian rhythm, t is the clock time, φ is the phase, slope (ms/concentration) is the linear pharmacodynamic relationship, and C is the predicted drug concentration at the time of QT measurements.
It should be noted that we have chosen to express the QTc interval in ms, as accepted in clinical practice. However, dimensional analysis of the formulae taking into account heart rate variation show that the proper dimensions of QTc should be (ms)1/2, not ms. Ambiguities involving formulae in terms of heart rate are eliminated by expressing them in terms of RR. When viewed from the physical rather than the statistical perspective, the formulas for QT as a function of RR are equivalent to the duration of systole as a function of heart rate [22]
Priors
The kth observed QT measurement for the jth occasion for the ith individual (QTijk) was assumed to be normally distributed around the individual predicted QT measurement (fijk) with an unknown precision τ:
Non-informative priors were specified as:
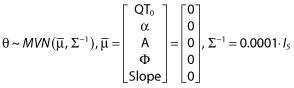 |
where θ is a vector of population mean parameter estimates,  is the prior of the population means, Σ−1 is the precision of the prior for the population mean parameter values and Is is the identity matrix. The inverse of the between subject variance, Ω−1, arises from a Wishart distribution: Ω−1 ∼W(ρΩ, ρ), with ρ = 5 degrees of freedom, where Ω represents our prior guess at the order of magnitude of the covariance matrix. Finally, non-informative gamma (0.0001, 0.0001) priors were assumed for measurement precision and inter-occasion variability of QT0.
Goodness of fit and model diagnostics
Two MCMC chains were run independently for 25 000 samples and then pooled to provide parameter estimates. The posterior distributions provided by WinBUGS allowed the model-predicted results to be compared with the observed values. Appropriateness of the parametric distributions as well as drug model were assessed using the deviance information criterion (DIC) as a measure of the goodness of fit [23, 24]. The number of iterations was deliberately chosen to exclude any residual correlation. Further details of the model have been described elsewhere [15].
The R package R2WinBUGS was used to execute WinBUGS while running a session in R (The R project – http://www.r-project.org/). Convergence was assessed visually by monitoring the dynamic traces of Gibbs iterations and by computing the Gelman–Rubin test statistics [24–27].
Probability of QTc interval prolongation
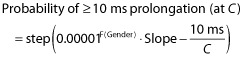
The analysis was performed with a step function in WinBUGS 1.4.3 using the slope and an inter-individual correction factor for gender differences (see equation 2) at the following arbitrary concentration points: 50, 200, 400, 600, 800, 1000, 1200, 1400, 1600, 1800, 2500, 3000, 3500, 4000, 6000, 9000, 10 000, 15 000, 30 000 nm. Data was expressed in nanomolar (nm) to allow direct comparison of the different compounds. The concentration values were chosen in such a way that data points spread across the sigmoid curve.
 |
(2) |
where 0.00001 is set as an arbitrary small number to avoid computational errors associated with numerical difficulties (i.e. division by zero), F(gender) is the gender-specific population estimate for the baseline QTc interval, 10 ms is the QTc interval prolongation threshold of interest, C is the drug concentration and slope is the QT increase per unit drug concentration.
Values were plotted for all three compounds to assess differences in potency and compare the range of exposures associated with the probability of drug-induced QTc prolongation in dogs and humans. Z-score tests were performed to determine whether differences in QTc prolongation per concentration unit (i.e. slope parameter) were statistically significant between species and for different compounds. The mean and standard deviation (SD) of the parameter estimates (drawn from the posterior distributions) were used for the calculations.
Results
Pharmacokinetic (PK) models
Given that most PK samples were taken at different time points relative to the ECG measurements or in a disproportionate fashion with the abundance of ECG recordings in dogs, it was necessary to obtain a balanced dataset for the subsequent PKPD analysis using the Bayesian approach proposed here. Therefore, where appropriate drug concentration data from the clinical experimental protocols were modelled, with the exception of cisapride for which modelling attempts yielded unsatisfactory results in dogs, while time-matched pairs of concentration and ECG measurements were available in humans. Details of the pharmacokinetic models are found in Table 2A and B for dogs and humans, respectively. Model performance is depicted in Figures 1B and C for d,l-sotalol and moxifloxacin. Only the observed data and population averages are shown for cisapride in Figure 1A. A summary of the parameter estimates is shown in Table 3.
Figure 1.

Pharmacokinetic analysis of data in conscious dogs (left) and healthy volunteers (right). (A) cisapride: (upper panel) individual observed concentrations vs. time for a typical subject and (lower panel) observed population median concentrations vs. time; symbols depict different dose levels: ○ and ____ for 0.6 mg kg−1, △ and – – – for 2 mg kg−1, + and - - - for 6 mg kg−1 in conscious dogs, and ○ and ____ for 10 mg, Δ and – – – for 20 mg, + and - - - for 40 mg, x and - – - – for 80 mg, ◊ and — — — for 120 mg in healthy subjects. (B) sotalol: (upper panels) individual predicted concentration vs. time, (middle panels) population predicted concentration vs. time and(lower panels) individual predicted vs. observed sotalol concentrations; symbols depict different dose levels: ○ and ____ for 4 mg kg−1, △ and – – – for 8 mg kg−1 in conscious dogs, and ○ and ____ for 160 mg in healthy subjects. (C) moxifloxacin: (upper panels) individual predicted concentration vs. time, (middle panels) population predicted concentration vs. time and (lower panels) individual predicted vs. observed concentrations; symbols depict different dose levels: ○ and ____ for 3 mg kg−1, △ and – – – for 10 mg kg−1, + and - - - for 30 mg kg−1 in conscious dogs and ○ and ____ for 400 mg in healthy subject
Table 3.
Summary of pharmacokinetic parameter estimates for cisapride, d,l- sotalol, and moxifloxacin in conscious dogs (A) and healthy subjects (B).
| A | ||||||
|---|---|---|---|---|---|---|
| Parameter estimates | Cisapride | Sotalol | Moxifloxacin | |||
| Median | Min, Max | Mean | IIV% | Mean | IIV% | |
| AUC | ||||||
| 0.6 mg/kg | 794 | 295, 1548 | – | – | – | – |
| 2.0 mg kg−1 | 6977 | 860, 12453 | ||||
| 6.0 mg kg−1 | 6873 | 971, 17361 | ||||
| t1/2 | 4.82 | 3.57, 7.57 | – | – | – | – |
| Ka (h−1) | – | – | 1.41 | – | 1.78 | – |
| CL (l h−1) | – | – | 2.79 | 18.3 | 3.39 | 21 |
| Vc (l) | – | – | 3.15 | 100 | 43.23 | – |
| Vp (l) | – | – | 21.8 | 15.8 | – | – |
| ALAG (h) | – | – | 1.41 | – | – | – |
| Q (h−1) | – | – | 16.5 | 35.4 | – | – |
| F* | – | – | 1, 1.21 | – | – | |
| B | |||||||
|---|---|---|---|---|---|---|---|
| Parameter estimates | Cisapride* | Sotalol | Moxifloxacin | ||||
| Median | min, max | Mean | IIV% | Mean | IIV% | ||
| Ka (h−1) | – | – | 1.27 | 57.36 | 2.21 | 88.65 | |
| D1 (h−1) | – | – | – | – | 0.629 | 85.14 | |
| CL (l h−1) | 18 | 7.7, 33.1 | 9.39 | 17.15 | 13.4 | 12.69 | |
| Vss (l) | – | – | 147 | 12.73 | – | – | |
| Vc (l) | 173.5 | 17.8, 255.1 | – | – | 122 | 28.77 | |
| Vp (l) | 265.8 | 12.42, 1384 | – | – | 55.4 | 44.27 | |
| ALAG (h) | – | – | 0.45 | 38.47 | – | – | |
| Q (h−1) | 34.1 | 10.1, 395.1 | 5.58 | 0 | 78.4 | – | |
| F | 0.75 | 0.47, 1 | – | – | – | – | |
F estimated separately per dose level as ratio of the lowest dose
Values for 20 mg dose. CL, clearance; Vc, central volume of distribution; Vp, peripheral volume of distribution; Vss, volume of distribution at steady-state; Q, intercompartmental clearance; Ka, absorption rate constant; ALAG, absorption lag time; D1, duration of the putative zero order infusion into the central compartment; F, (relative) bioavailability; AUC, area under the concentration vs. time curve; t1/2, elimination half-life.
PKPD modelling
PKPD modelling was performed using the recorded ECG measurements and drug concentrations at the corresponding sampling times. If PK samples were not available at the exact ECG sampling times, concentrations were imputed either by simulation or deconvolution techniques. Given the overwhelming amount of ECG recordings in dogs, data filtering was applied to ensure data sets of comparable sizes were used in the joint analysis with clinical data. Data filtering was performed taking into account differences in the absorption and disposition profiles, so that the peak and elimination phase were accurately represented. The filtering scheme is summarised in Table 1A.
With the exception of the baseline parameter in dogs treated with sotalol, all system-specific parameters i.e. baseline QT (QT0), the QT-RR correction factor (α), the amplitude (A) and phase (φ) showed values within the same range within each species. The discrepancy in baseline QT interval in dogs treated with sotalol may result from a possible age difference in the animals used in that experimental protocol. The main difference between compounds and also between dogs and humans was in the drug-specific parameter (i.e. slope). A summary of the analysis for each compound is presented in Table 4A–C. In addition to the typical Bayesian criteria for parameter convergence and model acceptance, graphical summaries using goodness of fit plots (i.e. observed vs. predicted QT values) per compound and species are shown in Figure 2A–C.
Table 4.
Mean estimates and 95% confidence intervals for pharmacokinetic-pharmacodynamic model parameters obtained for cisapride, d,l-sotalol and moxifloxacin after administration of different doses to conscious dogs and healthy subjects
| Parameters | Cisapride | |
|---|---|---|
| Dogs (n = 7) | Healthy subjects (n = 24) | |
| QT0 (ms) | 238 (237, 240) | 386 (382, 390) |
| α | 0.26 (0.20, 0.33) | 0.18 (0.14, 0.23) |
| A (ms) | 5.6 (3.9, 8.1) | 3.3 (1.1, 5.95) |
| φ (h) | 19.9 (15.8, 25.8) | 4.3 (2.4, 8.68) |
| Slope (ms/nm) | 0.0045 (0.00096, 0.0098) | 0.09 (0.087, 0.12) |
| BSV (QT0) % | 6.48 (6.46-6.49) | 2.23 (1.75, 3.01) |
| BSV (α) % | 89 (47, 190) | 17.31 (11.48, 26.95) |
| BSV (A) % | 7.14 (5.32, 10.93) | 6.52 (3.73, 14.57) |
| BSV (φ) % | 7.08 (4.40, 13.13) | 19.04 (11.79, 35.3) |
| BSV (Slope) % | 105 (66, 180) | 48.2 (21.94, 93.5) |
| Residual error (ms) | 5.8 (5.7, 5.9) | 11.66 (11.13, 13.04) |
| Prob effect ≥10 ms at Cmax | 0.75 | 1.0 |
| Cmax (nm) | 2808 | 936 |
| Parameters | d,l-sotalol | |
|---|---|---|
| Dogs s (n = 5) | Healthy subjects (n = 30) | |
| QT0 (ms) | 255 (253, 257) | 387 (383, 392) |
| α | 0.18 (0.11, 0.3) | 0.27 (0.24, 0.3) |
| A (ms) | 6.58 (2.09, 19.78) | 3.3 (2.4, 4.29) |
| φ (h) | 12.15 (6.51, 35.77) | 6.22 (5.05, 7.58) |
| Slope (ms/nm) | 0.002 (0.0006, 0.008) | 0.021 (0.017, 0.026) |
| BSV (QT0) % | 6.25 (6.23, 6.28) | 5.08 (5.05, 5.11) |
| BSV (α) % | 137 (55, 410) | 80 (54, 123) |
| BSV (A) % | 11.02 (8.9, 17.3) | 6.38 (4.08, 10.15) |
| BSV (φ) % | 11.11 (4.73, 30.70) | 13.98 (8.44, 24.24) |
| BSV (Slope) % | 36.8 (22.6, 71.1) | 49.7 (18.2, 108) |
| Residual error (ms) | 9.0 (8.8, 9.3) | 5.9 (5.68, 6.14) |
| Prob effect ≥10 ms at Cmax | 0.9 | 1.0 |
| Cmax (nm) | 22 310 | 5605 |
| Parameters | Moxifloxacin | |
|---|---|---|
| Dogs (n = 8) | Healthy subjects (n = 137) | |
| QT0 (ms) | 240 (238, 242) | 399 (394, 403) |
| α | 0.28 (0.22, 0.35) | 0.40 (0.38, 0.42) |
| A (ms) | 4.6 (3.1, 7.0) | 2.4 (1.7, 2.9) |
| φ (h) | 23.1 (15.1, 34.6) | 10.0 (7.3, 12.9) |
| Slope (ms/nm) | 0.00056 (0.00002, 0.0014) | 0.0039 (0.0033, 0.0044) |
| BSV (QT0) % | 6.46 (6.43, 6.48) | 5.01 (4.98, 5.04) |
| BSV (α) % | 86 (48, 177) | 41 (33, 52) |
| BSV (A) % | 9.8 (7.4, 14.8) | 5.3 (3.6, 8.0) |
| BSV (φ) % | 13 (8, 23) | 18 (10, 31) |
| BSV (Slope) % | 25 (17, 39) | 41 (29, 53) |
| Residual error (ms) | 9.4 (9.3, 9.5) | 5.3 (5.2, 5.4) |
| Prob effect ≥10 ms at Cmax | 1.0 | 1.0 |
| Cmax (nm) | 112 930 | 10 300 |
QT0 (ms) is the intercept of the QT–RR relationship; RR (s) is the interval between successive R waves, α is the individual heart rate correction factor, A (ms) is the amplitude of circadian rhythm, φ (h) is the phase of the cosine function, slope 9ms/concentration) is the linear pharmacodynamic relationship; BSV = between subject variability.
Figure 2.

Pharmacokinetic–pharmacodynamic relationship between QTc interval and plasma concentrations for conscious dogs (left) and healthy subjects (right). The top panels depict the observed QT intervals vs. time stratified by dose, whilst the middle and lower panels show the observed QT intervals vs. population prediction stratified by dose and the observed vs. the predicted individual QT intervals, respectively. (A) cisapride; symbols depict different dose levels: ○ and ___ for placebo, △ and – – – for 0.6 mg kg−1, + and - - - for 2 mg kg−1, x and - – - – for 6 mg kg−1 in conscious dogs, and ○ and ___ for placebo, △ and – – – for 10 mg, + and - - - for 20 mg, x and - – - – for 40 mg, ◊ and — — — for 80 mg, ▿ and - – - – for 120 mg in healthy subjects. (B) d,l-sotalol; symbols depict different dose levels: ○ and ___ for placebo, △ and – – – for 4 mg kg−1, + and - - - for 8 mg kg−1 in conscious dogs, and ○ and ___ for 160 mg in healthy subjects. (C) moxifloxacin; symbols depict different dose levels: ○ and ___ for pre-dose, △ and – – – for placebo, + and - - - for 3 mg kg−1, x and - – - – for 10 mg, ◊ and — — — for 30 mg in conscious dogs, and ○ and ___ for 400 mg in healthy subjects. The lines represent the regression for the population prediction using the model parameters. Dots show the observed QT interval and the corresponding (predicted) individual concentration data
Translational pharmacology
One of the main aspects our modelling exercise was to explore the predictive value of establishing PKPD relationships in dogs as the basis for translating drug-induced QTc interval prolongation from animals to humans. As shown in Figure 3, the use of a common model parameterisation allowed direct comparison of drug-induced effects across species. In fact, PKPD modelling revealed the occurrence of drug-induced QT prolonging effects at different exposure ranges in dogs and humans. Similar model performance was observed across species, as indicated by the goodness of fit plots. Using Bayesian inference, it was possible to estimate the cumulative distribution of posterior samples for the differences between QTc at baseline and QTc after drug administration. The probability of QTc interval prolongation ≥10 ms was then calculated for each compound. Interestingly, the probability curve in humans clearly shows a steeper increase across the therapeutic concentration range of each compound, indicating the risk of QTc prolongation ≥10 ms at such levels. On the other hand, the maximum probability of QTc prolongation is consistently observed at higher exposure in dogs than in humans, suggesting potential differences in the sensitivity to the QTc-prolonging effects across species.
Figure 3.

Goodness-of-fit plots showing model-predicted vs. observed QTc interval (upper panel) and corresponding probability curves for QTc interval prolongation ≥10 ms vs. the predicted plasma concentrations (lower panel) of cisapride (A), d,l-sotalol (B) and moxifloxacin (C). Black dots and dotted lines represent values for conscious dogs, grey dots and solid lines depict data in healthy subjects
Significant differences (P < 0.001) were found in the slope parameters between the preclinical studies and clinical trials for all three compounds. The Z-scores were 3.06, 4.47 and 8.26 for cisapride, d,l-sotalol and moxifloxacin, respectively.
Discussion
PKPD modelling
In this study we have shown how a Bayesian hierarchical model can be used to describe the relationship between drug concentration and QTc interval prolongation for cisapride, d,l-sotalol and moxifloxacin in conscious dogs, establishing their correlation with the pharmacological effects in humans at comparable exposure ranges. Thanks to the explicit distinction between drug-specific and system-specific parameters, our findings suggest that a model-based analysis of pharmacokinetic and QT interval data in dogs may allow inferences to be made about the probability of drug-induced QTc interval prolongation in humans.
Although a direct comparison with published data is not possible, it seems that dogs are slightly less sensitive to the QT prolonging effects, as indicated by the somewhat less steep slope of the concentration−effect curves and lower probability values observed at concentrations relevant to human therapeutic use. It was also evident from the analysis that accurate interpretation of the preclinical findings requires some knowledge about the expected therapeutic range, which was known and well established for the three reference compounds. This is reflected by the estimates of the drug-specific parameter in this model (slope), which does not independently indicate whether there is a risk associated with the use of the compounds, nor whether their development should be stopped. Rather, it provides an unambiguous description of the relationship between concentration and QT prolonging effects taking into account various sources of variability.
We acknowledge that the present work is limited to only three compounds with known pro-arrhythmic properties. As such, we cannot mechanistically explain the observed differences between species nor claim generalisation of the findings. It provides, however, the basis for establishing a conceptual framework for future evaluation of the pro-arrhythmic potential of candidate molecules. From a drug development perspective our approach appears to overcome one of the main limitations of earlier PKPD modelling efforts in preclinical research, i.e. it offers the opportunity to distinguish drug-induced effects in a generic manner, enabling the use of the model for prospective evaluation of novel compounds. Previous modelling attempts have focused on parameter estimation and goodness of fit to describe the observed data, rather than on the use of models as a tool for the predictive purposes [28, 29]. Some recent examples of model-based analysis of QTc prolongation often do not correlate findings to preclinical effects in a direct, quantitative manner. As illustrated by Ollerstam et al., different PKPD models were required to describe pre-clinical and clinical data. In other cases, additional in vitro data was used to correlate findings across species [28, 29]. Furthermore, the choice of parameterisation in these analyses does not allow for the reuse of the model for a different compound or compound class, defeating the main purpose of such models, i.e. their use as a screening tool in early drug development.
Based on the evidence obtained so far, it appears that one of the most important factors for accurate translation of preclinical findings is the ability to evaluate drug effects across a clinically relevant exposure range. Inferences from extremely high dose levels, often used in toxicology experiments, may lead to biased conclusions about the magnitude of the effect on QTc interval and its clinical implication. In addition, our investigation showed some critical shortcomings in current experimental protocols which prevent effective use of model-based approaches in early drug development. Further consideration to this matter is given in the subsequent paragraphs.
Experimental design requirements
The comparative analysis of preclinical and clinical data has provided the basis for further evaluation of the experimental requirements for the assessment of drug-induced QTc interval prolongation using a model-based approach. Clearly, the main shortcoming lies in the way pre-clinical safety experiments are designed, both in terms of dose range and sampling schemes. Furthermore, the sample size should be considered more carefully when extrapolating estimates from preclinical safety experiments. A traditional cardiovascular safety study in conscious dogs has a Latin square, four-way crossover design, using four animals only. In this study we used a larger number of animals to ensure accurate parameter estimation, including estimates of between subject variability. Yet, variability in dogs was found to be much larger than that which is commonly observed in clinical trials. Various procedural differences may explain such differences, including the fact that dogs are freely moving when performing the ECG scan, while subjects are resting in a supine or semi-supine position in clinical studies [2].
With regard to the use of empirical sampling schemes, it should be noted that the choice for limited or sparse sampling (usually three to eight samples) without a clear understanding of the pharmacokinetic properties in the species of interest renders the assessment of PKPD relationships rather difficult and imprecise. Optimal design concepts could be used to prevent or overcome these issues [30, 31]. In conjunction with non-linear mixed effects modelling techniques, optimal sampling can be implemented to eliminate some of the technical challenges due to serial or frequent sampling (e.g. interference with PD measures, total volume of blood per animal). Sampling matrices can also be considered in which some blood samples are collected during ECG monitoring and additional samples are taken on a separate occasion after or before the actual safety experiment. Other important confounding factors for the analysis of PKPD relationships in dogs are variation in age, body temperature and body weight of the animals, which are not collected with the same accuracy as comparable covariates in humans. Younger dogs have higher heart rate, thereby increasing overall noise : signal ratio and less precise baseline (intercept) QTc estimates [32].
Translational modelling of QTc interval prolongation
In drug development, the ideal situation of the prediction of drug-induced QTc interval prolongation would be if in vitro experiments would have a strong predictive value of the clinical outcome, both in qualitative (i.e. pro-arrhythmic drug or not) and quantitative terms (i.e. the magnitude or degree of QTc interval prolongation per concentration unit). The value of a qualitative correlation (trying to avoid false positive and false negative predictions of QTc prolonging compounds) has been demonstrated by De Ponti et al. and Redfern et al. [33, 34]. One of the main issues with such qualitative approaches is that the potentially small QTc prolonging compounds are hard to place. Furthermore, the QTc prolongation per concentration unit reached in humans cannot be predicted, making it impossible to establish recommendations for dosing regimens that yield a ‘safe’ QTc prolongation of <10 ms. We foresee that the PKPD modelling approach presented here will enable quantitative assessment of the pro-arrhythmic properties of a molecule. However, additional compounds need to be evaluated to ensure the disparity between species observed so far is consistent and potentially explained by the underlying differences in pharmacokinetics, pharmacodynamics and/or homeostatic regulatory mechanisms. With increasing numbers of compounds being analysed by the proposed PKPD model, a correlation may be identified between species for the drug-specific parameter, which may serve as basis for translation of pre-clinical findings.
Although our work has focused on the translation of in vivo data, the availability of predictive measures which take in vitro properties into account remains highly desirable. The possibility to make inferences from in vitro measures would imply the generation of less complex experimental data and decision making at an earlier stage of development. Consequently, this could represent an opportunity for less attrition post candidate selection. In fact, we anticipate the possibility of further expanding the concept of a general framework in which in vitro–in vivo correlations are assessed for different classes of compounds in terms of their ion channel binding properties and used as ‘scaling factors or covariates on drug-specific parameters (i.e. the slope).
We have undertaken an initial evaluation of such correlations by analysing hERG assay data for the same compounds (data not shown). However, the hERG patch clamp assay was found to yield extremely variable results, making the use of in vitro data unreliable without a standardised protocol. As shown by Milnes et al., differences in experimental protocols have led to IC50 estimates for cisapride between 7 nm and 72 nm [35]. Additional complexities can also be anticipated for drugs showing multiple ion channel blocking properties, such as cisapride [33, 36]. Another issue is that the in vitro experiments using hERG assays only, would not detect the effects of Ca2+ channel blocking compounds. Martin et al. showed the masking effect of the Ca2+ channel inhibition on the action potential duration (APD) while there was a large hERG inhibition measured, resulting in QTc shortening at higher concentrations after QT prolongation at lower concentrations [37].
An important aspect of our analysis was the opportunity to explore the mismatch often observed between pre-clinical and clinical findings (i.e. false positive or false negative results). Our results suggest that the assessment of QTc interval prolongation using different experimental protocols in preclinical species appears to be meaningless without a clear understanding of the underlying exposure and the corresponding therapeutic range. By contrast, the use of PKPD relationships as a common denominator across species allows one to explore in a more systematic manner whether intrinsic differences exist between dogs and humans and how such differences may be related to known physiological factors. For instance, it is conceivable that the differences in Ikr channel distribution in the left ventricular wall of the canine heart [38] may lead to differences in repolarisation of the heart cells and consequently to a different degree of QT prolongation [39]. The other factor is the difference in basal heart rate, which is considerably higher in dogs. To detect small differences in QT interval, heart rate correction based on population-based correction factors, such as Bazett and Fridericia, may not be equally applicable to dogs [40, 41]
Limitations of the approach
Despite the correlation between findings in dogs and humans and comparable goodness of fit, a potential limitation of our approach is the fact that it relies on a linear regression. The estimation of a slope contrasts with the more commonly used sigmoidal concentration–effect relationship. In clinical trials the Emax (the maximum QTc prolongation) will rarely be seen because subjects are already pulled from the trials due to ECG stopping criteria being reached (e.g. QTc > 500 ms). When the Emax cannot be estimated in a proper fashion, a small misspecification of this value will have a huge effect on the EC50. As the difference of only 10 ms on a 400 ms average QT interval is needed to increase the risk of TdP, the error on the estimate of EC50 could imply false positive or false negative results. The use of this linear concentration−effect relationship will thereby be more accurate in the lower effect range.
As highlighted previously, another limitation to this method is the requirement for higher quality data. When low quality data are used or sampling schemes are applied in an empirical manner, without taking into account drug absorption, distribution and elimination processes, the PK model misspecification can lead to imprecision and consequently result in wide confidence intervals for the slope parameter in equation 1.
In summary, the possibility of using the concentration–effect relationships and assessing the corresponding probability threshold for QTc interval prolongation ≥10 ms across species can greatly enhance the decision-making process for both the regulators and drug developers. Despite the differences between dogs and humans, our findings also show that accurate evaluation of the pro-arrhythmic potential of a novel chemical or biological entity cannot be performed without distinguishing drug-specific parameters from system-specific parameters. Consequently, we envisage the use of the proposed approach as the basis for translational pharmacology research, particularly at the interface between drug discovery and early drug development, making it possible to assess the potential clinical relevance of drug-induced effects in pre-clinical species.
Conflict of Interest
All authors have completed the Unified Competing Interest form at http://www.icmje.org/coi_disclosure.pdf (available on request from the corresponding author) and declare ASYC and VFSD had support from Top Institute Pharma, the Netherlands for the submitted work, there were no financial relationships with any organizations that might have an interest in the submitted work in the previous 3 years and no other relationships or activities that could appear to have influenced the submitted work.
The authors would like to thank the various members of the TI Pharma Cardiovascular Safety Project involved in the preparation of this manuscript: Dinesh De Alwis and Derek Leishman (Eli Lilly & Co); Jackie Bloomer, Nick McMahon and Phil Milliken (GlaxoSmithKline); David Gallagher and An Vermeulen (Johnson & Johnson); Piet van der Graaf and Mark Holbrook (Pfizer); Jeanne Dieleman (Erasmus Medical Center).
References
- 1.Darpo B, Nebout T, Sager PT. Clinical evaluation of QT/QTc prolongation and proarrhythmic potential for nonantiarrhythmic drugs: the International Conference on Harmonization of Technical Requirements for Registration of Pharmaceuticals for Human Use E14 guideline. J Clin Pharmacol. 2006;46:498–507. doi: 10.1177/0091270006286436. [DOI] [PubMed] [Google Scholar]
- 2.ICH Expert Working Group. ICH Harmonised tripartite guideline. E14 Clinical Evaluation of QT/QTc Interval Prolongation and Proarrythmic Potential for Non-Antiarrythmic. Drugs. 2005 [Google Scholar]
- 3.Danhof M, de Lange EC, Della Pasqua OE, Ploeger BA, Voskuyl RA. Mechanism-based pharmacokinetic-pharmacodynamic (PK-PD) modeling in translational drug research. Trends Pharmacol Sci. 2008;29:186–191. doi: 10.1016/j.tips.2008.01.007. [DOI] [PubMed] [Google Scholar]
- 4.ICH Expert Working Group. ICH Harmonised tripartite guideline. S7A Safety pharmacology studies for human pharmaceuticals, 2000.
- 5.ICH Expert Working Group. ICH Harmonised tripartite guideline. S7B The nonclinical evaluation of the potential for delayed ventricular repolarization (QT interval prolongation) by human pharmaceuticals, 2005. [PubMed]
- 6.Fleury A, Lave T, Jonsson F, Schmitt M, Hirkaler G, Polonchuk L, Breidenbach A. A pharmacokinetic-pharmacodynamic model for cardiovascular safety assessment of R1551. J Pharmacol Toxicol Methods. 2011;63:123–133. doi: 10.1016/j.vascn.2010.08.003. [DOI] [PubMed] [Google Scholar]
- 7.Zareba W. Drug induced QT prolongation. Cardiol J. 2007;14:523–533. [PubMed] [Google Scholar]
- 8.Roden DM. Drug-induced prolongation of the QT interval. N Engl J Med. 2004;350:1013–1022. doi: 10.1056/NEJMra032426. [DOI] [PubMed] [Google Scholar]
- 9.Cavero I, Mestre M, Guillon JM, Crumb W. Drugs that prolong QT interval as an unwanted effect: assessing their likelihood of inducing hazardous cardiac dysrhythmias. Expert Opin Pharmacother. 2000;1:947–973. doi: 10.1517/14656566.1.5.947. [DOI] [PubMed] [Google Scholar]
- 10.Hammond TG, Carlsson L, Davis AS, Lynch WG, MacKenzie I, Redfern WS, Sullivan AT, Camm AJ. Methods of collecting and evaluating non-clinical cardiac electrophysiology data in the pharmaceutical industry: results of an international survey. Cardiovasc Res. 2001;49:741–750. doi: 10.1016/s0008-6363(00)00310-2. [DOI] [PubMed] [Google Scholar]
- 11.Netzer R, Ebneth A, Bischoff U, Pongs O. Screening lead compounds for QT interval prolongation. Drug Discov Today. 2001;6:78–84. doi: 10.1016/s1359-6446(00)01602-0. [DOI] [PubMed] [Google Scholar]
- 12.Malik M, Andreas JO, Hnatkova K, Hoeckendorff J, Cawello W, Middle M, Horstmann R, Braun M. Thorough QT/QTc study in patients with advanced Parkinson's disease: cardiac safety of rotigotine. Clin Pharmacol Ther. 2008;84:595–603. doi: 10.1038/clpt.2008.143. [DOI] [PubMed] [Google Scholar]
- 13.Piotrovsky V. Pharmacokinetic-pharmacodynamic modeling in the data analysis and interpretation of drug-induced QT/QTc prolongation. AAPS J. 2005;7:E609–624. doi: 10.1208/aapsj070363. [DOI] [PMC free article] [PubMed] [Google Scholar]
- 14.Vandemeulebroecke M, Lembcke J, Wiesinger H, Sittner W, Lindemann S. Assessment of QT(c)-prolonging potential of BX471 in healthy volunteers. A ‘thorough QT study’ following ICH E14 using various QT(c) correction methods. Br J Clin Pharmacol. 2009;68:435–446. doi: 10.1111/j.1365-2125.2009.03460.x. [DOI] [PMC free article] [PubMed] [Google Scholar]
- 15.Chain AS, Krudys KM, Danhof M, Della Pasqua O. Assessing the probability of drug-induced QTc-interval prolongation during clinical drug development. Clin Pharmacol Ther. 2011;90:867–875. doi: 10.1038/clpt.2011.202. [DOI] [PubMed] [Google Scholar]
- 16.Gabrielsson J, Weiner D. Pharmacokinetic and Pharmacodynamic Data Analysis: Concepts and Applications. 3rd edn. Stockholm: Swedish Pharmaceutical Press; 2001. pp. 275–280. [Google Scholar]
- 17.Lunn DJ, Thomas A, Best N, Spiegelhalter D. WinBUGS – A Bayesian modelling framework: concepts, structure, and extensibility. Stat Comput. 2000;10:325–337. [Google Scholar]
- 18.Spiegelhalter D, Thomas A, Best N, Gils W. BUGS: Bayesian Inference Using Gibbs Sampling, Version 1.4.1. Cambridge: MRC Biostatistics Unit; 2003. [Google Scholar]
- 19.Lunn DJ, Best N, Thomas A, Wakefield J, Spiegelhalter D. Bayesian analysis of population PK/PD models: general concepts and software. J Pharmacokinet Pharmacodyn. 2002;29:271–307. doi: 10.1023/a:1020206907668. [DOI] [PubMed] [Google Scholar]
- 20.Duffull SB, Kirkpatrick CM, Green B, Holford NH. Analysis of population pharmacokinetic data using NONMEM and WinBUGS. J Biopharm Stat Comput. 2005;15:53–73. doi: 10.1081/bip-200040824. [DOI] [PubMed] [Google Scholar]
- 21.Bachman DM. Oral magnesium ion shortens prolonged QTc interval. J Clin Psychiatry. 2003;64:733–734. doi: 10.4088/jcp.v64n0618d. [DOI] [PubMed] [Google Scholar]
- 22.Kovács SJ., Jr The duration of the QT interval as a function of heart rate: a derivation based on physical principles and a comparison to measured values. Am Heart J. 1985;110:872–878. doi: 10.1016/0002-8703(85)90472-7. [DOI] [PubMed] [Google Scholar]
- 23.Spiegelhalter DAK, Myles J. Bayesian Approaches to Clinical Trials and Health Care Evaluations. New York: Wiley; 2004. [Google Scholar]
- 24.Spiegelhalter D, Best N, Carlin B. Bayesian measures of model complexity and fit. J R Stat Soc. 2002;64:583–639. [Google Scholar]
- 25.Brooks SPG. A General methods for monitoring convergence of iterative simulations. J Comput Graph Stat. 1998;7:434–455. [Google Scholar]
- 26.Gelman A, Carlin JB, Stern HS, Rubin DB. Bayesian Data Analysis. London: Capman & Hall; 2003. [Google Scholar]
- 27.Gelman AR. Inference from iterative simulation using multiple sequences. Stat Sci. 1992;7:457–472. [Google Scholar]
- 28.Jonker DM, Kenna LA, Leishman D, Wallis R, Milligan PA, Jonsson EN. A pharmacokinetic-pharmacodynamic model for the quantitative prediction of dofetilide clinical QT prolongation from human ether-a-go-go-related gene current inhibition data. Clin Pharmacol Ther. 2005;77:572–582. doi: 10.1016/j.clpt.2005.02.004. [DOI] [PubMed] [Google Scholar]
- 29.Ollerstam A, Visser SA, Persson AH, Eklund G, Nilsson LB, Forsberg T, Wiklund SJ, Gabrielsson J, Duker G, Al-Saffar A. Pharmacokinetic-pharmacodynamic modeling of drug-induced effect on the QT interval in conscious telemetered dogs. J Pharmacol Toxicol Methods. 2006;53:174–183. doi: 10.1016/j.vascn.2005.07.002. [DOI] [PubMed] [Google Scholar]
- 30.Dodds MG, Hooker AC, Vicini P. Robust population pharmacokinetic experiment design. J Pharmacokinet Pharmacodyn. 2005;32:33–64. doi: 10.1007/s10928-005-2102-z. [DOI] [PubMed] [Google Scholar]
- 31.Nyberg J, Karlsson MO, Hooker AC. Simultaneous optimal experimental design on dose and sample times. J Pharmacokinet Pharmacodyn. 2009;36:125–145. doi: 10.1007/s10928-009-9114-z. [DOI] [PubMed] [Google Scholar]
- 32.Salvi V, Karnad DR, Panicker GK, Natekar M, Hingorani P, Kerkar V, Ramasamy A, de Vries M, Zumbrunnen T, Kothari S, Narula D. Comparison of 5 methods of QT interval measurements on electrocardiograms from a thorough QT/QTc study: effect on assay sensitivity and categorical outliers. J Electrocardiol. 2011;44:96–104. doi: 10.1016/j.jelectrocard.2010.11.010. [DOI] [PubMed] [Google Scholar]
- 33.Redfern WS, Carlsson L, Davis AS, Lynch WG, MacKenzie I, Palethorpe S, Siegl PK, Strang I, Sullivan AT, Wallis R, Camm AJ, Hammond TG. Relationships between preclinical cardiac electrophysiology, clinical QT interval prolongation and torsade de pointes for a broad range of drugs: evidence for a provisional safety margin in drug development. Cardiovasc Res. 2003;58:32–45. doi: 10.1016/s0008-6363(02)00846-5. [DOI] [PubMed] [Google Scholar]
- 34.De Ponti F, Poluzzi E, Montanaro N. Organising evidence on QT prolongation and occurrence of Torsades de Pointes with non-antiarrhythmic drugs: a call for consensus. Eur J Clin Pharmacol. 2001;57:185–209. doi: 10.1007/s002280100290. [DOI] [PubMed] [Google Scholar]
- 35.Milnes JT, Witchel HJ, Leaney JL, Leishman DJ, Hancox JC. Investigating dynamic protocol-dependence of hERG potassium channel inhibition at 37 degrees C: cisapride versus dofetilide. J Pharmacol Toxicol Methods. 2010;61:178–191. doi: 10.1016/j.vascn.2010.02.007. [DOI] [PubMed] [Google Scholar]
- 36.Davie C, Pierre-Valentin J, Pollard C, Standen N, Mitcheson J, Alexander P, Thong B. Comparative pharmacology of guinea pig cardiac myocyte and cloned hERG (I(Kr)) channel. J Cardiovasc Electrophysiol. 2004;15:1302–1309. doi: 10.1046/j.1540-8167.2004.04099.x. [DOI] [PubMed] [Google Scholar]
- 37.Martin RL, McDermott JS, Salmen HJ, Palmatier J, Cox BF, Gintant GA. The utility of hERG and repolarization assays in evaluating delayed cardiac repolarization: influence of multi-channel block. J Cardiovasc Pharmacol. 2004;43:369–379. doi: 10.1097/00005344-200403000-00007. [DOI] [PubMed] [Google Scholar]
- 38.Gintant GA. Regional differences in IK density in canine left ventricle: role of IKs in electrical heterogeneity. Am J Physiol. 1995;268:H604–613. doi: 10.1152/ajpheart.1995.268.2.H604. [DOI] [PubMed] [Google Scholar]
- 39.Antzelevitch C, Sicouri S, Litovsky SH, Lukas A, Krishnan SC, Di Diego JM, Gintant GA, Liu DW. Heterogeneity within the ventricular wall. Electrophysiology and pharmacology of epicardial, endocardial, and M cells. Circ Res. 1991;69:1427–1449. doi: 10.1161/01.res.69.6.1427. [DOI] [PubMed] [Google Scholar]
- 40.Soloviev MV, Hamlin RL, Barrett RM, Chengelis CP, Schaefer GJ. Different species require different correction factor for the QT interval. Cardiovasc Toxicol. 2006;6:51–52. doi: 10.1385/ct:6:2:145. [DOI] [PubMed] [Google Scholar]
- 41.Markert M, Shen R, Trautmann T, Guth B. Heart rate correction models to detect QT interval prolongation in novel pharmaceutical development. J Pharmacol Toxicol Methods. 2011;64:25–41. doi: 10.1016/j.vascn.2011.05.002. [DOI] [PubMed] [Google Scholar]