

Abstract
Background
Maturity date (MD) is a crucial factor for marketing of fresh fruit, especially those with limited shelf-life such as peach (Prunus persica L. Batsch): selection of several cultivars with differing MD would be advantageous to cover and extend the marketing season. Aims of this work were the fine mapping and identification of candidate genes for the major maturity date locus previously identified on peach linkage group 4. To improve genetic resolution of the target locus two F2 populations derived from the crosses Contender x Ambra (CxA, 306 individuals) and PI91459 (NJ Weeping) x Bounty (WxBy, 103 individuals) were genotyped with the Sequenom and 9K Illumina Peach Chip SNP platforms, respectively.
Results
Recombinant individuals from the WxBy F2 population allowed the localisation of maturity date locus to a 220 kb region of the peach genome. Among the 25 annotated genes within this interval, functional classification identified ppa007577m and ppa008301m as the most likely candidates, both encoding transcription factors of the NAC (NAM/ATAF1, 2/CUC2) family. Re-sequencing of the four parents and comparison with the reference genome sequence uncovered a deletion of 232 bp in the upstream region of ppa007577m that is homozygous in NJ Weeping and heterozygous in Ambra, Bounty and the WxBy F1 parent. However, this variation did not segregate in the CxA F2 population being the CxA F1 parent homozygous for the reference allele. The second gene was thus examined as a candidate for maturity date. Re-sequencing of ppa008301m, showed an in-frame insertion of 9 bp in the last exon that co-segregated with the maturity date locus in both CxA and WxBy F2 populations.
Conclusions
Using two different segregating populations, the map position of the maturity date locus was refined from 3.56 Mb to 220 kb. A sequence variant in the NAC gene ppa008301m was shown to co-segregate with the maturity date locus, suggesting this gene as a candidate controlling ripening time in peach. If confirmed on other genetic materials, this variant may be used for marker-assisted breeding of new cultivars with differing maturity date.
Keywords: Maturity date, Prunus persica, QTL, Candidate gene
Background
Fruit ripening is a complex process that involves the coordinated regulation of many metabolic pathways which influence numerous traits such as colour, aroma and flavour. During ripening, softening of the fruit tissues occurs in parallel with the accumulation of sugars, acids, and volatile compounds. Together, these traits contribute to increased palatability. Other characters, such as colour, size, and maturity date, have been selected to offer products with improved consumer appreciation. For practical reasons, fruits are harvested before they are physiologically ripe and are thus often perceived by the consumer as of poor quality. Consequently, the ideotype pursued by modern peach breeding is characterized by an increase of fruit quality associated to an easy harvest (fruit with a firmer texture or very slow softening), in order to reach optimal fruit quality at consumption. Fruit maturity is an important trait and early fruit ripening could allow market growth by extending the length of the production season. Studies in a wide range of plant species have provided insights into the genetic mechanisms that mediate fruit ripening-related processes, such as pigment synthesis, cell wall and sugar metabolism [1-4].
Climacteric fruits such as peach are characterized by an increase in respiration and an autocatalytic burst of ethylene production late in fruit development which is essential for normal fruit ripening. Blocking ethylene synthesis or perception prevents ripening [5-7]. Some tomato mutants (e.g. rin, nor, cnr) are unable to ripen even when treated with exogenous ethylene, although not impaired in the hormone signal transduction pathway [8]; and references therein]. Molecular analyses of these mutants and identification of the corresponding genes indicate that they are necessary for the expression of both ethylene-dependent and -independent genes during ripening, acting upstream of and possibly in parallel to ethylene [8]. In banana, another climacteric fruit, NAC transcription factors have been shown to physically interact with a downstream component of ethylene signaling, ethylene insensitive 3 (EIN3)-like protein, which was down-regulated during ripening [9]. Thus, the control of NAC TFs on ripening is important as that regulated by the hormone.
In peach, QTLs controlling MD have been mapped on different chromosomes, with major QTLs located on linkage group (LG) 4 and 6 [10-13]. By analyzing the Contender x Ambra (CxA) F2 population we have shown that the QTL detected on LG4 behaves as a Mendelian trait and has pleiotropic effects masking the effects of QTLs for different fruit traits [10]. In the present work we refer to this locus as qMD4.1. Recently, a major QTL was also identified in the collinear region of apricot (P. armeniaca L.) and sweet cherry (P. avium L.) suggesting that a common mechanism may control fruit maturation in related Prunus species [13].
In the present study, qMD4.1 was genetically dissected to gain insight into the mechanisms controlling MD in peach and to better understand the genetic interactions of this locus with other fruit traits. To this end, a fine map of the qMD4.1 locus was constructed, increasing the number of markers and individuals in the CxA population and analyzing another F2 population where MD is segregating as a Mendelian trait. Analysis of the region located candidate genes for the MD QTL and a scan of publicly available re-sequencing data for the CxA F1 parent identified polymorphisms in the region harbouring qMD4.1[14]. A sequence variant in a NAC candidate gene was shown to co-segregate with the MD trait in these two populations and can be used in selection for early/late maturity genotypes.
Results and discussion
Fine mapping of the qMD4.1 locus
The objective of this study was to fine map qMD4.1, the MD locus described by Eduardo et al. [10] on LG4 of the CxA F2 population. This locus had been mapped using 169 individuals and a genetic map comprising 31 SSRs and two phenotypic markers, with flanking markers M12a and EPPISF032 defining a 6.6 cM interval, corresponding to 3.56 Mb on the peach reference genome. In order to fine map qMD4.1, the number of individuals of this population was increased to 306 and 14 SNPs were added around and into the original map interval. The SNPs were manually selected from the publicly available genome re-sequencing data of the CxA F1 self-pollinated parent (NCBI Sequence Read Archive, biosample SRS335631). In parallel, we also analysed another F2 population of 103 individuals derived from the cross between PI91459 (N.J. Weeping; W) and Bounty (By), also segregating for MD and genotyped with the 9K SNP peach array v1 [15] (Da Silva et al., unpublished).
In both populations MD showed a trimodal distribution (Figure 1) and very high correlation between years (0.92) (Table 1). This distribution suggested a Mendelian behaviour. Thus, a genome-wide QTL analysis for MD was carried out for confirmation using both populations independently, with the purpose of excluding the possible segregation of other MD QTLs (data not shown). Although segregating as a Mendelian trait in both the CxA and the WxBy F2 populations, MD behaves as a quantitative trait in other populations such as the F1 population derived from the cross between Bolero and OroA [10].
Figure 1.
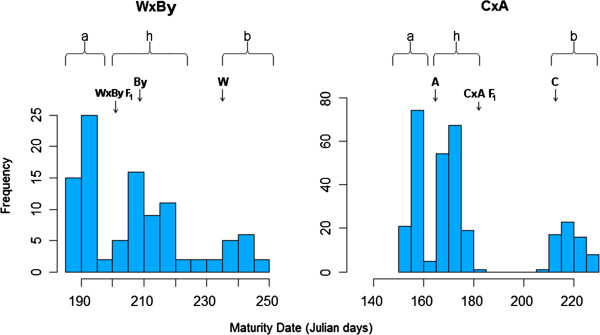
Trimodal distribution of peach MD trait in the WxBy (left) and CxA (right) populations. Arrows indicate the position of values detected for the four parents and the two F1s. For each cross, we refer to the F2 individuals falling in class “a”, h” and “b” as early, intermediate and late ripening, respectively. Each peak of the distribution was considered to represent a genotype for a co-dominant marker in these populations.
Table 1.
Correlation coefficient, mean, minimum and maximum values, and standard deviation (SD) of maturity date in the CxA and WxBy F2 populations for two successive years respectively
| Population | Years | Correlation | Mean | Min | Max | SD |
|---|---|---|---|---|---|---|
| CxA |
2007/2008 |
0.92 |
176.00/177.70 |
151.00/156.00 |
232.00/230.00 |
23.42/22.86 |
| WxBy | 2010/2011 | 0.92 | 207.12/205.83 | 183.00/194.00 | 250.00/242.00 | 17.32/13.51 |
Maturity date is expressed in Julian days at harvest.
Figure 2 shows the region where qMD4.1 is located in both maps, CxA and WxBy, as compared to the data from Eduardo et al. [10]. In both maps high segregation distortion was observed in the target region (Table 2). The analysis of the alleles showed that under-represented alleles came from the C genome in CxA and from W genome in WxBy, in both cases corresponding to the late ripening allele.
Figure 2.
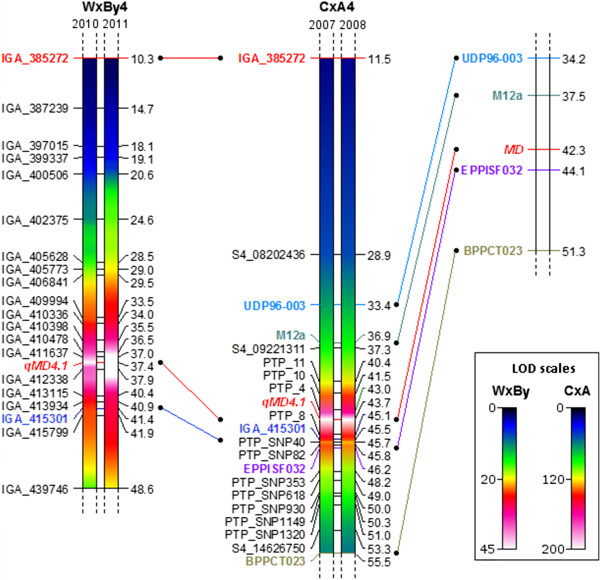
Map comparison of the linkage groups 4 among WxBy, CxA, and the published SSR map of CxA produced by Eduardoet al. [[10]]. Coloured lines represent common markers between WxBy and CxA (SNPs) and the CxA of this study with the CxA map of Eduardo et al. Location of qMD4.1 on the delimited region of chromosome 4 (dashed lines at top and bottom) for two successive years in the two studied populations (years 2010 and 2011 for WxBy; years 2007 and 2008 for CxA) as determined by interval mapping. Marker names are listed on the left side and genetic distances (cM) on the right. QTLs are represented as colour gradients corresponding to the respective LOD scales (reported at bottom-right) and drawn with Harry Plotter software (http://genomics.research.iasma.it/download.html).
Table 2.
LOD scores and percentages of phenotypic variation in CxA and WxBy QTL analyses
|
CxA |
WxBy |
||||||
|---|---|---|---|---|---|---|---|
|
Position (cM) |
Locus |
LOD |
% Expl. |
Position (cM) |
Locus (c) |
LOD 2010/2011 |
% Expl. 2010/2011 |
| 2007/2008 | 2007/2008 | ||||||
| 33.443 |
UDP96003a* |
65.3/67.5 |
64.4/65.3 |
34.015 |
SNP_IGA_410336c**** |
29.59/32.48 |
78.7/77.6 |
| 34.443 |
|
71.7/74.1 |
67.8/68.6 |
34.015 |
SNP_IGA_410265c**** |
29.59/32.48 |
78.7/77.6 |
| 35.443 |
|
76.1/78.6 |
70.0/70.8 |
35.015 |
|
36.24/37.43 |
85/82.2 |
| 36.443 |
|
77.8/80.3 |
70.8/71.6 |
35.493 |
SNP_IGA_410398c**** |
37.92/38.45 |
86.3/83 |
| 36.909 |
M12aa* |
77.6/80.1 |
70.7/71.5 |
36.473 |
SNP_IGA_410478c**** |
41.47/43.07 |
88.6/86.2 |
| 37.301 |
S4_09221311c** |
80.3/83.5 |
71.9/73.0 |
36.961 |
SNP_IGA_411637c**** |
43.15/45.41 |
89.5/87.6 |
| 38.301 |
|
97.7/102.3 |
78.7/79.8 |
37.449 |
MDa**** |
47.81/52.85 |
91.8/91.2 |
| 39.301 |
|
111.5/117.3 |
82.9/84.1 |
37.937 |
SNP_IGA_412338c***** |
41.87/49.34 |
88.8/89.7 |
| 40.301 |
|
117.6/123.7 |
84.5/85.6 |
38.937 |
|
42.12/48.2 |
89/89.1 |
| 40.358 |
PTP_11b** |
117.7/123.8 |
84.5/85.6 |
39.937 |
|
37.29/41.04 |
85.8/84.9 |
| 41.358 |
|
144.0/152.9 |
89.8/90.9 |
40.425 |
SNP_IGA_413115c****** |
34.16/37.05 |
83.3/81.8 |
| 41.522 |
PTP_10b** |
144.8/153.5 |
89.9/91.0 |
40.912 |
SNP_IGA_414017c****** |
31/35.93 |
80.3/80.9 |
| 42.522 |
|
179.7/176.5 |
94.2/93.7 |
41.400 |
SNP_IGA_415301c***** |
28.58/34.91 |
77.6/80 |
| 43.023 |
PTP_4b** |
185.7/178.6 |
94.7/93.9 |
41.888 |
SNP_IGA_415799c**** |
27.32/33.99 |
76.1/79.1 |
|
43.681 |
MDa** |
231.2/224.1 |
97.4/97.0 |
|
|
|
|
| 44.681 |
|
194.1/183.1 |
95.4/94.3 |
|
|
|
|
| 45.149 |
PTP_8b** |
166.2/157.4 |
92.8/91.5 |
|
|
|
|
| 45.507 |
SNP_IGA_415301c* |
154.5/146.3 |
91.3/89.9 |
|
|
|
|
| 45.671 |
PTP_SNP40b** |
146.0/137.6 |
90.1/88.4 |
|
|
|
|
| 45.834 |
PTP_SNP82b** |
139.3/131.1 |
89.0/87.2 |
|
|
|
|
| 46.193 | EPPISF032a* | 148.6/139.5 | 90.5/88.8 | ||||
The highest LOD and percentage of phenotypic variation are indicated in bold with the nearest marker. Positions are indicated in cM (centiMorgan). (a) Markers from Eduardo et al. [10], (b) newly developed markers, (c) markers from Verde et al. [17]. Significance levels of locus-genotype frequencies: *:0.1 **:0.05 ***:0.01 ****:0.005 *****:0.001 ******:0.0005 *******:0.0001.
To define the target region for candidate gene analysis and to anchor the two maps we used the Sequenom platform to genotype the CxA F2 progeny for 2 SNPs that were also included in the 9K SNP peach array v1 (i.e., SNP_IGA_385272 and SNP_IGA_415301; Figure 2).
Considering the region between the anchor markers SNP_IGA_385272 and SNP_IGA_415301 present in both populations, in the CxA map, the region spans 33.99 cM and includes 2 SSRs and 6 SNPs, whereas in the WxBy fine map this region includes 16 SNPs and spans 31.12 cM. The full map from WxBy will be described elsewhere and was used here to run a QTL analysis for the MD trait, showing no other QTL for MD segregating in this population (data not shown). Fine mapping analysis showed that in CxA, qMD4.1 is localized in a window of 2.13 cM between the markers PTP4 and PTP8 spanning the chromosome region between 10.87-12.09 Mb, whereas in the WxBy map qMD4.1 is located in a window of 0.98 cM between markers SNP_IGA_411637 and SNP_IGA_412338 spanning the chromosome region between 10.97-11.19 Mb (Table 2). Moreover, in the CxA progeny LOD score in qMD4.1 region reaches a value of more than 220 (97% of explained variance) while in WxBy LOD score is about 50 with more than 90% of explained variance (Table 2). Therefore this is the region where we focused the search for candidate genes.
Although the CxA F2 population has a higher number of individuals, the WxBy F2 population has a higher number of segregating genotyped markers, which provided a better resolution in the mapping of qMD4.1 (Figure 3). These results showed the utility of the new genomic tools, such as the 9K SNP peach array v1 [15], to improve the efficiency and resolution in peach mapping studies. In addition, the use of the WxBy F2 population allowed us to identify a relatively small region harbouring a limited number of candidate genes compared to the CxA F2 population (Figure 3).
Figure 3.
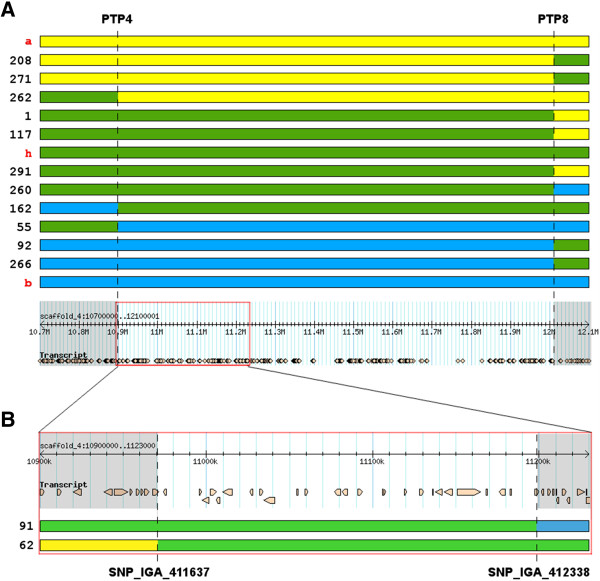
Graphical representation of the region of theqMD4.1locus delimited by recombinants analysis. A) Recombinants identified in the CxA population delimiting the region between SNP markers PTP4 and PTP8 (dashed lines) and aligned to the reference genome (bottom). The red rectangle on the reference genome panel is the region delimited by the WxBy recombinants. B) Detailed region of the qMD4.1 delimited by the SNP marker SNP_IGA_411637 and SNP_IGA_412338 in the WxBy population and aligned to the reference genome (top). The numbers on the left in A) and B) represent the accession ID of the F2 individuals, whereas a, h, and b in red colour represent the three ideal haplotypes. The brownish objects in A) and B) under the “transcript” headings on the reference genome panels represent the annotated genes.
QTLs for MD in a region overlapping with qMD4.1 were already identified by other groups [11,16]. For example, Dirlewanger et al. [13] mapped a major QTL for MD on LG4 using an F2 population derived from the cross Ferjalou Jalousia x Fantasia (JxF): based on available data, qMD4.1 seems to overlap with their confidence intervals in different years, as supported by the SSRs UDP97-402 and AMPA 103, that in JxF defined this region and are located on the peach genome sequence in scaffold 4 at position 10,486,180 and 13,509,355, respectively (approximately 3.02 Mb apart). In contrast to the Mendelian behaviour of qMD4.1 in our populations, in these previous studies MD segregated as a quantitative trait with QTLs mapped on different chromosomes. Interestingly, these studies showed that the region spanning qMD4.1 hosted a cluster of QTLs associated with other traits such as fructose and sucrose content, titrable acidity, pH, sorbitol, maltose, citric acid, and quinic acid content [11]. Recently, an association mapping study showed that another locus mapped at the beginning of chromosome 4, associated with SSR marker CPPCT028 (at 2.1 Mb) was strongly associated with variation for the MD trait [17]. This indicates that other loci controlling MD can be identified using different segregating populations or association mapping. In addition, strong associations between MD, SSC, flavonoids, sorbitol, and total sugars levels were also found in this study [17].
Identification and analysis of candidate genes
Based on overlapping map positions of the qMD4.1 locus in the CxA and WxBy F2 populations, our hypothesis was that allelic variation at the same gene could explain the segregation of the MD trait in both populations. Thus, we searched for genomic variations within the region 10.97-11.19 Mb identified by two WxBy recombinants (Figure 3). Twenty-five genes are annotated in this region of the peach genome (Table 3) and we focused our attention on ppa007577m and ppa008301m, both predicted to encode NAC transcription factors (TFs). NACs constitute one of the largest plant TF families and are key regulators of developmental programs and stress response [18-20], and references therein]. Initially, we Sanger re-sequenced ppa007577m in the four parents C, A, W and By trying to identify polymorphisms within the gene, as well as in the 1.5 kb upstream and downstream flanking sequences. Sequence analysis did not show polymorphisms within the coding region, but revealed a 232 bp deletion, compared to the reference genome (Lovell), at 579 bp upstream of the start codon. PCR amplification of this region showed that C is homozygous for the reference Lovell allele, W homozygous for the deletion, whereas A and By are both heterozygous (data not shown). In addition, PCR analysis of the CxA F1 parent for the 232 bp deletion showed that this individual was homozygous for the reference Lovell allele (C haplotype). Hence, no segregation was expected in the F2 CxA population. To further verify this hypothesis, inspection of this deletion was conducted screening some individuals of the three phenotypic classes (early, middle and late ripening) of the CxA F2 population. As expected from the parents’ analysis, the deletion of 232 bp was absent in the analysed individuals. In contrast, the 232 bp deletion co-segregates with the phenotype in the selected individuals of the WxBy F2 population being the F1 parent heterozygous at this locus. Altogether, these results led us to search for others candidate genes for the MD trait because ppa007577m does not segregate with the MD trait in both populations.
Table 3.
Annotated genes found in the qMD4.1 region restricted by the WxBy recombinants
| Peach gene id | Transcript start | Transcript stop | Description | Pathway |
|---|---|---|---|---|
| ppa022868m |
10974197 |
10975795 |
CBS domain-containing protein |
Response to wounding |
| ppa010307m |
10995538 |
10997054 |
Stem-specific protein TSJT1 |
Anther-specific gene |
| ppa008860m |
10997481 |
11001496 |
Ribosome biogenesis protein BRX1 homolog |
Ribosome biogenesis |
| ppa006721m |
11002389 |
11005897 |
LanC-like protein 2 |
Regulation of abscisic acid mediated signaling |
| ppa006788m |
11005900 |
11008016 |
Protochlorophyllide reductase |
Chlorophyll biosynthetic process |
| ppa001338m |
11009697 |
11015503 |
WD repeat-containing protein 44 |
Endosome membrane (in animal) |
| ppa012067m |
11026020 |
11028069 |
Unknown protein |
Unknown |
| ppa019135m |
11031823 |
11034176 |
Unknown protein |
Unknown |
| ppa000375m |
11034671 |
11041074 |
CIP7 (COP1-INTERACTING PROTEIN 7) |
Anthocyanin and chlorophyll accumulation |
| ppa017913m |
11054156 |
11055142 |
TMV resistance protein N |
Pathogen response |
| ppa008896m |
11059223 |
11060983 |
Peroxidase 47 |
Response to oxidative stress |
| ppa025660m |
11076787 |
11080515 |
Beta-glucosidase 18 |
Lignin biosynthetic process |
| ppa017816m |
11081663 |
11084616 |
Beta-glucosidase 18 |
Lignin biosynthetic process |
| ppa014861m |
11090833 |
11093934 |
ABC transporter G family member 9 |
Transport |
| ppa008301m |
11105983 |
11107728 |
NAC domain-containing protein 72 |
Transcription factor |
| ppa021959m |
11119202 |
11120235 |
Unknown protein |
Putative transposon |
| ppa007577m |
11128296 |
11130419 |
NAC domain-containing protein 18 |
Transcription factor |
| ppa023456m |
11135882 |
11136154 |
Unknown protein |
Putative transposon |
| ppa007209m |
11137776 |
11141711 |
Peroxisomal membrane protein 2 |
Peroxisomal membrane pore-forming activity |
| ppa005409m |
11143135 |
11148005 |
“Peptidyl-prolyl cis-trans isomerase CYP37 |
Protein folding |
| ppa000348m |
11150940 |
11164717 |
Trafficking protein particle complex subunit 10 |
Transport |
| ppa009230m |
11168222 |
11169155 |
Methyltransferase |
Unclear |
| ppa007114m |
11176100 |
11179631 |
PAP-specific phosphatase HAL2-like |
Sulfur compound metabolic process |
| ppa014087m |
11182744 |
11183404 |
Unknown protein |
Unknown |
| ppa001400m | 11197319 | 11200080 | Receptor-like protein kinase THESEUS 1 | Unidimensional cell growth |
We thus focused our attention on the second NAC candidate gene ppa008301m. The Sanger re-sequencing of the four parents and of the two F1 individuals uncovered an in-frame 9 bp insertion (compared to the reference genome) resulting in a tandem duplication of three amino acids in the C-terminal domain (Figure 4). A, C, and By are heterozygous for this variant, whereas W is homozygous without the 9 bp insertion. Both CxA and WxBy F1 individuals were heterozygous for this polymorphism and further analyses on the F2 individuals were conducted to verify its correct segregation with the MD trait. To this end, the 9 bp insertion/deletion (INDEL) was scored using the genotyping protocol used for microsatellites analyses (data not shown). The allelic variants co-segregated with the MD of all the individuals in both F2 populations, with the early ripening individuals showing the 9 bp insertion and the late ripening individuals carrying the Lovell reference allele (Additional file 1). To further verify the map position, we added these data to the previous genotyping dataset used for map construction and QTL analysis. We found that this INDEL co-mapped with the MD phenotypic marker (Additional file 2). Finally, repeating the QTL analysis in both populations showed co-location of this INDEL with qMD4.1 (Additional file 2).
Figure 4.
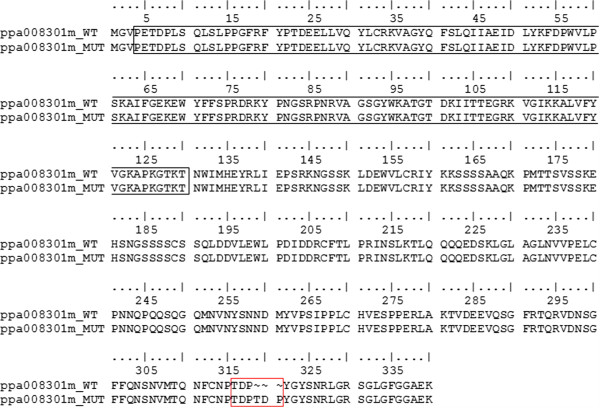
Sequence alignment of the two variants of the NAC TF ppa008301m. ppa008301m_WT indicates the protein sequence without the deletion (identical to the reference genome) whereas ppa008301m_MUT indicates the three amino acids insertion found in this study (red box). The black box indicates the NAC domain.
As an additional confirmation that this 9 bp INDEL found in the last exon of the NAC gene ppa008301m is the most probable polymorphism within the qMD4.1 region, we searched the publicly available paired-end whole-genome next-generation sequencing data of the CxA F1 parent for sequence variants within the original target region. Table 4 reports the results of this analysis. Most of the identified polymorphisms were located in intergenic regions. Only two polymorphisms were found within or near coding regions: the first in the 5′-UTR of a β-glucosidase 18 gene (ppa025660m) involved in carbohydrate and phenylpropanoid metabolism, and the second being the 9 bp insertion in the NAC candidate gene ppa008301m. Even if polymorphisms in intergenic regions could cis-regulate the expression of target genes, the presence of the 9 bp insertion in the coding sequence of this NAC candidate gene supports the hypothesis that the NAC TF ppa008301m is a strong candidate gene for the control of MD in the CxA and WxBy populations.
Table 4.
Detection of polymorphisms in CxA F1 parent from whole-genome re-sequencing data in the qMD4.1 region delimited by the WxBy recombinant individuals
| Position (bp) | Polymorphism type (bp) | Polymorphism position | Peach transcript id | Annotation |
|---|---|---|---|---|
| 10,995,012 |
SNP |
Intergenic |
|
|
| 10,995,076 |
INDEL (2) |
Intergenic |
|
|
| 11,041,083 |
INDEL (2) |
Intergenic |
|
|
| 11,076,551 |
INDEL (1) |
5' UTR |
ppa025660m |
Predicted β-glucosidase 18 |
| 11,086,901 |
SNP |
Intergenic |
|
|
| 11,097,272 |
SNP |
Intergenic |
|
|
| 11,107,278 |
INDEL (9) |
In frame insertion |
ppa008301m |
NAC domain-containing protein 72 |
| 11,115,079 |
INDEL (2) |
Intergenic |
|
|
| 11,115,085 |
INDEL (8) |
Intergenic |
|
|
| 11,115,087 |
INDEL (3) |
Intergenic |
|
|
| 11,115,946 |
INDEL (7) |
Intergenic |
|
|
| 11,115,948 |
SNP |
Intergenic |
|
|
| 11,115,953 |
INDEL (6) |
Intergenic |
|
|
| 11,115,961 |
INDEL (3) |
Intergenic |
|
|
| 11,115,968 |
INDEL (3) |
Intergenic |
|
|
| 11,116,073 |
INDEL (15) |
Intergenic |
|
|
| 11,116,145 |
INDEL (59) |
Intergenic |
|
|
| 11,116,147 |
SNP |
Intergenic |
|
|
| 11,142,067 |
INDEL (1) |
Intergenic |
|
|
| 11,142,748 |
INDEL (1) |
Intergenic |
|
|
| 11,190,195 | SNP | Intergenic |
A phylogenetic analysis of NACs identified in Arabidopsis, rice, wheat, potato, banana and tomato indicates that NAC genes ppa007577m and ppa008301m belong to two distinct clades (Figure 5). NAC ppa007577m clustered with tomato NOR (non-ripening) known to be involved in fruit ripening (GeneBank accession n° AY573802). First mapped on chromosome 10 by Giovannoni et al. [21], the nor gene seems to have a global effect on fruit ripening, probably acting upstream of ethylene synthesis [22]. Related Arabidopsis genes AtNAC2 and AtNAM (namely NARS1 and NARS2, respectively) (Figure 5) control embryogenesis by regulating the development and degeneration of ovule integuments [23]. The clade of ppa007577m includes also rice ONAC10 and wheat NAC TFs NAM_B1 and NAM_B2 (Figure 5). NAM-B1 and NAM-B2 have been shown to be involved in delaying seed ripening with pleiotropic effects on grain protein, zinc, and iron content [24]. In contrast, functional analysis of ONAC10, initially selected by the authors as the most similar rice NAC TF to the wheat NAM_B1, excluded a role in seed ripening while showing that it is essential for correct anther development [20]. Altogether, genes from the ppa007577m clade seem to have undergone a functional diversification, playing roles in distinct biological processes. The clade of NAC TF ppa008301m included genes mainly involved in stress responses as Arabidopsis ANAC072, ANAC055 and ANAC019 [25]. Recently, it has been shown that the closely related ANAC019 and ANAC055 play different roles during developmental senescence [26]. In fact, ANAC019 may be involved in triggering senescence by controlling and activating flavonoid and anthocyanin biosynthesis, whereas ANAC055 seems to be involved in the response to chitin [26]. In addition, these genes showed opposing roles in the regulation the jasmonic and salicylic acid pathways [26]. Unfortunately, literature about the involvement of NAC TFs in ripening is at present very scanty. In banana gene expression profiles in fruit with four different ripening characteristics revealed that MaNAC genes are expressed differentially in peel and pulp during ripening [9]. Additionally, MaNAC1 and MaNAC2 physically interact with MaEIL5 (involved in ethylene signalling), suggesting that these TFs could be involved in banana fruit ripening via interaction with ethylene signaling components.
Figure 5.
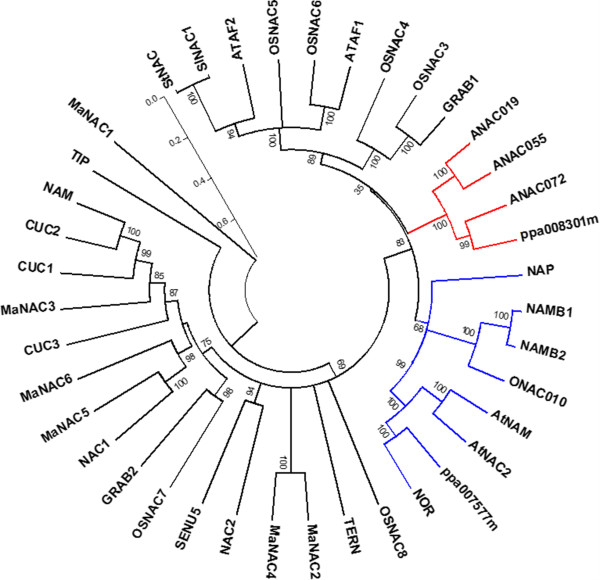
Phylogenetic analysis of peach NAC TF ppa007577m and ppa008301m with NAC TFs identified in other species. The gene names and UniProtKB/Swiss-Prot accession numbers were as follows. Oryza sativa: OsNAC3, OsNAC4, OsNAC5, OsNAC6, OsNAC7, OsNAC8, ONAC010; A. thaliana: ATAF1 and ATAF2, NAP, CUC1, CUC2, CUC3, AtNAC2, NAC1, NAC2, AtNAM, TIP; ANAC019, ANAC055, ANAC072; Petunia hybrida: NAM; Solanum lycopersicum: NOR, SlNAC1; Solanum tuberosum: StNAC1; Lycopersicon esculentum: SENU5; Nicotiana tabacum: TERN; Triticum sp.:GRAB1, GRAB2, NAM-B1, NAM-B2; Musa acuminata: MaNAC1, MaNAC2, MaNAC3, MaNAC4, MaNAC5, MaNAC6. Red and blue branches indicate the two clustering groups of ppa008301m and ppa007577m, respectively. Numbers on branches indicate bootstrap values. Thin bar indicates the scale. Accession number of selected protein sequences are indicated in Methods.
Our results also support the involvement of ppa008301m in the control of peach fruit ripening, indicating that genes in this clade may have evolved to fulfill different biological functions as proposed for the ppa007577m clade. While orthologs are often assumed to retain equivalent functions in different organisms, deviations from this situation are not uncommon [9,27]. Being NACs one of the largest TF families, indication of the precise function of each member should be experimentally validated. The 9 bp INDEL in candidate gene ppa008301m results in the duplication of a threonine-aspartic acid-proline stretch with possible impact on protein function. Simple amino acid repeats and regions rich in serine and threonine, proline and glutamine, or acidic residues are frequent in the C-terminal region of NAC proteins [28-33]. While few studies were focused on NAC post-translational modifications, lysine 268 and 269 in tomato SlNAC1 C-terminal region contribute additively to its degradation, whereas the substitution of both lysine residues with two aspartic acids significantly stabilized the SlNAC1 C-terminal protein sequence [34]. In addition, the C-terminal regions of several NAC proteins function as transcriptional activation domains [19]; and references therein]. Domain deletion analysis on the Arabidopsis NAC gene ATAF1, revealed that the transactivation activity was conferred by the C-terminal domain and did not require the N-terminal domain [35]. Hence, the three amino acid INDEL in ppa008301m, possibly modifying the C-terminal domain structure, might influence the protein stability or its transcriptional activation capability and, consequently, the transcriptional activation of target genes.
Interestingly, we found in both populations that the early ripening individuals possessed the three amino acid insertion in the protein sequence, whereas delayed ripening was associated with the reference allele.
Conclusions
In this study we report the fine mapping of a major locus controlling maturity date trait in peach, using two different populations. The strategy allowed us to restrict the previously described locus from 3.56 Mb to 0.22 Mb. The NAC gene ppa008301m was identified as a strong candidate within this region and a consistent 9 bp insertion in its last exon was proposed as the variant possibly causing early ripening. Further experiments are needed to explore the functional significance of this INDEL. In any case, the marker developed on this sequence polymorphism provides a convenient molecular tool to discriminate early vs. late ripening individuals within the CxA, WxBy and likely other breeding populations. Considering the proposed pleiotropic effect of qMD4.1 on other important fruit traits, our results provide a basis to better define breeding programs for fruit quality improvement.
Methods
Plant material and phenotyping
Two F2 populations were used in this study: a population of 306 individuals derived from the cross between Contender (C) and Ambra (A), and a second population of 103 individuals derived from the cross between N.J. Weeping (W) and Bounty (By). Trees were located in the ASTRA orchards in Castel S. Pietro and Tebano (Emilia Romagna, Italy). Trees of CxA and WxBy progenies were planted on their own roots with a spacing of 1 m within and 4 m between rows and trained as slender spindle (one stem with short lateral scaffolds). Pruning was performed yearly and standard cultural practices were applied. The fruits were thinned before pit hardening to a load of only 30–40 fruits per tree according to vigour, in order to allow a full expression of fruit size not limited by competition.
Twenty fruits per tree were harvested at commercial maturity based on visual colour change and manual evaluation of firmness and the date was recorded. Maturity date (MD) phenotyping was obtained in years 2007–2008 and 2010–2011 for CxA and WxBy, respectively. The MD is defined in Julian days at harvest.
DNA extraction and genotyping
DNA extraction from young leaves was carried out using the DNeasy 96 Plant Kit (QIAGEN). Microsatellite (SSR) amplifications were performed following the multiplex-ready PCR protocol [10].
SNP selection, design and genotyping of the CxA population
For the CxA F2 population, based on the confidence interval identified by Eduardo et al. [10], fine mapping was conducted on the 306 individuals with 16 newly developed SNPs spanning the interval 9–12 Mb on LG4. Putative SNPs were manually selected among those available from sequencing of the F1 CxA and the relevant surrounding sequences (300 bp) were downloaded from the peach Gbrowse available on the IGA website (http://www.appliedgenomics.org/). The Mass ARRAY Assay Design 3.1 software was used to design multiplex reactions in which the selected SNPs were included. Genotyping was performed using iPLEX Gold technology [36] and Mass ARRAY high-throughput DNA analysis mass spectrometry (Sequenom, Inc). All the 14 selected SNPs gave high quality results and were used for further analyses. Information about the primers used for the genotyping is listed in Additional file 3.
SNP selection, design and genotyping of the WxBy population
The 103 individuals from the WxBy F2 population were genotyped using the recently developed Illumina 9,000 SNP array v1 for peach [15]. For SNP array genotyping, DNA was extracted with the DNeasy 96 Plant kit (Qiagen), diluted to 50 ng/μl and sent to IASMA Research and Innovation Centre (San Michele all’Adige, Italy) for genotyping. Genotyping was performed following the manufacturer’s recommendations as described in Verde et al. [15]. SNP data were scored using GenomeStudio Data Analysis software (Illumina Inc.) using a GenCall threshold of 0.15. SNPs with GenTrain score < 0.6 and those showing severe segregation distortion (χ2 test, p < 10-6) and more than 1% of missing data were excluded.
Genetic linkage maps
Genetic linkage analysis and map construction were performed with JoinMap 4 [37]. CxA and WxBy maps were produced and analyzed as “F2” population in the JoinMap 4 software. The recombination threshold value was set at 0.40 and the Kosambi mapping function was used to convert recombination frequencies into map distances. Markers showing distorted segregation were included in the linkage analysis. All linkage groups of both CxA and WxBy maps were calculated at a minimum LOD score of 5. Linkage maps were drawn using the MapChart 2.1 software [38].
QTLs analysis
QTL analysis was carried out using the software MAPQTL version 6.0 [39]. After a test of 10,000 permutations, LOD thresholds of 3.9 in 2007 and 3.8 in 2008 in CxA map, and 3.6 in 2010 and 3.5 in 2011 in WxBy were assessed to accept QTL significance. A stringent significance level of p = 0.005 was adopted as threshold for the detection of a QTL for the individual test in order to obtain an overall significance level of about p = 0.05, as previously suggested by Van Ooijen [39]. QTLs were drawn using the MapChart 2.1 software [38]. For each plant of both F2 populations, maturity date phenotypic data and genotypes of the 9 bp insertion/deletion in the gene model ppa008301m are reported in Additional file 1. In order to visualize the genetic map and QTL features, QTL-LOD profiles were rendered in heatmaps produced by Harry Plotter software developed at the Edmund Mach Foundation (http://genomics.research.iasma.it/download.html).
Discovery and genotyping of the NAC ppa007577m and ppa008301 9 bp INDELs
Sanger sequencing for the candidate genes ppa007577m and ppa008301m was conducted spanning the region 11,126,755-11,131,088 and 11,105,608-11,107,907, respectively, with several primer combinations as described in Additional file 4. The 232 bp deletion in gene ppa007577m was identified by amplifying with the forward and reverse primers 5′-CTACTCATACCCGCCAAGGA-3′ and AACGTCGTCATGAGGTACCC, respectively. PCR reactions contained 1–20 ng of genomic DNA, 1x PCR reaction buffer (16 mM, (NH4)2SO4, 67 mM Tris-Cl pH 8.8 and 0.1% Tween-20), 3 mM MgCl2, 0.2 mM of each dNTP, 40 nM of forward and reverse specific primers (Sigma Life Sciences), 0.1 U of EuroTaq DNA polymerase (EuroClone) and sterile distilled water to 20 μl final volume. The amplification settings consisted in an initial denaturation step of 2 min at 95°C; 30 amplification cycles of 30 s at 94°C, 30 s at 60°C, 30 s at 72°C and a final extension of 5 min at 72°C. PCR products were loaded on a 0.8% agarose gel (Sigma Life Sciences). SSR amplifications were performed following the multiplex-ready PCR protocol as described by Hayden et al. with some modifications [40]. The forward NAC ppa008301-INDEL-specific primer used was synthesized adding at the 5′ end the sequence 5′-ACGACGTTGTAAAA-3′. The protocol also included the use of short, generic primers tagF fluorescently labeled with VIC fluorescent dye (5′-ACGACGTTGTAAAA-3′). PCR reactions contained 1–20 ng of genomic DNA, 1x PCR reaction buffer (16 mM, (NH4)2SO4, 67 mM Tris–HCl pH 8.8 and 0.1% Tween-20), 3 mM MgCl2, 0.2 mM of each dNTP, 100 nM of each tag primer, 40 nM of NAC-INDEL-specific primers (forward: 5′-AGAACTCAGCGGGTTGATAACT-3′; reverse: 5′-TGCACCCCTACTCGATTTCT-3′; Sigma Life Sciences), 0.01 U of EuroTaq DNA polymerase (EuroClone) and sterile distilled water to 8 μl final volume. The amplification program consisted in an initial denaturation step of 2 min at 95°C; 20 pre-amplification cycles of 30 s at 92°C, 30 s at 60°C, 30 s at 72°C; 40 amplification/labeling cycles of 15 s at 92°C, 30 s at 54°C, 30 s at 72°C; and a final extension of 5 min at 72°C followed by 25 min at 25°C.
Detection of polymorphisms in CxA F1 parent from whole-genome re-sequencing data
Publicly available paired-end whole-genome re-sequencing data of Prunus persica accessions (study SRP013437) were downloaded from the NCBI Sequence Read Archive (SRA, http://www.ncbi.nlm.nih.gov/Traces/sra, [41]. For this study we considered biosamples SRS335634 (Lovell Clone PLov2-2 N, run SRR502985), and SRS335631 (F1 Contender x Ambra, run SRR502997). SRA data of each run were dumped in fastq format using the fastq-dump tool of the NCBI sratoolkit v.2.1.16 software (http://www.ncbi.nlm.nih.gov/Traces/sra/sra.cgi?view=software); forward and reverse paired reads were split for each sample into two separate files (option –split-files). Reads were quality trimmed by Trimmomatic v.0.22 [42], trimming leading and trailing bases below a quality threshold of 20, also removing reads having an average quality below 20 (calculated on 8 bp long sliding windows) and trimmed reads shorter than 24 bp. For each sample, only reads passing the quality filtering as matching pairs were retained and aligned to the whole Prunus persica reference genome v1.0 (http://www.rosaceae.org, [14]) using the Burrows-Wheeler Alignment Tool (BWA) v.0.6.2 [43]. The aln (IS linear-time algorithm) and sampe (all default options except –n 25 –N 25) commands were applied, respectively, for constructing suffix array (SA) coordinates of good hits of each individual read and to convert them to chromosomal coordinate and pair the reads. The resulting SAM files were converted to sorted BAM files compliant to the Genome Analysis Toolkit (GATK) format by Picard Tools v.1.77 (http://picard.sourceforge.net/) using, in the order, tools CleanSam, SamFormatConverter and AddOrReplaceReadGroups. GATK-compliant BAM files were submitted to GATK v.2.3-3 [44] for pre-processing procedures, consisting of indel realignment, duplicate removal and base quality score recalibration (BQSR). The data table needed for the recalibration step in BQSR was manually generated upon validated SNP data from the Peach 9 K chip array [15]. Variant discovery procedures were then applied using whole-genome recalibrated alignments across both CxA and Lovell sample simultaneously using GATK HaplotypeCaller tool applying standard hard filtering parameters [45].
Phylogenetic analysis
Known NAC family proteins were collected from the literature and from UniProtKB/Swiss-Prot (http://www.uniprot.org) [46]. The gene names and UniProtKB7Swiss-Prot accession numbers were as follows. Oryza sativa: OsNAC3 [Q7EZT1], OsNAC4 [Q52QH4], OsNAC5 [Q53NF7], OsNAC6 [Q7F2L3], OsNAC7 [Q5Z6B6], OsNAC8 [Q7GCL7], and ONAC010 [Q8H4S4] [31]; A. thaliana: ATAF1 [Q39013] and ATAF2 [Q9C598] [32], NAP [O49255] [47], CUC1 [Q9FRV4] CUC2 [O04017], and AtNAC2 [Q9LD44], [48], CUC3 [Q9S851] [49], NAC1 [Q84TE6] [50], NAC2 [Q84K00] [46], AtNAM [Q9ZNU2] [29], TIP [Q9LKG8] [51], ANAC019 [Q9C932], ANAC055 [Q9LDY8], and ANAC072 [Q93VY3] [52]; Petunia hybrida: NAM [Q40880] [32]; Solanum lycopersicum: NOR [Q56UP7] [46], SlNAC1 [Q6RH27] [34]; Solanum tuberosum: StNAC1 [Q948Z2] [46]; Lycopersicon esculentum: SENU5 [Q43521] [53]; Nicotiana tabacum: TERN [Q9SXQ0] [46]; Triticum sp.: GRAB1[Q9ZRZ3] and GRAB2 [Q9ZRZ2] [33], NAM-B1 [A0SPJ4] and NAM-B2 [A0SPJ6] [24]; Musa acuminata: MaNAC1 [M0TAJ5], MaNAC2 [M0TBV3], MaNAC3 [M0U410], MaNAC4 [M0TDM6], MaNAC5 [M0U3M1], MaNAC6 [M0RNB9] [9]. The phylogenetic analysis was inferred using the Neighbor-Joining method [54]. The bootstrap consensus tree inferred from 1000 replicates [55] is taken to represent the evolutionary history of the taxa analysed [55]. Branches corresponding to partitions reproduced in less than 50% bootstrap replicates are collapsed. The evolutionary distances were computed using the Poisson correction method [56] and are expressed as number of amino acid substitutions per site. The analysis involved in total 39 protein sequences, including ppa007577m and ppa008301m. All ambiguous positions were removed for each sequence pair. There were a total of 708 positions in the final dataset. Evolutionary analyses were conducted in MEGA5 [57].
Competing interests
The authors verify that there are no competing interests.
Authors’ contributions
RP (designed the experiments; conducted the experiments; analysed data; wrote the manuscript); IE (analysed data; wrote the manuscript); IP (collected and analysed phenotypic and genotypic data; revised the manuscript); CDS (analysed data; revised the manuscript); MM (analysed data); IV (provided re-sequencing data prior to publication); ST (genotyping, analysed data; revised the manuscript); LD (genotyping; analysed data; revised the manuscript); GP (analysed data); DB (selected the genetic materials and developed the populations; revised the manuscript); LR (conceived and designed the study; analysed data; helped writing the manuscript). All authors read and approved the final manuscript.
Supplementary Material
Tables reporting the maturity date and the corresponding genotype of both CxA and WxBy F2 individuals analysed in this study.
Repeated QTL analysis including genotyping data from the 9 bp INDEL found in the ppa008301m candidate gene (INDEL). CxA_2007 and CxA_2008 sheets report the QTL analyses in the CxA population for the years 2007 and 2008, respectively. WxBy_2010 and WxBy_2011 sheets report the QTL analyses in the WxBy population for the years 2010 and 2011, respectively. Position: map position in cM; Locus: markers IDs; LOD: LOD score; #iter.: the number of iteration needed to reach the tolerance criterium; mu_A, mu_H, and mu_B: estimated means of the distribution of the quantitative trait associated with the a-, h-, and b-genotypes; variance: the residual variance after fitting the QTL;%Expl.: percentage of the variance explained by the QTL; Additive: the estimated additive effect; Dominance: the estimated dominance effect; GIC: genotypic information coefficient.
Details of the primers used with the Sequenom platform for the SNP genotyping of the CxA F2 population.
Sequences of the primers used for the Sanger screening of the two NAC candidate genes and their upstream and downstream regions.
Contributor Information
Raul Pirona, Email: raul.pirona@tecnoparco.org.
Iban Eduardo, Email: iban.eduardo@cragenomica.es.
Igor Pacheco, Email: igor.pacheco@unimi.it.
Cassia Da Silva Linge, Email: cassia.dasilva@unimi.it.
Mara Miculan, Email: miculan@appliedgenomics.org.
Ignazio Verde, Email: ignazio.verde@entecra.it.
Stefano Tartarini, Email: stefano.tartarini@unibo.it.
Luca Dondini, Email: luca.dondini@unibo.it.
Giorgio Pea, Email: giorgio.pea@tecnoparco.org.
Daniele Bassi, Email: daniele.bassi@unimi.it.
Laura Rossini, Email: laura.rossini@unimi.it.
Acknowledgements
We wish to thank S. Foschi and M. Lama for their valuable contribution in field tree management and harvesting, M. Valdameri and C. Colombi for SSR genotyping and M. Troggio for help with SNP genotyping. This work was supported by an Italian grant to DB funded by private and public agencies “MAS.PES: apricot and peach breeding by molecular-assisted selection” and by the Ministero delle Politiche Agricole Alimentari e Forestali–Italy (MiPAAF) through the project 'DRUPOMICS’ (grant DM14999/7303/08). Work of IP and CDS was supported by Doctorate Fellowships from the Ministero dell’Istruzione, dell’Università e della Ricerca (MIUR) – Italy.
The authors thank the Centre for Applied Biomedical Research (CRBA) of Bologna for valuable contributions to the Sequenom analyses. The authors also thank Fondazione Cassa di Risparmio in Bologna for supporting CRBA.
References
- Carrari F, Fernie AR. Metabolic regulation underlying tomato fruit development. J Exp Bot. 2006;57:1883–1897. doi: 10.1093/jxb/erj020. [DOI] [PubMed] [Google Scholar]
- Fait A, Hanhineva K, Beleggia R, Dai N, Rogachev I, Nikiforova VJ, Fernie AR, Aharoni A. Reconfiguration of the achene and receptacle metabolic networks during strawberry fruit development. Plant Physiol. 2008;148:730–750. doi: 10.1104/pp.108.120691. [DOI] [PMC free article] [PubMed] [Google Scholar]
- Moing A, Aharoni A, Biais B, Rogachev I, Meir S, Brodsky L, Allwood JW, Erban A, Dunn WB, Kay L. et al. Extensive metabolic crosstalk in melon fruit revealed by spatial and developmental combinatorial metabolomics. New Phytol. 2011;190:683–696. doi: 10.1111/j.1469-8137.2010.03626.x. [DOI] [PubMed] [Google Scholar]
- Zhang J, Wang X, Yu O, Tang J, Gu X, Wan X, Fang C. Metabolic profiling of strawberry (Fragaria x ananassa Duch.) during fruit development and maturation. J Exp Bot. 2011;62:1103–1118. doi: 10.1093/jxb/erq343. [DOI] [PubMed] [Google Scholar]
- Ziliotto F, Begheldo M, Rasori A, Bonghi C, Tonutti P. Transcriptome profiling of ripening nectarine (Prunus persica L. Batsch) fruit treated with 1-MCP. J Exp Bot. 2008;59:2781–2791. doi: 10.1093/jxb/ern136. [DOI] [PMC free article] [PubMed] [Google Scholar]
- Schaffer RJ, Friel EN, Souleyre EJ, Bolitho K, Thodey K, Ledger S, Bowen JH, Ma JH, Nain B, Cohen D. et al. A genomics approach reveals that aroma production in apple is controlled by ethylene predominantly at the final step in each biosynthetic pathway. Plant Physiol. 2007;144:1899–1912. doi: 10.1104/pp.106.093765. [DOI] [PMC free article] [PubMed] [Google Scholar]
- Cara B, Giovannoni JJ. Molecular biology of ethylene during tomato fruit development and maturation. Plant Sci. 2008;175:106–113. [Google Scholar]
- Klee HJ, Giovannoni JJ. Genetics and control of tomato fruit ripening and quality attributes. Annu Rev Genet. 2011;45:41–59. doi: 10.1146/annurev-genet-110410-132507. [DOI] [PubMed] [Google Scholar]
- Shan W, Kuang JF, Chen L, Xie H, Peng HH, Xiao YY, Li XP, Chen WX, He QG, Chen JY, Lu WJ. Molecular characterization of banana NAC transcription factors and their interactions with ethylene signalling component EIL during fruit ripening. J Exp Bot. 2012;63:5171–5187. doi: 10.1093/jxb/ers178. [DOI] [PMC free article] [PubMed] [Google Scholar]
- Eduardo I, Pacheco I, Chietera G, Bassi D, Pozzi C, Vecchietti A, Rossini L. QTL analysis of fruit quality traits in two peach intraspecific populations and importance of maturity date pleiotropic effect. Tree Genet Genomes. 2011;7:323–335. [Google Scholar]
- Quilot B, Wu BH, Kervella J, Genard M, Foulongne M, Moreau K. QTL analysis of quality traits in an advanced backcross between Prunus persica cultivars and the wild relative species P. davidiana. Theor Appl Genet. 2004;109:884–897. doi: 10.1007/s00122-004-1703-z. [DOI] [PubMed] [Google Scholar]
- Verde I, Quarta R, Cedrola C, Dettori MT. QTL analysis of agronomic traits in a BC1 peach population. Proceedings of the 5th International Peach Symposium. Acta Hortic. 2002;592:291–297. [Google Scholar]
- Dirlewanger E, Quero-Garcia J, Le Dantec L, Lambert P, Ruiz D, Dondini L, Illa E, Quilot-Turion B, Audergon JM, Tartarini S. et al. Comparison of the genetic determinism of two key phenological traits, flowering and maturity dates, in three Prunus species: peach, apricot and sweet cherry. Heredity (Edinb) 2012;109:280–292. doi: 10.1038/hdy.2012.38. [DOI] [PMC free article] [PubMed] [Google Scholar]
- Verde I, Abbott AG, Scalabrin S, Jung S, Shu S, Marroni F, Zhebentyayeva T, Dettori MT, Grimwood J, Cattonaro F. et al. The high-quality draft genome of peach (Prunus persica) identifies unique patterns of genetic diversity, domestication and genome evolution. Nat Genet. 2013;45:487–494. doi: 10.1038/ng.2586. [DOI] [PubMed] [Google Scholar]
- Verde I, Bassil N, Scalabrin S, Gilmore B, Lawley CT, Gasic K, Micheletti D, Rosyara UR, Cattonaro F, Vendramin E. et al. Development and evaluation of a 9K SNP array for peach by internationally coordinated SNP detection and validation in breeding germplasm. PLoS One. 2012;7:e35668. doi: 10.1371/journal.pone.0035668. [DOI] [PMC free article] [PubMed] [Google Scholar]
- Dirlewanger E, Moing A, Rothan C, Svanella L, Pronier V, Guye A, Plomion C, Monet R. Mapping QTLs controlling fruit quality in peach (Prunus persica (L.) Batsch) Theor Appl Genet. 1999;98:18–31. [Google Scholar]
- Font I, Forcada C, Oraguzie N, Igartua E, Moreno MÁ, Gogorcena Y. Population structure and marker–trait associations for pomological traits in peach and nectarine cultivars. Tree Genet Genomes. 2013;9:331–349. [Google Scholar]
- Jensen MK, Kjaersgaard T, Nielsen MM, Galberg P, Petersen K, O’Shea C, Skriver K. The Arabidopsis thaliana NAC transcription factor family: structure-function relationships and determinants of ANAC019 stress signalling. Biochem J. 2010;426:183–196. doi: 10.1042/BJ20091234. [DOI] [PubMed] [Google Scholar]
- Olsen AN, Ernst HA, Leggio LL, Skriver K. NAC transcription factors: structurally distinct, functionally diverse. Trends Plant Sci. 2005;10:79–87. doi: 10.1016/j.tplants.2004.12.010. [DOI] [PubMed] [Google Scholar]
- Distelfeld A, Pearce SP, Avni R, Scherer B, Uauy C, Piston F, Slade A, Zhao R, Dubcovsky J. Divergent functions of orthologous NAC transcription factors in wheat and rice. Plant Mol Biol. 2012;78:515–524. doi: 10.1007/s11103-012-9881-6. [DOI] [PMC free article] [PubMed] [Google Scholar]
- Giovannoni JJ, Noensie EN, Ruezinsky DM, Lu X, Tracy SL, Ganal MW, Martin GB, Pillen K, Alpert K, Tanksley SD. Molecular genetic analysis of the ripening-inhibitor and non-ripening loci of tomato: a first step in genetic map-based cloning of fruit ripening genes. Mol Gen Genet. 1995;248:195–206. doi: 10.1007/BF02190801. [DOI] [PubMed] [Google Scholar]
- Osorio S, Alba R, Damasceno CM, Lopez-Casado G, Lohse M, Zanor MI, Tohge T, Usadel B, Rose JK, Fei Z. et al. Systems biology of tomato fruit development: combined transcript, protein, and metabolite analysis of tomato transcription factor (nor, rin) and ethylene receptor (Nr) mutants reveals novel regulatory interactions. Plant Physiol. 2011;157:405–425. doi: 10.1104/pp.111.175463. [DOI] [PMC free article] [PubMed] [Google Scholar]
- Kunieda T, Mitsuda N, Ohme-Takagi M, Takeda S, Aida M, Tasaka M, Kondo M, Nishimura M, Hara-Nishimura I. NAC family proteins NARS1/NAC2 and NARS2/NAM in the outer integument regulate embryogenesis in Arabidopsis. Plant Cell. 2008;20:2631–2642. doi: 10.1105/tpc.108.060160. [DOI] [PMC free article] [PubMed] [Google Scholar]
- Uauy C, Distelfeld A, Fahima T, Blechl A, Dubcovsky J. A NAC Gene regulating senescence improves grain protein, zinc, and iron content in wheat. Science. 2006;314:1298–1301. doi: 10.1126/science.1133649. [DOI] [PMC free article] [PubMed] [Google Scholar]
- Tran LS, Nakashima K, Sakuma Y, Simpson SD, Fujita Y, Maruyama K, Fujita M, Seki M, Shinozaki K, Yamaguchi-Shinozaki K. Isolation and functional analysis of Arabidopsis stress-inducible NAC transcription factors that bind to a drought-responsive cis-element in the early responsive to dehydration stress 1 promoter. Plant Cell. 2004;16:2481–2498. doi: 10.1105/tpc.104.022699. [DOI] [PMC free article] [PubMed] [Google Scholar]
- Hickman R, Hill C, Penfold CA, Breeze E, Bowden L, Moore JD, Zhang P, Jackson A, Cooke E, Bewicke-Copley F. et al. A local regulatory network around three NAC transcription factors in stress responses and senescence in Arabidopsis leaves. Plant J. 2013;75(1):26–39. doi: 10.1111/tpj.12194. [DOI] [PMC free article] [PubMed] [Google Scholar]
- Gabaldon T, Koonin EV. Functional and evolutionary implications of gene orthology. Nat Rev Genet. 2013;14:360–366. doi: 10.1038/nrg3456. [DOI] [PMC free article] [PubMed] [Google Scholar]
- Aida M, Ishida T, Fukaki H, Fujisawa H, Tasaka M. Genes involved in organ separation in Arabidopsis: an analysis of the cup-shaped cotyledon mutant. Plant Cell. 1997;9:841–857. doi: 10.1105/tpc.9.6.841. [DOI] [PMC free article] [PubMed] [Google Scholar]
- Duval M, Hsieh TF, Kim SY, Thomas TL. Molecular characterization of AtNAM: a member of the Arabidopsis NAC domain superfamily. Plant Mol Biol. 2002;50:237–248. doi: 10.1023/a:1016028530943. [DOI] [PubMed] [Google Scholar]
- Hegedus D, Yu M, Baldwin D, Gruber M, Sharpe A, Parkin I, Whitwill S, Lydiate D. Molecular characterization of Brassica napus NAC domain transcriptional activators induced in response to biotic and abiotic stress. Plant Mol Biol. 2003;53:383–397. doi: 10.1023/b:plan.0000006944.61384.11. [DOI] [PubMed] [Google Scholar]
- Kikuchi K, Ueguchi-Tanaka M, Yoshida KT, Nagato Y, Matsusoka M, Hirano HY. Molecular analysis of the NAC gene family in rice. Mol Gen Genet. 2000;262:1047–1051. doi: 10.1007/pl00008647. [DOI] [PubMed] [Google Scholar]
- Souer E, van Houwelingen A, Kloos D, Mol J, Koes R. The no apical meristem gene of Petunia is required for pattern formation in embryos and flowers and is expressed at meristem and primordia boundaries. Cell. 1996;85:159–170. doi: 10.1016/s0092-8674(00)81093-4. [DOI] [PubMed] [Google Scholar]
- Xie Q, Sanz-Burgos AP, Guo H, Garcia JA, Gutierrez C. GRAB proteins, novel members of the NAC domain family, isolated by their interaction with a geminivirus protein. Plant Mol Biol. 1999;39:647–656. doi: 10.1023/a:1006138221874. [DOI] [PubMed] [Google Scholar]
- Huang W, Miao M, Kud J, Niu X, Ouyang B, Zhang J, Ye Z, Kuhl JC, Liu Y, Xiao F. SlNAC1, a stress-related transcription factor, is fine-tuned on both the transcriptional and the post-translational level. New Phytol. 2013;197:1214–1224. doi: 10.1111/nph.12096. [DOI] [PubMed] [Google Scholar]
- Lu PL, Chen NZ, An R, Su Z, Qi BS, Ren F, Chen J, Wang XC. A novel drought-inducible gene, ATAF1, encodes a NAC family protein that negatively regulates the expression of stress-responsive genes in Arabidopsis. Plant Mol Biol. 2007;63:289–305. doi: 10.1007/s11103-006-9089-8. [DOI] [PubMed] [Google Scholar]
- Jurinke C, van den Boom D, Cantor CR, Koster H. Automated genotyping using the DNA MassArray technology. Methods Mol Biol. 2002;187:179–192. doi: 10.1385/1-59259-273-2:179. [DOI] [PubMed] [Google Scholar]
- Van Ooijen J. JoinMap 4, software for the calculation of genetic linkage maps in experimental populations. Wageningen, Netherlands: Kyazma BV; 2006. [Google Scholar]
- Voorrips RE. MapChart: software for the graphical presentation of linkage maps and QTLs. J Hered. 2002;93:77–78. doi: 10.1093/jhered/93.1.77. [DOI] [PubMed] [Google Scholar]
- Van Ooijen J. MapQTL 6, Software for the mapping of quantitative trait loci in experimental populations of diploid species. Wageningen, Netherlands: Kyazma BV; 2009. [Google Scholar]
- Hayden MJ, Nguyen TM, Waterman A, Chalmers KJ. Multiplex-ready PCR: a new method for multiplexed SSR and SNP genotyping. BMC Genomics. 2008;9:80. doi: 10.1186/1471-2164-9-80. [DOI] [PMC free article] [PubMed] [Google Scholar]
- Wheeler DL, Barrett T, Benson DA, Bryant SH, Canese K, Chetvernin V, Church DM, Dicuccio M, Edgar R, Federhen S. et al. Database resources of the national center for biotechnology information. Nucleic Acids Res. 2008;36:D13–D21. doi: 10.1093/nar/gkm1000. [DOI] [PMC free article] [PubMed] [Google Scholar]
- Lohse M, Bolger AM, Nagel A, Fernie AR, Lunn JE, Stitt M, Usadel B. RobiNA: a user-friendly, integrated software solution for RNA-Seq-based transcriptomics. Nucleic Acids Res. 2012;40:W622–W627. doi: 10.1093/nar/gks540. [DOI] [PMC free article] [PubMed] [Google Scholar]
- Li H, Durbin R. Fast and accurate short read alignment with burrows-wheeler transform. Bioinformatics. 2009;25:1754–1760. doi: 10.1093/bioinformatics/btp324. [DOI] [PMC free article] [PubMed] [Google Scholar]
- McKenna A, Hanna M, Banks E, Sivachenko A, Cibulskis K, Kernytsky A, Garimella K, Altshuler D, Gabriel S, Daly M, DePristo MA. The genome analysis toolkit: a MapReduce framework for analyzing next-generation DNA sequencing data. Genome Res. 2010;20:1297–1303. doi: 10.1101/gr.107524.110. [DOI] [PMC free article] [PubMed] [Google Scholar]
- DePristo MA, Banks E, Poplin R, Garimella KV, Maguire JR, Hartl C, Philippakis AA, del Angel G, Rivas MA, Hanna M. et al. A framework for variation discovery and genotyping using next-generation DNA sequencing data. Nat Genet. 2011;43:491–498. doi: 10.1038/ng.806. [DOI] [PMC free article] [PubMed] [Google Scholar]
- Reorganizing the protein space at the Universal protein resource (UniProt) Nucleic Acids Res. 2012;40:D71–D75. doi: 10.1093/nar/gkr981. [DOI] [PMC free article] [PubMed] [Google Scholar]
- Sablowski RW, Meyerowitz EM. A homolog of NO APICAL MERISTEM is an immediate target of the floral homeotic genes APETALA3/PISTILLATA. Cell. 1998;92:93–103. doi: 10.1016/s0092-8674(00)80902-2. [DOI] [PubMed] [Google Scholar]
- Takada S, Hibara K, Ishida T, Tasaka M. The CUP-SHAPED COTYLEDON1 gene of Arabidopsis regulates shoot apical meristem formation. Development. 2001;128:1127–1135. doi: 10.1242/dev.128.7.1127. [DOI] [PubMed] [Google Scholar]
- Vroemen CW, Mordhorst AP, Albrecht C, Kwaaitaal MA, de Vries SC. The CUP-SHAPED COTYLEDON3 gene is required for boundary and shoot meristem formation in Arabidopsis. Plant Cell. 2003;15:1563–1577. doi: 10.1105/tpc.012203. [DOI] [PMC free article] [PubMed] [Google Scholar]
- Xie Q, Frugis G, Colgan D, Chua NH. Arabidopsis NAC1 transduces auxin signal downstream of TIR1 to promote lateral root development. Genes Dev. 2000;14:3024–3036. doi: 10.1101/gad.852200. [DOI] [PMC free article] [PubMed] [Google Scholar]
- Ren T, Qu F, Morris TJ. HRT gene function requires interaction between a NAC protein and viral capsid protein to confer resistance to turnip crinkle virus. Plant Cell. 2000;12:1917–1926. doi: 10.1105/tpc.12.10.1917. [DOI] [PMC free article] [PubMed] [Google Scholar]
- Ooka H, Satoh K, Doi K, Nagata T, Otomo Y, Murakami K, Matsubara K, Osato N, Kawai J, Carninci P. et al. Comprehensive analysis of NAC family genes in Oryza sativa and Arabidopsis thaliana. DNA Res. 2003;10:239–247. doi: 10.1093/dnares/10.6.239. [DOI] [PubMed] [Google Scholar]
- John I, Hackett R, Cooper W, Drake R, Farrell A, Grierson D. Cloning and characterization of tomato leaf senescence-related cDNAs. Plant Mol Biol. 1997;33:641–651. doi: 10.1023/a:1005746831643. [DOI] [PubMed] [Google Scholar]
- Saitou N, Nei M. The neighbor-joining method: a new method for reconstructing phylogenetic trees. Mol Biol Evol. 1987;4:406–425. doi: 10.1093/oxfordjournals.molbev.a040454. [DOI] [PubMed] [Google Scholar]
- Felsenstein J. Confidence limits on phylogenies: an approach using the bootstrap. Evolution. 1985;39:783–791. doi: 10.1111/j.1558-5646.1985.tb00420.x. [DOI] [PubMed] [Google Scholar]
- Zuckerkandl E, Pauling L. In: Evolving Genes and Proteins. Bryson V, Vogel HJ, editor. NY: Academic Press; 1965. Evolutionary Divergence and Convergence in Proteins. [Google Scholar]
- Tamura K, Peterson D, Peterson N, Stecher G, Nei M, Kumar S. MEGA5: molecular evolutionary genetics analysis using maximum likelihood, evolutionary distance, and maximum parsimony methods. Mol Biol Evol. 2011;28:2731–2739. doi: 10.1093/molbev/msr121. [DOI] [PMC free article] [PubMed] [Google Scholar]
Associated Data
This section collects any data citations, data availability statements, or supplementary materials included in this article.
Supplementary Materials
Tables reporting the maturity date and the corresponding genotype of both CxA and WxBy F2 individuals analysed in this study.
Repeated QTL analysis including genotyping data from the 9 bp INDEL found in the ppa008301m candidate gene (INDEL). CxA_2007 and CxA_2008 sheets report the QTL analyses in the CxA population for the years 2007 and 2008, respectively. WxBy_2010 and WxBy_2011 sheets report the QTL analyses in the WxBy population for the years 2010 and 2011, respectively. Position: map position in cM; Locus: markers IDs; LOD: LOD score; #iter.: the number of iteration needed to reach the tolerance criterium; mu_A, mu_H, and mu_B: estimated means of the distribution of the quantitative trait associated with the a-, h-, and b-genotypes; variance: the residual variance after fitting the QTL;%Expl.: percentage of the variance explained by the QTL; Additive: the estimated additive effect; Dominance: the estimated dominance effect; GIC: genotypic information coefficient.
Details of the primers used with the Sequenom platform for the SNP genotyping of the CxA F2 population.
Sequences of the primers used for the Sanger screening of the two NAC candidate genes and their upstream and downstream regions.