

Abstract
Non-alcoholic steatohepatitis (NASH) is a common pre-neoplastic condition of hepatocellular carcinoma (HCC). Mice with hepatocytic deletion of Pten develop NASH and HCC later in life. This model is highly valuable for studies aimed at identifying the molecular mechanism by which metabolic disorders contribute to tumor development. We applied proteomic and lipidomic profiling approaches to Pten null NASH liver and tumors. Circulating fatty acid composition was also characterized in these mice. The relevance to human NASH and HCC was further validated. This integrative proteomic and lipidomic study from mouse to human and from liver to blood, identified the following disease signatures: 1- an HCC signature: upregulated hepatic scd1/scd2, fads2 and acsl5:acsl1 ratio, elevated vaccenic and erucic acids and reduced margaric and linoleic acids in both liver and plasma; 2- a NASH signature that correlates with tumor burden: upregulated hepatic elovl6, elevated oleic, adrenic and osbond acids and reduced cervonic acid in liver and plasma; and 3- a NASH signature: reduced hepatic and circulating lignoceric and eicosapentaenoic acids. Altogether, these results demonstrate the role of lipid-modifying enzymes converting SFAs to MUFAs in HCC and the importance of an increased ratio of long chain n6-PUFAs over n3-PUFAs in NASH and HCC risk. They also highlight the relevance of the Pten null model for studies related to NASH and HCC and demonstrate that circulating lipid metabolome provides a direct read of lipid changes in the liver. Most importantly, novel candidate targets for HCC diagnosis, therapy, risk assessment and prevention were identified.
Keywords: Liver cancer, proteomics, lipidomics, NASH
Introduction
Non-alcoholic steatohepatitis (NASH) is recognized as a common preneoplastic condition associated with hepatocellular carcinoma (HCC) (1). Fatty acids, lipogenic proteins and fatty-acid modifying enzymes may therefore play an important role in the early steps of hepatocarcinogenesis. Mice with liver specific deletion of the phosphoinositide 3-kinase (PI3K)/phosphatase and tensin homolog (Pten) represent a valuable model for such study as PTEN loss of function in hepatocytes leads to NASH and HCC later in life (2, 3).
Through mass-spectrometry-based profiling of the liver tissues collected at different disease stages in this mouse model, we have characterized changes in the liver proteome occurring in NASH as well as in HCC. We previously reported changes for proteins of the extracellular matrix and their receptors (4). Here we are reporting changes in proteins associated with lipid metabolism. This information is further integrated with fatty acid profiles performed in both liver tissue and plasma. Relevance to human disease was also evaluated. Delineating the fatty acid and associated proteome changes in NASH and HCC represents a unique and important contribution to our understanding of the molecular mechanisms of early hepatocarcinogenesis, and to ongoing efforts to identify novel diagnostic and therapeutic targets.
Materials and Methods
Mouse samples
Mice carrying Pten conditional knockout alleles were crossed with an Albumin (Alb)-Cre-transgenic mouse. The Alb-Cre-transgenic mice were genotyped using Cre specific primers. For this model, control animals are PtenloxP/+; Alb-Cre+. All mice were fasted overnight before necropsy. Liver tissue samples were collected from 12-month old PTEN null mice with HCCs and from 12-month old control mice and were immediately snap-frozen in liquid nitrogen. Blood was collected from the same mice via cardiac puncture and plasma was prepared and stored at −80°C. This study was carried out in strict accordance with the regulations of the U.S. National Institutes of Health. The animal protocol was approved and reviewed by the Institutional Animal Care and Use Committee of the Fred Hutchinson Cancer Research Center.
Protein extraction, separation and mass spectrometry analysis were performed as previously described (4). Acquired data were processed using the X!Tandem search algorithm and PeptideProphet and ProteinProphet statistical tools. Proteins identified with a ProteinProphet score ≥ 0.9 and with at least 2 peptides were selected. In our data sets, a 0.9 ProteinProphet score corresponds to a rate of misclassification of 1%. Relative abundance scores were calculated for individual proteins based on total peptide counts normalized to account for the total amount of protein in the mixture.
Human samples
Plasma samples were collected following informed consent from patients enrolled at Yonsei University College of Medicine, Seoul, Korea. Assays were performed at the Fred Hutchinson Cancer Research Center. The study was performed in compliance with and after approval from the respective Institutional Review Boards of all sites. HCC was diagnosed according to the AASLD guidelines (5). The presence of cirrhosis and/or NASH was defined by histology. All NASH patients followed these criteria: absence of HCV RNA and hepatitis B virus surface antigen, self-reported alcohol consumption in the preceding six months, or histological features suggestive of primary biliary cirrhosis, autoimmune hepatitis, or iron overload. For hepatic histology assessment, steatosis, ballooning degeneration, inflammation, and fibrosis were scored according to the currently accepted scoring system. In this scoring system, the scores for steatosis grade (0–3), lobular inflammation (0–3), and ballooning (0–2) can be summed to yield a NAFLD Activity Score (NAS) with scores ≥ 5 being considered diagnostic for histological steatohepatitis. A total of 30 patients, including 15 patients with HCC and 15 patients with cirrhosis, were selected for this study. The characteristics of these patients are shown in Table S1.
Quantitative PCR and western-blot
Total RNA was extracted from individual mouse liver tissue and purified using the miRNeasy extraction kit (Qiagen). RNA samples were then submitted to reverse transcription and real-time PCR using specific primers listed in Table S2. cDNA equivalent was amplified with the iCycler MyiQ using SYBR green supermix and analyzed by MyiQ software (Bio-Rad Laboratories) and relative quantification of RNA expression was calculated with the 2−ΔΔCt method. 18S quantification was used for normalization.
Mouse liver proteins (20µg) were separated on a 10% SDS-PAGE gel and transferred to nitrocellulose membranes (Trans-blot, Biorad, USA). The membranes were incubated with primary antibodies against Fads1 (ab126706, Abcam) and Scd1 (ab19862, Abcam) at the dilution of 1:1000. Signals were detected by the chemiluminescence kit (Clarity Western ECL Substrate, Biorad) and visualized by the digital imager (ChemiDoc XRS+ system, Biorad). Proteins were quantified by the ImageJ software.
Fatty acids profiling
Liver tissue samples (20 mg) were homogenized in a 2:1 chloroform:methanol solution using 1.4mm stainless steel beads and bullet blender. Total lipids were extracted from the homogenized liver samples or from 140 ul of plasma as previously described (6). Different lipids (phospholipids, free cholesterol, free fatty acids, triglycerides and cholesteryl esters) were separated by one dimensional thin layer chromatography (7). Fatty acid methyl ester (FAME) samples were prepared by direct transesterification (8) and separated using gas chromatography (Agilent 7890 Gas Chromatograph with FID detector and ChemStation software; Supelco fused silica 100m capillary column SP-2560; initial 160°C for 16 min, ramp 3.0°C/min to 240°C, hold for 15 min). The assay generates data on 46 fatty acids and the fatty acid composition is expressed as weight percentage of the total.
Results
Expression of lipogenic proteins and fatty acid-modifying enzymes in Pten null NASH liver and HCC
Extensive mass spectrometry analysis following a multi-dimensional protein separation strategy composed of two-dimensional HPLC followed by SDS-PAGE was applied as described (4) to livers collected from the Pten null model at the steatosis stage as well as on small HCCs. For each sample group, livers from 3–4 mice were pooled. A total of 10,707 protein isoforms, products of 8,278 individual genes were identified with a FDR of 1%. For each identified protein, protein abundance was calculated using the frequency of tandem mass spectra assigned to that protein. We previously reported that this label-free approach provides a good estimate of protein abundance in liver (9, 4).
The key enzymes of de novo fatty-acid synthesis, fatty-acid synthase (Fasn), ATP-citrate lyase (Acly) and acetyl-CoA carboxylases 1 and 2 (Acc1 and Acc2), were identified at high abundance in the Pten null livers. Significant increases in abundance were observed for all 4 proteins in Pten null NASH livers compared to control livers and their expression increased further in tumors (Fig. 1A).
Figure 1.

Lipogenic proteins identified in Pten null liver and their expression in control liver, in Pten null NASH liver and in Pten null tumor. In A, protein abundance corresponding to the total number of tandem mass spectra assigned to Fasn, Acly, Acc1 and Acc2 ; In B, Acsl1 and Acsl2 with protein abundance by mass spectrometry in left panel and transcript expression by quantitative PCR in right panel; In C, Scd1, Scd2, Fads1 and Fads2 with protein abundance by mass spectrometry in left panel, transcript expression in middle panel and protein abundance by western-blot in right panel. Sp-Scd2 represents a peptide unique to scd2. In D, Elovl1 and Elovl6 transcript levels. * significant change compared to control; ** significant change between NASH and control.
Four of the 5 acyl-CoA synthetases (ACSL), enzymes that act downstream of Fasn and convert long-chain fatty acids to acyl-CoA, were identified in the Pten null livers. Acsl1 was identified as the most abundant member of the ACSL family, in the liver of Pten null and control mice. Acsl1 expression decreased in Pten null NASH livers and further decreased in tumors. In contrast, Acls5, the second most abundant ACSL enzyme, was upregulated in the NASH livers and further increased in tumors (Fig. 1B, left panel). Acls3 and Acsl4 were detected only at very low levels in the Pten null livers. Acsl1 and Acsl5 opposite regulation was further validated by quantitative PCR (Fig. 1B, right panel). Acsl1 mRNA was slightly down-regulated in NASH Pten null livers compared to controls but strongly down-regulated in Pten null tumors (−10.7-fold; p=0.006). The expression of Acsl1 was also highly significantly decreased in tumors compared to adjacent NASH tissues (p=0.0002). In contrast, Acsl5 mRNA expression was significantly increased in NASH Pten null livers (1.9-fold; p=0.01) and further increased although not significantly in tumors (2.4-fold; p=0.01) compared to controls.
A number of desaturases were also detected in the Pten null liver proteome (Fig. 1C, left panel). Fatty acid desaturase 1 (Fads1) increased in NASH livers and further increased in tumors, while Fads2 was detected only in tumors. Stearoyl-CoA desaturase (Scd) also increased in NASH livers and showed an even stronger increase in tumors. The SCD genes share a high degree of sequence identity and therefore most identified peptides were common to all four mouse Scd proteins, with the exception of the peptide LFLIIANTMAFQNDVYEWAR (sp-Scd2) that was specific to Scd2. Interestingly, this peptide was specifically detected in the tumors suggesting a preferential increase of Scd2 in tumors. These results were further validated by quantitative PCR (Fig. 1C, middle panel). Scd1 mRNA was strongly up-regulated in NASH Pten null livers (13.9-fold; p=0.002) and further increased in tumors (16-fold; p=0.0005) compared to controls. Scd2 mRNA expression also increased in NASH Pten null livers (6.3-fold; p=0.04) but most remarkably increased in tumors (59.4-fold; p=0.03). The expression of scd2 was significantly higher in tumors compared to the adjacent NASH tissue (p=0.04). Fads1 and fads2 mRNAs were increased by 2.8-fold (p=0.0006) and by 2.6-fold (p=0.003), respectively, in NASH Pten null livers. Their expression further increased in tumors (3.2-fold; p=0.001 and 2.8-fold; p=0.001, respectively). Because fads1 and scd1 mRNAs were not significantly increased in tumors compared to adjacent NASH tissue, we further measured the two proteins by western-blot (Fig. 1C, right panel). Both Fads1 and Scd1 protein expression were significantly increased in Pten null tumors compared to NASH adjacent liver (2.0-fold; p=0.04 and 12.4–fold; p=0.01, respectively), confirming the mass spectrometry results and suggesting a tumor-specific posttranscriptional regulation of these two genes.
Fatty acid elongases function with fatty acid desaturases to generate many of the long chain mono and polyunsaturated fatty acids. Elongases were not detected in the liver proteome. We therefore measured the elongases known to be expressed in liver: Elovl1,2,5,6. While elovl2 and elovl5 expression didn’t change in Pten null liver (data not shown), both elovl1 and elovl6 increased in NASH Pten null livers (2.3-fold; p=0.002 and 3.2-fold; p=0.005, respectively) and further increased in tumors (3.0-fold; p=0.0003 and 9.1-fold; p=0.02). The expression of elovl6 was also significantly higher in tumors compared to adjacent NASH tissue (p=0.05) (Fig. 1D).
Together, these results are in agreement with an overall increase in lipid synthesis in the liver of Pten null mice and identified tumor-specific changes in lipogenic proteins. In addition, changes in fatty acid desaturases and elongases indicate potential changes in fatty acids profiles in Pten null NASH liver and tumors. Information on protein annotation, peptide numbers and sequences, is summarized in Table S3, for all proteins identified in Pten null liver proteome and described above.
Fatty Acids Profiling in Pten null Tumors and NASH Liver
The same 18 mice (9 Pten null mice that developed tumors and 9 littermate control mice) used for the lipogenic gene expression validation described above, were selected for fatty acid profiling study. Fatty acids were extracted from the liver of the control mice as well as from tumors and adjacent NASH liver tissue from the Pten null mice. Phospholipids, cholesterol esters and free fatty acids were separated by one-dimensional thin-layer chromatography and 46 individual fatty acids in each fraction were separated by gas chromatography. Fatty acid composition in control liver, Pten null tumors and adjacent NASH liver is shown as relative weight percentages of the 46 fatty acids identified in phospholipids (Fig. 2), free fatty acids (Supplementary Fig. S1) and cholesterol esters (Supplementary Fig. S2). A total of nineteen fatty acids significantly changed in abundance in Pten NASH liver compared to control liver and few among them further changed in tumors. For most fatty acids, the direction of change was consistent among the 3 types of lipids.
Figure 2.
Fatty acid changes (relative composition in %) in Pten null liver. The fatty acid composition of the phospholipid fraction extracted from control liver (grey bars), Pten null NASH adjacent liver (hatched bars) and Pten null tumor (black bars), was analyzed by gas chromatography. All fatty acids that showed significant changes in Pten null liver (P<0.05) are represented in the figure as means + SE. * significant change compared to control; ** significant change between NASH and control.
Saturated fatty acids (SFAs)
The overall trend among the SFAs was a decrease in NASH Pten null liver compared to controls with significant reductions in pentadecanoic (15:0), palmitic (16:0), margaric (17:0), behenic (22:0) and lignoceric (24:0) acids. While long-chain saturated fatty acids 22:0 and 24:0 were below detection in the cholesterol esters and free fatty acids, significant reduction of 15:0, 16:0 and 17:0 was observed in all three fractions. Further significant decrease in tumors was also observed for 15:0, 16:0 and 17:0 in all three fractions.
cis Monounsaturated fatty acids (MUFAs)
In contrast to SFAs, the overall trend among the MUFAs was an increase in NASH Pten null livers with significant inductions in 7-hexadecenoic (16:1n9), vaccenic (18:1n7), oleic (18:1n9), gondoic (20:1n9), erucic (22:1n9) and nervonic (24:1n9) acids. Significant increases in these six fatty acids were observed in all three fractions with the exception of 20:1n9, 22:1n9 and 24:1n9 that were below detection in the cholesterol esters. The greatest difference was observed in the 18:1 MUFAs with both the n7 and n9 fatty acids dramatically increased. Further significant increase in tumors was observed for 22:1n9 in phospholipids and for 24:1n9 in phospholipids and free fatty acids.
n6-Polyunsaturated fatty acids (n6-PUFAs)
While linoleic (18:2n6) and γ-linolenic (18:3n6) acids significantly decreased in all three lipid fractions in NASH liver, long-chain n6 fatty acids, dihomo-γ-linolenic (20:3n6), adrenic (22:4n6) and osbond (22:5n6) acids, significantly increased in phospholipids and free fatty acids. 18:2n6 further decreased in tumors in phospholipids and 22:5n6 further increased in tumors in free fatty acids.
n3-Polyunsaturated fatty acids (n3-PUFAs)
α-linolenic acid (18:3n3, ALA), eicosapentaenoic (20:5n3, EPA) and cervonic (22:6n3, DHA) acids significantly decreased in NASH liver in all three lipid fractions with the exception of 22:6n3 that showed individual variability in free fatty acids. 18:3n3 and 20:5n3 further decreased in tumors in free fatty acids and 22:6n3 further decreased in tumors in phospholipids.
Circulating Fatty Acids in Pten null Mice
We then investigated whether the same fatty acid changes could be detected in plasma. Fatty acids were extracted from the plasma of the same 18 mice (9 Pten null mice that developed tumors and 9 littermate control mice). Phospholipids, cholesterol esters and free fatty acids were processed as for the liver tissue. Fatty acid composition in these plasma samples is shown as relative weight percentages of the 46 fatty acids identified in phospholipids (Fig. 3), free fatty acids (Supplementary Fig. S3) and cholesterol esters (Supplementary Fig. S4). Remarkably, eighteen out of the nineteen fatty acids that showed changes in Pten null liver, presented with identical changes in the plasma of these mice. For most fatty acids, the direction of change was consistent among the three types of lipid fractions.
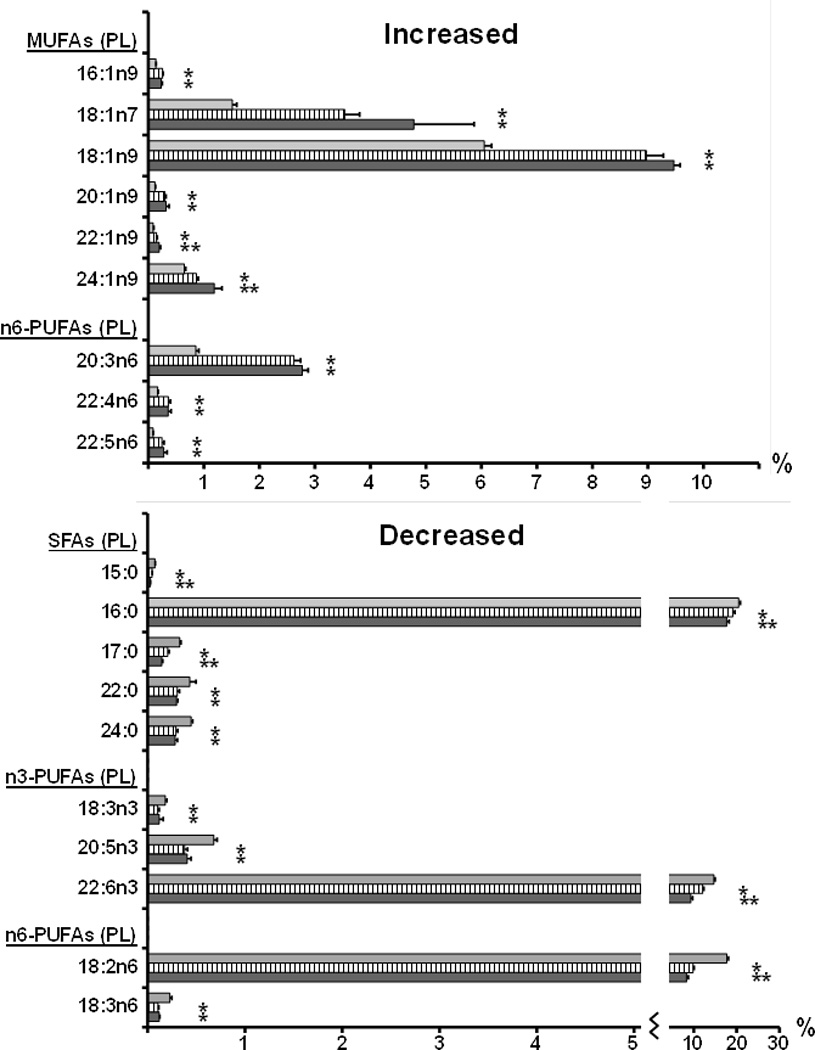
Figure 3.

Changes in circulating fatty acids (relative composition in %) in Pten null mice. The fatty acid composition of the phospholipid fraction extracted from control plasma (grey bars) and plasma from Pten null mice with tumors (black bars), was analyzed by gas chromatography. The same fatty acids presented in figure 2 are shown. * significant change between the two groups.
Saturated fatty acids (SFAs)
A significant decrease in pentadecanoic (15:0), palmitic (16:0), margaric (17:0), behenic (22:0) and lignoceric (24:0) acids was observed in phospholipids from Pten null plasma compared to control plasma. A significant decrease in 15:0 was also observed in free fatty acids and cholesterol esters and a significant decrease in 16:0 and 17:0 was also observed in cholesterol esters. As observed in liver tissue, long-chain saturated fatty acids 22:0 and 24:0 were below detection in the cholesterol ester and free fatty acid fractions.
cis Monounsaturated fatty acids (MUFAs)
7-hexadecenoic (16:1n9), vaccenic (18:1n7) and oleic (18:1n9) acids significantly increased in Pten null compared to control plasma, in all three fractions. Gondoic (20:1n9) and erucic (22:1n9) acids also increased in Pten null plasma in both phospholipids and free fatty acids, while below detection limit in cholesterol esters. Finally, nervonic acid (24:1n9) significantly increased in Pten null plasma in free fatty acids. As observed in liver tissue, the greatest difference was observed in the 18:1 MUFAs with both the n7 and n9 fatty acids dramatically increased.
n6-Polyunsaturated fatty acids (n6-PUFAs)
While linoleic (18:2n6) and γ-linolenic (18:3n6) acids significantly decreased in all three fractions in Pten null plasma, long-chain n6 fatty acids, dihomo-γ-linolenic (20:3n6) and osbond (22:5n6) acids significantly increased in all three fractions and adrenic acid (22:4n6) increased in free fatty acids.
n3-Polyunsaturated fatty acids (n3-PUFAs)
Plasma levels of α-linolenic acid (18:3n3, ALA) and eicosapentaenoic (20:5n3, EPA) acids significantly decreased in all three fractions in Pten null mice.
Correlation of Fatty Acid Changes with Tumor Size and Tumor Burden
All 9 Pten null mice selected in this study had developed tumors. The size of these tumors ranged from 0.1cm to 2.2cm (mean=0.84cm) and the number of nodules per mouse ranged from 1 to 3 (mean=2.3). To evaluate a potential role of the fatty acid changes we identified in liver tumor development and growth, we calculated for each of the 19 fatty acids described above, the correlation between their level in tumor and tumor size. We also calculated the correlation between their level in adjacent tissue and tumor burden estimated as the additive size of all tumors detected in the mouse. We finally calculated the correlation between their level in plasma and tumor burden. We selected the phospholipid fraction for this analysis as all 19 fatty acids in that fraction, were within the detection limit in both liver and plasma. The results are summarized in Table 1.
Table 1.
List of fatty acids with positive (R>0.50) or negative (R<−0.50) correlations between their levels in tumor, in adjacent liver or in plasma and tumor size or tumor burden.
| Tumor | Adjacent Liver | Plasma | |
|---|---|---|---|
| INCREASED | |||
| 18:1n7 | 0.95 | 0.64 | 0.72 |
| 22:1n9 | 0.97 | 0.92 | - |
| 18:1n9 | - | 0.77 | 0.89 |
| 22:4n6 | 0.74 | 0.87 | 0.73 |
| 22:5n6 | 0.68 | 0.84 | 0.82 |
| DECREASED | |||
| 17:00 | −0.90 | - | −0.50 |
| 18:2n6 | −0.92 | −0.58 | −0.61 |
| 22:6n3 | - | −0.56 | −0.63 |
Note: -indicates correlation values between −0.50 and 0.50 and therefore no correlation.
Among the increased fatty acids, five showed positive correlations (R>0.50) with tumor size or tumor burden. Tumor levels of vaccenic (18:1n7) and erucic (22:1n9) acids strongly correlated with tumor size (R=0.95 and 0.97, respectively) and levels of oleic (18:1n9), adrenic (22:4n6) and osbond (22:5n6) acids in adjacent liver positively correlated with tumor burden (R=0.77, 0.87 and 0.84, respectively). Remarkably, plasma levels of these five fatty acids also positively correlated with tumor burden, with the exception of erucic acid detected at very low levels in plasma (R=0.72, 0.89, 0.73 and 0.82, respectively).
Among the decreased fatty acids, three showed negative correlations (R<−0.50) with tumor size or tumor burden. Tumor levels of margaric (17:0) and linoleic (18:2n6, LA) acids negatively correlated with tumor size (R=−0.90 and −0.92, respectively) and levels of cervonic acid (22:6n3, DHA) in adjacent liver negatively correlated with tumor burden (R=−0.56). Plasma levels of these three fatty acids also negatively correlated with tumor burden (R=−0.50, −0.61 and −0.63, respectively).
Circulating Fatty Acids in HCC Patients
To evaluate the relevance of these results to the human disease and to distinguish changes in circulating fatty acids that are associated with HCC or with NASH, fatty acid profiling analysis was performed blinded to clinical data, on plasma collected from 30 patients including patients with NASH-associated cirrhosis (n=7), NASH-associated HCC (n=7), HBV-associated cirrhosis (n=8) or HBV-associated HCC (n=8).
We first focused on these four fatty acids that showed correlation between tumor levels and tumor size. Plasma levels of vaccenic (18:1n7) and erucic (22:1n9) acids were significantly higher in HCC patients than in cirrhosis patients, independently of the etiology NASH or HBV (1.48-fold; p=0.0003 and 2.04-fold; p=0.0003, respectively) and plasma levels of margaric (17:0) and linoleic (18:2n6, LA) acids were significantly lower in HCC patients than in cirrhosis patients, independently of the etiology NASH or HBV (−1.12-fold; p=0.03 and −1.2-fold; p=0.0003, respectively) (Fig. 4).
Figure 4.

Plasma levels of A, 18:1n7; B, 22:1n9; C, 17:0 and D, 18:2n6 among patients with cirrhosis or with HCC. The box refers to the 25th and 75th percentile values with a line indicating the median levels, whereas the interquartile range extends outside the box. Points outside the interquartile range are outliers.
We then analyzed those four fatty acids that showed correlation between levels in adjacent tissue and tumor burden. Plasma levels of oleic (18:1n9), adrenic (22:4n6) and osbond (22:5n6) acids were significantly higher in NASH patients than in HBV patients, independently of the diagnosis of HCC or cirrhosis (1.36-fold; p<0.0001, 2.34-fold; p<0.0001 and 2.21-fold; p<0.0001, respectively) and plasma levels of cervonic acid (22:6n3) were significantly lower in NASH patients than in HBV patients, independently of the diagnosis of HCC or cirrhosis (−3.45-fold; p<0.0001) (Fig. 5).
Figure 5.

Plasma levels of A, 18:1n9; B, 22:4n6; C, 22:5n6 and D, 22:6n3 among patients with HBV-associated cirrhosis or with NASH-associated cirrhosis. The box refers to the 25th and 75th percentile values with a line indicating the median levels, whereas the interquartile range extends outside the box. Points outside the interquartile range are outliers.
We finally analyzed the remaining 11 fatty acids that showed changes in Pten null liver and plasma but without any correlation with tumor size or tumor burden. Among them, circulating lignoceric (24:00) and eicosapentaenoic (20:5n3, EPA) acids were strongly decreased in NASH patients compared to HBV patients, independently of the diagnosis of HCC or cirrhosis (−1.61-fold; p=0.0002 and −3.45-fold; p<0.0001, respectively) (Fig. 6).
Figure 6.
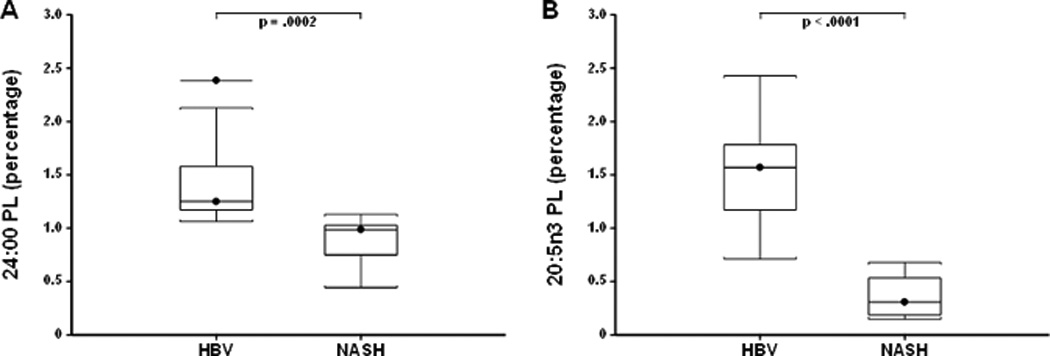
Plasma levels of A, 24:0 and B, 20:5n3 among patients with HBV-associated cirrhosis or with NASH-associated cirrhosis. The box refers to the 25th and 75th percentile values with a line indicating the median levels, whereas the interquartile range extends outside the box. Points outside the interquartile range are outliers.
Altogether, these results demonstrate a strong agreement between changes observed in the Pten null model and changes observed in human plasma.
In summary (Fig. 7), this integrated proteomic and lipidomic study applied to a mouse to human pipeline identified lipid metabolism signatures specific to the stages in the disease progression from NASH to HCC. NASH was associated with reduced hepatic and circulating lignoceric (24:0) and eicosapentaenoic (20:5n3, EPA) acids. An additional NASH signature consisting of the up-regulation of hepatic elovl6, elevated hepatic and circulating oleic (18:1n9), adrenic (22:4n6) and osbond (22:5n6) acids and reduced hepatic and circulating cervonic (22:6n3, DHA), correlated with tumor burden. Finally the HCC signature was characterized by the up-regulation of hepatic scd1/scd2, fads2 and acsl5 vs. acsl1 ratio, elevated hepatic and circulating vaccenic (18:1n7) and erucic (22:1n9) acids and reduced hepatic and circulating margaric (17:00) and linoleic (18:2n6, LA) acids. Altogether this study identified candidate targets for HCC risk assessment, chemoprevention, diagnosis and treatment.
Figure 7.

Schema summarizing the fatty acids and lipid-associated enzymes identified as changed in NASH and in HCC. All fatty acids and lipid-associated enzymes identified as up-regulated are shown in red and those identified as down-regulated in green. Their position in the graph indicates whether they represent signatures of NASH, of HCC risk or of HCC development.
DISCUSSION
Re-programming of lipogenic pathways is one of the most significant physiological alterations in tumor cells (10). Lipogenic enzymes and fatty acids have been recently recognized as promising cancer therapeutic targets (11). Because metabolic genes are up-regulated at an early stage of cancer, they are also considered to be candidate targets for chemo-prevention. Some of the metabolic genes and their products are also likely to serve as diagnostic tools. In HCC, a recent study has linked increased lipogenesis induced by AKT-mTORC1 to HCC development in human (12). PTEN has also been proposed to be at the crossroad of metabolism and HCC. PTEN levels are decreased in human and rat livers with steatosis and the expression of PTEN is decreased or absent in over 50% of human HCC. In mice, Pten deletion or down-regulation by unsaturated fatty-acids induce hepatic steatosis (13, 14). In addition, Pten null mice develop HCC later in life. Therefore, Pten null mice represent a unique model to identify the mechanisms by which metabolic deregulation is linked to HCC initiation and progression.
We previously reported extracellular matrix proteome changes in NASH liver and in tumors in this model (4). Here, we are reporting NASH- and tumor-associated modulations of lipogenic proteins and fatty-acid modifying enzymes in this same model. Four genes in the lipogenic pathway are considered to play key roles in tumorigenesis and cancer progression, namely FASN, ACLY, ACC1 and ACC2 (10). FASN is significantly up-regulated in a variety of cancers at an early stage and its expression is positively correlated with poor survival of patients. In our proteome profiles, we observed an upregulation of Fasn, Acly and of the two isozymes of Acc in the Pten null NASH liver. In addition, we observed a higher increase in the expression of these enzymes in Pten null tumors.
In mammals, five Acsl isoforms (Acsl 1, 3, 4, 5 and 6) have been identified. All five members catalyze saturated and unsaturated fatty acids of chain lengths 8–22 carbons. We observed an increase in Acsl5 and concomitant decrease of Acsl1 in Pten null tumors. While Acsl5 has been reported frequently overexpressed in malignant gliomas and involved in their growth and survival, this is the first report of increased Acsl5 in HCC. Additional studies are required to clarify the role of Acsl5 in the pathogenesis of HCC.
Fatty acid elongases function with fatty acid desaturases to generate many of the long chain mono and polyunsaturated fatty acids assimilated into cellular lipids. We detected increased protein expression of the desaturases Fads1, Fads2, Scd1 and Scd2 in Pten null tumors. We showed that while both fads1 and scd1 transcripts and proteins increased in Pten null NASH liver compared to control, only fads1 and scd1 proteins further increased in the tumors, suggesting a tumor-specific post-transcriptional regulation of these two genes. The elongases were only detected at very low levels. However, Elovl1 and Elovl6 transcripts were found upregulated in Pten null tumors. Remarkably, the integrated proteome and lipidome profiles indicated that the changes observed in fatty acid profiles in the Pten null NASH liver and tumors were in good agreement with the changes observed for the desaturases and elongases. For example, the increases in hepatic and circulating vaccenic and oleic acids in HCC can be explained by the upregulation of Scd1/scd2 and Elovl6 observed in tumors. It has indeed been reported that overexpression of scd2 leads to increased vaccenic acid and Elovl6 is a major elongase for oleic acid production (15). Similarly, fads1 and fads2 catalyze the conversion of linoleic acid and α-linolenic acid into long-chain n6 and n3 polyunsaturated fatty acids. The reduction of hepatic and circulating linoleic acid observed in HCC can be explained by the increased expression of fads2 observed in tumors. Additional studies are however needed to integrate lipogenic proteins and fatty acids into functional pathways.
It was previously reported that eicosapentaenoic (EPA) ameliorates steatohepatitis and inhibits the development of liver adenoma and HCC in hepatocyte-specific Pten-deficient mice (16). It was suggested that dietary EPA inhibits inflammation by decreasing the n-6/n-3 polyunsaturated fatty acids ratio. Similarly, consumption of cervonic acid (DHA) appears to protect against the development of HCC, even among subjects with HBV or HCV infection (17). These results are in good agreement with the observed decreased of EPA and DHA in NASH and the negative correlation of DHA with tumor burden in our model. Furthermore, n6-C22 over n3-C22 ratio positively correlated with tumor burden. The utility of these markers in HCC risk assessment and in HCC prevention should be further evaluated.
While this study is the first report on the composition of lipids in both the liver and plasma and in both NASH and HCC, lipidomic studies in these diseases have been reported. Overall, there is a good agreement between our study and the two studies of Puri et al. (18, 19) reporting NASH-associated increases in MUFAs:SFA ratio, increases of vaccenic acid and oleic acid and decreases of behenic, lignoceric, linoleic, α-linolenic and DHA acids. In contrast, there was only partial agreement with a recent lipidomic study in HCC (20). While in both studies, a decrease in lignoceric acid in HCC plasma was observed, our study didn’t detect any increase in palmitic acid. Overall, our study demonstrated for the first time that circulating lipid metabolome provides direct information about changes in the liver. We have identified selected fatty acids and fatty acid modifying enzymes that may have protumorigenic functions. Blocking of elovl6, scd1 and fads2 in particular, might provide significant therapeutic benefit to patients predisposed to NASH and HCC. From the viewpoint of cancer prevention, it would also be important to take into account the effects of dietary factors. Further investigations on the regulation of these pathways will offer new strategies for tumor treatment, as well as for effective cancer prevention. The Pten null model is highly valuable for these studies. We have also identified circulating fatty acids that may have utility in HCC risk assessment, in predicting HCC development or in HCC diagnosis. Further validation is now needed in large cohorts of patients.
Supplementary Material
Acknowledgements
We wish to thank Pho Diep for her technical assistance with the fatty acid profiling and Paul Farley for his assistance in the manuscript preparation.
Footnotes
Conflict of interest: We do not have any conflict of interest to report.
References
- 1.El-Serag HB, Rudolph KL. Hepatocellular carcinoma: epidemiology and molecular carcinogenesis. Gastroenterology. 2007;132:2557–2576. doi: 10.1053/j.gastro.2007.04.061. [DOI] [PubMed] [Google Scholar]
- 2.Horie Y, Suzuki A, Kataoka E, Sasaki T, Hamada K, Sasaki J, Mizuno K, Hasegawa G, Kishimoto H, Iizuka M, Naito M, Enomoto K, Watanabe S, Mak TW, Nakano T. Hepatocyte-specific Pten deficiency results in steatohepatitis and hepatocellular carcinomas. J Clin Invest. 2004;113:1774–1783. doi: 10.1172/JCI20513. [DOI] [PMC free article] [PubMed] [Google Scholar]
- 3.Stiles B, Wang Y, Stahl A, Bassilian S, Lee WP, Kim YJ, Sherwin R, Devaskar S, Lesche R, Magnuson MA, Wu H. Liver-specific deletion of negative regulator Pten results in fatty liver and insulin hypersensitivity. Proc Natl Acad Sci U S A. 2004;101:2082–2087. doi: 10.1073/pnas.0308617100. [DOI] [PMC free article] [PubMed] [Google Scholar]
- 4.Lai KKY, Shang S, Lohia N, Booth GC, Masse DJ, Fausto N, Campbell JS, Beretta L. Extracellular matrix dynamics in hepatocarcinogenesis: a comparative proteomics study of PDGFC Transgenic and Pten Null Mouse Models. PLoS Genet. 2011;7:e1002147. doi: 10.1371/journal.pgen.1002147. [DOI] [PMC free article] [PubMed] [Google Scholar]
- 5.Bruix J, Sherman M. Management of hepatocellular carcinoma. Hepatology. 2005;42:1208–1236. doi: 10.1002/hep.20933. [DOI] [PubMed] [Google Scholar]
- 6.Folch J, Lees M, Sloane Stanley GH. A simple method for the isolation and purification of total lipides from animal tissues. J Biol Chem. 1957;226:497–509. [PubMed] [Google Scholar]
- 7.Schlierf G, Wood P. Quantitative determination of plasma free fatty acids and triglycerides by thin-layer chromatography. J Lipid Res. 1965;6:317–319. [PubMed] [Google Scholar]
- 8.Lepage G, Roy CC. Direct transesterification of all classes of lipids in a one-step reaction. J Lipid Res. 1986;27:114–120. [PubMed] [Google Scholar]
- 9.Lai KK, Kolippakkam D, Beretta L. Comprehensive and quantitative proteome profiling of the mouse liver and plasma. Hepatology. 2008;47:1043–1051. doi: 10.1002/hep.22123. [DOI] [PubMed] [Google Scholar]
- 10.Furuta E, Okuda H, Kobayashi A, Watabe K. Metabolic genes in cancer: their roles in tumor progression and clinical implications. Biochim Biophys Acta. 2010;1805:141–152. doi: 10.1016/j.bbcan.2010.01.005. [DOI] [PMC free article] [PubMed] [Google Scholar]
- 11.Mashima T, Seimiya H, Tsuruo T. De novo fatty-acid synthesis and related pathways as molecular targets for cancer therapy. Br J Cancer. 2009;100:1369–1372. doi: 10.1038/sj.bjc.6605007. [DOI] [PMC free article] [PubMed] [Google Scholar]
- 12.Calvisi DF, Wang C, Ho C, Ladu S, Lee SA, Mattu S, Destefanis G, Delogu S, Zimmermann A, Ericsson J, Brozzetti S, Staniscia T, Chen X, Dombrowski F, Evert M. Increased lipogenesis, induced by AKT-mTORC1-RPS6 signaling, promotes development of human hepatocellular carcinoma. Gastroenterology. 2011;140:1071–1083. doi: 10.1053/j.gastro.2010.12.006. [DOI] [PMC free article] [PubMed] [Google Scholar]
- 13.Watanabe S, Horie Y, Suzuki A. Hepatocyte-specific Pten-deficient mice as a novel model for nonalcoholic steatohepatitis and hepatocellular carcinoma. Hepatol Res. 2005;33:161–166. doi: 10.1016/j.hepres.2005.09.026. [DOI] [PubMed] [Google Scholar]
- 14.Vinciguerra M, Veyrat-Durebex C, Moukil MA, Rubbia-Brandt L, Rohner-Jeanrenaud F, Foti M. PTEN down-regulation by unsaturated fatty acids triggers hepatic steatosis via an NF-kappaBp65/mTOR-dependent mechanism. Gastroenterology. 2008;134:268–280. doi: 10.1053/j.gastro.2007.10.010. [DOI] [PubMed] [Google Scholar]
- 15.Green CD, Ozguden-Akkoc CG, Wang Y, Jump DB, Olson LK. Role of fatty acid elongases in determination of de novo synthesized monounsaturated fatty acid species. J Lipid Res. 2010;51:1871–1877. doi: 10.1194/jlr.M004747. [DOI] [PMC free article] [PubMed] [Google Scholar]
- 16.Ishii D, Ying TH, Mahara A, Murakami S, Yamaoka T, Lee WK, Iwata T. In vivo tissue response and degradation behavior of PLLA and stereocomplexed PLA nanofibers. Biomacromolecules. 2009;10:237–242. doi: 10.1021/bm8009363. [DOI] [PubMed] [Google Scholar]
- 17.Sawada N, Inoue M, Iwasaki M, Sasazuki S, Shimazu T, Yamaji T, Takachi R, Tanaka Y, Mizokami M, Tsugane S. Consumption of n-3 fatty acids and fish reduces risk of hepatocellular carcinoma. Gastroenterology. 2012;142:1468–1475. doi: 10.1053/j.gastro.2012.02.018. [DOI] [PubMed] [Google Scholar]
- 18.Puri P, Baillie RA, Wiest MM, Mirshahi F, Choudhury J, Cheung O, Sargeant C, Contos MJ, Sanyal AJ. A lipidomic analysis of nonalcoholic fatty liver disease. Hepatology. 2007;46:1081–1090. doi: 10.1002/hep.21763. [DOI] [PubMed] [Google Scholar]
- 19.Puri P, Wiest MM, Cheung O, Mirshahi F, Sargeant C, Min HK, Contos MJ, Sterling RK, Fuchs M, Zhou H, Watkins SM, Sanyal AJ. The plasma lipidomic signature of nonalcoholic steatohepatitis. Hepatology. 2009;50:1827–1838. doi: 10.1002/hep.23229. [DOI] [PMC free article] [PubMed] [Google Scholar]
- 20.Patterson AD, Maurhofer O, Beyoglu D, Lanz C, Krausz KW, Pabst T, Gonzalez FJ, Dufour JF, Idle JR. Aberrant lipid metabolism in hepatocellular carcinoma revealed by plasma metabolomics and lipid profiling. Cancer Res. 2011;71:6590–6600. doi: 10.1158/0008-5472.CAN-11-0885. [DOI] [PMC free article] [PubMed] [Google Scholar]
Associated Data
This section collects any data citations, data availability statements, or supplementary materials included in this article.