

Abstract
Although the interaction between cells and poly(ethylene glycol) (PEG) hydrogels is well documented, there lacks a thorough investigation into the adsorption of blood proteins on these surfaces which dictates the observed cellular and in vivo host response. Thus, a clear understanding of how surface-bound proteins mediate the unique biological property of PEG hydrogels is fundamentally important. The information obtained will also provide insights into future biomaterial design. In this study, several mass-spectrometry-based proteomic tools coupled with complementary immunoassays were employed to survey the complex surface-bound serum proteome. The adsorption of vitronectin, thrombin, fibrinogen and complement component C3 was significantly lower on PEG hydrogels than on tissue culture polystyrene (TCPS). Although PEG hydrogels mediated lower C3 adsorption than TCPS, the extent of C3 activation between the two surfaces was comparable. Adherent monocyte density was also significantly lower on PEG hydrogels as compared to TCPS. Taken together, these results support the critical role of the complement C3 in mediating monocyte adhesion on biomaterials. Thus we conclude that the biocompatibility of PEG hydrogels both in vitro and in vivo can be partly contributed to their limited C3 interaction and monocyte activity.
Keywords: Poly(ethylene glycol) hydrogel, mass spectrometry, vitronectin, thrombin, fibrinogen, complement C3
1. Introduction
It is well appreciated that serum proteins adsorbed on blood-contacting biomaterials play a key role in mediating cell adhesion, activation and thrombosis, thus determining the outcome of host response to materials. The adsorption of serum proteins (e.g., albumin, complement components, vitronectin and fibrinogen) on various biomaterials has been extensively studied [1–5] and the driving force is governed by many factors such as material composition, hydrophobicity, electrostatics, protein structure and the competitive adsorption amongst proteins [1, 6]. The complexity of the adsorbed serum proteome on biomaterials requires a quick and reliable approach to identify these proteins. Compared to traditional analytical methods such as gel electrophoresis, ellipsometry and Fourier transform infrared spectroscopy (FT-IR), matrix-assisted laser desorption/ionization (MALDI) provides a powerful tool in identifying various adsorbed proteins without the a priori knowledge of the protein identity that is necessary in immunoassays. Surface-MALDI [7, 8] and surface-enhanced laser desorption/ionization time-of-flight mass spectrometry (SELDI-TOF-MS) [9] have been applied in studies of protein adsorption on ocular lens and desorbed fluid from dialysis membrane, respectively. However, the possible contamination from laser-deteriorated substrates or the knowledge of to-be-detected proteins may restrict their application; thus, a modified method is yet to be developed.
Poly(ethylene glycol) (PEG) is widely accepted for its ‘non-fouling’ and low protein adsorption properties. PEG has been employed in surface coating and structurally modifying materials to enhance the biocompatibility [10–12]. However, detailed analyses of adsorbed and absorbed serum proteins on PEG hydrogels are absent in the literature. Understanding the adsorbed serum proteome on PEG hydrogels will provide significant insights into the blood–material interaction, which is crucial in the development of biocompatible materials. In this study, the proteome of human serum proteins adsorbed onto PEG hydrogels and tissue-culture polystyrene (TCPS) was studied by MALDI-TOF/TOF. Different methods were employed to elute adsorbed proteins from the substrate and the MALDI results were compared. The adsorption of vitronectin, thrombin, fibrinogen and complement component C3 was further quantified by enzyme-linked immunosorbent assay (ELISA) as a complementary method since these proteins have been shown repeatedly in mediating blood–material thrombosis and cell adhesion to biomaterials [13, 14]. The effect of C3 adsorption and activation on human primary monocyte adhesion was further assessed.
2. Materials and Methods
2.1. PEG-Diacrylate Synthesis and PEG Hydrogel Preparation
PEG-acrylate was prepared by dissolving solid PEG-diol (3400 Da, Sigma) in dried tetrohydrofuran to obtain a 20% (w/v) solution. Acryloyl chloride (ACl, Sigma) and triethylamine (TEA, Sigma) were added into the PEG solution at a 1:4:6 ratio of PEG:ACl:TEA. The solution was stirred for 3 h followed by filtration twice with a filter paper (Grade 2, Whatman). The filtrate was then precipitated in cold hexane, stirred and filtered to obtain PEG-diacrylate. PEG-diacrylate was dried in a vacuum oven overnight. The purity of product was determined to be >97% as assessed with high performance liquid chromatography. The PEG hydrogels were prepared by dissolving 10 wt% PEG-diacrylate (575 (Sigma) or 3400 Da) and the photoinitiator (0.1 wt% 2,2-dimethoxy-2-phenyl-acetophenone (DMPA, Aldrich) or 0.4 wt% Irgacure 2959 (Ciba), respectively) in H2O in 12- or 48-well plates. The solution was cured with UV (CF 1000, Clearstone Technologies; or UVP B 100 AP, respectively). PEG hydrogels were washed five times with phosphate-buffered saline (PBS, pH 7.4) to remove unreacted PEG-diacrylate, Irgacure 2959 and DMPA before equilibration in PBS at 37°C for 24 h. PEG hydrogels were washed twice with PBS again before incubation with serum-containing medium for protein adsorption analysis.
2.2. Fractionation of Human Serum with PEG 4000
To determine the adsorption of human serum proteins on PEG hydrogels, human blood was collected from healthy donors and submerged in a water bath at 37°C for 3 h to allow for complete coagulation. The tubes were then centrifuged at 2850 × g (Marathon 3200R, Fisher Scientific) for 10 min at room temperature to obtain serum. Albumin is the major component of human serum and its extremely high abundance significantly lowers the efficacy of detecting other serum proteins by mass spectrometry. Thus, it is critical to remove albumin before utilizing the serum to elucidate the adsorption of low abundance proteins. The fractionation of human serum with PEG (4000 Da, Fluka) was reported previously [15, 16]. Briefly, human serum was fractioned in ice bath by slowly adding in 10% (w/v) PEG 4000 and stirring at 4°C for 60 min, followed by centrifugation at 800 × g for 30 min. The proteins precipitated were air-dried (fraction I). Then, more 10% (w/v) PEG 4000 was added to supernatant, stirred and centrifuged to obtain the 10–20% PEG fraction (fraction II). The supernatant, which contained most of the albumin molecules, was removed as fraction III. Fractions I and II were combined for adsorption study. The distribution of selected proteins in each fraction has been reported previously (Table 1) [16]. In this study, the distribution of albumin, fibrinogen, thrombin, complement component C3 and vitronectin in each fraction was further confirmed with ELISA and the results were compared to those reported previously [16] (Table 2). The removal of albumin had no effect on the relative concentration of total proteins adsorbed on both PEG hydrogels (3400 Da) and TCPS, as determined by Fourier transform infrared (FT-IR) spectroscopy (Bruker Equinox 55/S) and bicinchoninic acid (BCA, Pierce) test, respectively. BCA result showed the ratio of proteins adsorbed on TCPS with 10% fractionated serum to that with 10% whole serum was 1.02:1. In the FT-IR study of the relative protein adsorption on PEG hydrogels, the integrated peak area of carbonyl group in amide was normalized to the peak area of carbon–oxygen bond (C–O) of the same sample, and the ratios were 0.65 and 0.61 for fractionated and whole serum, respectively. These indicate no significant difference in adsorbed total protein levels between sera with or without albumin removal on both PEG hydrogels and TCPS.
Table 1. Distribution of plasma proteins in PEG fractions [16].
| Plasma protein | Protein distribution (%) | ||
|---|---|---|---|
|
| |||
| Fraction I (0–10% PEG) | Fraction II (10–20% PEG) | Fraction III (20% PEG) | |
| Albumin | 6 | 4 | 86 |
| Antithrombin III | – | 23 | 77 |
| α1-Acid glycoprotein | – | – | 100 |
| α1-Antitrypsin | 4 | 5 | 88 |
| α2-Macroglobulin | 35 | 65 | – |
| C3 component | 93 | 7 | – |
| Ceruloplasmin | 14 | 23 | 73 |
| C1 inactivator | – | – | 1000 |
| Fibrinogen | 88 | – | – |
| Haptoglobulin | 2 | 40 | 56 |
| IgG | 88 | 15 | 1 |
| Plasminogen | 69 | 19 | – |
| Prothrombin | 25 | 50 | 25 |
| Transferrin | 6 | 22 | 58 |
| α-Lipoprotein | 15 | 25 | 50 |
| β-Lipoprotein | 100 | – | – |
Table 2. Distribution of human serum proteins in PEG fractions as determined by ELISA.
| Serum protein | Protein distribution (%) | ||
|---|---|---|---|
|
| |||
| Fraction I (0–10% PEG) | Fraction II (10–20% PEG) | Fraction III (20% PEG) | |
| Albumin | 13.4 ± 3.7 | 16.5 ± 4.6 | 70.1 ± 4.2 |
| Thrombin | 43.1 ± 6.1 | 51.2 ± 10.4 | 5.8 ± 5.0 |
| Fibrinogen | 98.3 ± 9.0 | 1.3 ± 0.3 | 0.4 ± 0.3 |
| Complement C3 | 99.7 ± 1.5 | 0.3 ± 0.0 | 0.1 ± 0.0 |
| Vitronectin | 31.1 ± 0.7 | 38.0 ± 0.7 | 30.9 ± 0.5 |
2.3. Serum Protein Adsorption and Mass Spectrometry
Chemicals were purchased from Sigma-Aldrich, unless otherwise stated. Whole serum and fractionated human serum were diluted to 10% (v/v) in Dulbecco's modified eagle medium (DMEM, Gibco) and incubated in 12-well TCPS plates coated with or without PEG hydrogels (3400 Da) at 37°C for 2, 24 or 48 h. At each time point, DMEM solution was removed and the samples were washed twice with PBS. PEG hydrogels were then placed into new wells before additional washing to avoid interference from proteins adsorbed onto TCPS. Samples were then subjected to different sample preparation methods for mass spectrometry. Serum proteins adsorbed/absorbed to PEG hydrogels and TCPS were eluted with sodium dodecyl sulfate (SDS, Amresco®) or 30% (w/v) acetic acid and directly dried with a SpeedVac concentrator (Savant SVC 100H, Phoenix Equipment). SDS in protein solution was removed by chloroform/methanol/water extraction (1:4:3, v/v) as described previously [17]. Briefly, 200 μl protein sample was mixed with 800 μl methanol, followed by the addition of 200 μl chloroform and 600 μl water. The solution was vortexed and centrifuged at 14000 × g for 5 min to precipitate proteins which were then washed by adding 600 μl methanol and the pellet was obtained by centrifugation at 14000 × g for 10 min. The pellet was briefly dried at 37°C to evaporate excessive solvents. All protein samples treated with SDS and acetic acid were denatured with 6 M urea, 4 mM d,l-dithiothreitol (DTT) and 50 mM Trizma® hydrochloride. Denatured proteins were diluted by 50 mM ammonium bicarbonate and digested by trypsin (Promega) at 37°C overnight. Protein digestion was stopped by adding 10% (w/v) trifluoroacetic acid (TFA) until pH dropped to 3. Peptides were dried by SpeedVac and reconstituted with 0.1% (v/v) TFA before desalting with C18 Ziptips (Millipore). Desalted peptides were eluted onto a Opti-TOF™ 384-well plate (Applied Biosystems) with 0.5 ml acetonitrile/0.1% TFA (50:50, v/v), followed by pipetting 0.5 μl α-cyano-4-hydroxycinnamic acid dissolved in acetonitrile/0.1% TFA (50:50, v/v).
Digested peptides were analyzed by MALDI-TOF/TOF (4800 Proteomics Analyzer, Applied Biosystems) in positive ion mode and the sequence data were obtained from the MS/MS result of the top 15 intensity y ions for each spot. Peptide sequences were then subjected to Mascot (Matrix Science, MA) via GPS Explorer™ software (Applied Biosystems) against National Centers for Biotechnology Information (NCBInr) database [18]. Following search parameters were used: taxonomy was restricted to Homo sapiens; enzyme was trypsin with 2 missed cleavage sites; variable modifications were deamidated (NQ) and oxidation (M); peptide tolerance was ±1.0 Da; MS/MS tolerance was ±0.1 Da and peptide charge was 1 + monoisotopic. The Mascotion score equals −10 × log10(P) where P is the probability the observed event is random. Therefore, a high Mascot score correlates to a low probability of a random event. Like most MS-based proteomic searches, a Mascot ion score above 66 was considered the threshold for significant database match in this study.
2.4. Enzyme-Linked Immunosorbent Assay (ELISA) to Quantify Adsorbed Proteins
The concentrations of vitronectin, fibrinogen and thrombin on PEG hydrogels (3400 Da) were determined with ELISA, since their adsorption was identified via MALDI and these proteins mediate leukocyte adhesion and thrombosis formation. DMEM (0.5 ml) with 10% whole human serum was added to 48-well plates with or without PEG hydrogels and incubated at 37°C for 0.5, 1, 2, 12, 24 and 48 h for the quantification of vitronectin, thrombin and fibrinogen. TCPS incubated with DMEM plus 10% whole human serum served as a positive control. PEG hydrogels and TCPS with serum-free DMEM served as negative controls. As a key player in both classic and alternative complement pathways, complement component C3 adsorbed/absorbed on PEG hydrogels (575 and 3400 Da) and TCPS was quantified with RPMI 1640 supplemented by 10% pooled human sera (PHS, Sigma) or 10% human C3-inactivated serum (Sigma). PEG hydrogels and TCPS with RPMI 1640 in the absence of serum were used as negative controls. At each time point, the media was removed and samples were washed twice with PBS. PEG hydrogels were then transferred to new wells to avoid the interference from proteins adsorbed onto the culture plate. Surfaces of PEG hydrogel and TCPS were then blocked with 5% skim milk in washing solution (PBS containing 0.05% Tween-20) for 2 h, followed by washing 5 times with washing solution. Primary antibodies including rabbit anti-human vitronectin (1:7000, Abcam), HRP-conjugated goat anti-human fibrinogen (1:40000, Abcam), HRP-conjugated sheep anti-human thrombin (1:1000, USBiological) and HRP-conjugated goat anti-human C3 (1:12000, MP Biochemical) were diluted in blocking solution and incubated with substrates for 1.5 h. HRP-conjugated goat anti-rabbit IgG (Millipore) was diluted to 1:20000 in blocking solution and incubated with substrates for 1.5 h to detect vitronectin. The 1-Step™ ultra TMB-ELISA (Pierce) was then added and the absorbance was measured at 450 nm with a microplate reader (Elx 800, BioTek). Standard curves were created for vitronectin (y = −5.8812x2 + 6.6934x + 0.0347, R2 = 0.9948), fibrinogen (y = −0.2501x2 + 1.7243x, R2 = 0.9967), thrombin (y = 0.3466x2 + 0.3653x, R2 = 0.9962) and C3 (y = 5.6352x + 0.0235, R2 = 0.9935) with known concentrations of vitronectin (R&D Systems), fibrinogen (Innovative Research), thrombin (R&D Systems) and C3 (Calbiochem) adsorbed to TCPS, where x is adsorbed/absorbed protein (μg/cm2) and y is the absorbance value. The protein concentration on the surface was then calculated by comparing absorbance value with standard curve.
2.5. C3 Activation and Human Blood-Derived Monocyte Adhesion
PEG hydrogels (575 and 3400 Da) were prepared as described above and cold sterilized with 70% ethanol for 30 min [19]. Hydrogels were then washed extensively and equilibrated with PBS overnight before seeding the cells. Monocyte isolation was performed according to established protocol [19]. Briefly, 60 ml human blood was drawn from healthy donors and diluted by mixing with PBSE (PBS-EDTA) and Ficoll-Paque™ PLUS (GE Healthcare). Monocytes with lymphocytes and platelets were then separated from plasma, granulocytes and erythrocytes. A series of washing and centrifugation steps were performed to purify monocytes from lymphocytes and platelets. Cells were seeded into 48-well TCPS plate (0.5 ml, 105 cells/ml per well) with RPMI 1640 supplemented by 10% pooled sera or 10% C3-inactivated serum and incubated at 37°C. At 2, 24, 96 and 168 h, culture media were collected and cells were washed with RPMI 1640 twice before adding in fresh media. Adherent cells were imaged with a camera attached to inverted microscope (Nikon Eclipse TE 300) and the cell number on each image (sampling area 0.154 mm2/image) was counted. Three images were employed for each substrate at each time point. The C3a concentrations in culture supernatants were analyzed with an ELISA kit (OptEIA™, BD Biosciences). Culture medium without cells was incubated with PEG hydrogels (575 and 3400 Da) and TCPS as controls. The C3a concentration in culture medium was determined and employed as the baseline value. The experiment was repeated three times independently.
2.6. Statistical Analysis
In MALDI results, only proteins with a Mascot score above threshold (>66) are shown (significance threshold P < 0.05). Proteins are listed from high to low scores and the same type of proteins are grouped and shown as number of hits. For albumin and fibrinogen, only the accession numbers of proteins with top scores are given. All ELISA data and cell adhesion data were shown as mean ± SD of samples in three independent experiments and were analyzed by analysis of variance (ANOVA) followed by the Tukey test using SigmaStat® (version 2.03), where values of P < 0.05 were considered statistically significant.
3. Results and Discussion
3.1. Identification of Adsorbed Serum Proteins by MALDI
As the most abundant serum protein, albumin binds and transports a broad range of ligands (e.g., ions, drugs and proteins), maintains the osmotic pressure and serves as an antioxidant [20, 21]. However, the high concentration of albumin often overwhelms the detection of low abundance serum proteins via various analytical methods. To minimize the interference from albumin, whole human serum was separated into three fractions by precipitating proteins with gradient solid PEG 4000. Fractions I and II were combined in this study, since most serum albumin was retained in fraction III (Tables 1 and 2). As indicated by our BCA and FT-IR results, the total amount of proteins adsorbed onto either TCPS or PEG hydrogels was comparable between those treated with whole or fractionated serum. MALDI and database search elucidated different spectra of adsorbed proteins between PEG hydrogels and TCPS (Table 3). Compared to samples treated with whole serum, the number of hits for albumin was lower for TCPS incubated with fractionated serum. Consequently, vitronectin, fibrinogen and thrombin were demonstrated with top scores on TCPS incubated with fractionated serum. In contrast, a low number of hits for these proteins was observed for TCPS treated with whole serum, which was likely due to the presence of albumin. However, a more significant number of hits for albumin was observed with PEG hydrogels in fractionated serum (Table 3). Furthermore, no vitronectin or thrombin was detected on PEG hydrogels in either fractionated or whole serum, suggesting the adsorption of vitronectin and thrombin was inhibited by PEG hydrogels. PEG was observed to decrease the vitronectin adsorption to PEG-terephthalate and poly(butylene terephthalate) co-polymers [22]. The modification to polydimethylsiloxane with allyl-PEG-methoxy also reduced the generation of thrombin and the adsorption of fibrinogen [23]. Thus, the observation of vitronectin and thrombin adsorption to PEG hydrogels complements the current void in the literature. In addition, α2-macroglobulin and α1-acid glycoprotein 1 were detected on PEG hydrogels, but not on TCPS. The lectin pathway has been previously demonstrated in the immune response to PEG [24]. In this study, the presence of serum amyloid P component on PEG hydrogels (Table 3) suggests the interaction between serum and PEG hydrogels may also be mediated by the classic complement pathway [25] in addition to the well-established alternative pathway. The heat shock protein 60, Nck-2 and cytosolic phosphoprotein were only associated to substrates incubated with whole serum suggesting these proteins remained in fraction III.
Table 3. Comparison of adsorbed proteins on PEG hydrogel (3400 Da) and TCPS incubated with fractionated (fraction I + II) and whole human serum.
| Serum | PEG hydrogel | TCPS | ||||
|---|---|---|---|---|---|---|
|
|
|
|||||
| Protein | Accession No. | No. of hits | Protein | Accession No. | No. of hits | |
| Fractionated | Albumin | gi|11493459 | 30 | Vitronectin | gi|36575 | 3 |
| gi|168988718 | gi|36573 | |||||
| gi|31615331 | gi|221042224 | |||||
| gi|122920512 | ||||||
| gi|3212456 | ||||||
| gi|158258947 | ||||||
| gi|119626071 | ||||||
| gi|4502027 | ||||||
| gi|28592 | ||||||
| gi|178345 | ||||||
| Fibrinogen | gi|119625340 | 17 | Fibrinogen precursor | gi|182424 | 2 | |
| gi|2781208 | gi|182430 | |||||
| gi|70906435 | ||||||
| gi|78395029 | ||||||
| gi|119625342 | ||||||
| gi|220702427 | ||||||
| gi|182439 | ||||||
| Fibrin | gi|223002 | 2 | Fibrinogen | gi|4503689 | 26 | |
| gi|159795715 | gi|119625340 | |||||
| gi|78395029 | ||||||
| gi|70906435 | ||||||
| gi|47168756 | ||||||
| gi|119625325 | ||||||
| Immunoglobulin | gi|21669337 | 2 | Fibrin | gi|223057 | 3 | |
| gi|229526 | gi|223002 | |||||
| gi|28373950 | ||||||
| α2-Macroglobulin | gi|224053 | 1 | Thrombin | gi|30802115 | 3 | |
| gi|119588383 | ||||||
| gi|119588384 | ||||||
| Phosphatidyl serine-binding phosphoprotein | gi|107288 | 1 | Albumin | gi|119626064 | 1 | |
| Serum amyloid P component precursor | gi|4502133 | 1 | p51 isoform delNδ | gi|7248452 | 1 | |
| Syntaxin 11 | gi|3248918 | 1 | Syntaxin 11 | gi|3248918 | 1 | |
| Whole | Albumin | gi|31615330 | 43 | Albumin | gi|168988718 | 36 |
| gi|6013427 | gi|31615331 | |||||
| gi|4502027 | gi|28592 | |||||
| gi|122920512 | gi|122920512 | |||||
| gi|3212456 | gi|3212456 | |||||
| gi|168988718 | gi|178345 | |||||
| gi|178345 | gi|4502027 | |||||
| gi|23307793 | gi|62113341 | |||||
| gi|28592 | gi|23307793 | |||||
| Fibrinogen | gi|300313 | 5 | Vitronectin | gi|13477169 | 4 | |
| gi|4503689 | gi|36575 | |||||
| gi|11761629 | gi|36573 | |||||
| gi|182424 | gi|221042224 | |||||
| gi|13591823 | ||||||
| Fibrin | gi|223057 | 1 | Thrombin | gi|118137345 | 4 | |
| gi|11514286 | ||||||
| gi|34810002 | ||||||
| gi|6980506 | ||||||
| Immunoglobulin | gi|21669337 | 2 | Kininogen | gi|4504893 | 3 | |
| gi|229526 | gi|62898910 | |||||
| gi|156231037 | ||||||
| α1-Acid glycoprotein 1 | gi|112877 | 1 | Fibrinogen | gi|300313 | 2 | |
| gi|2781209 | ||||||
| Heat shock protein 60 | gi|77702086 | 1 | Heat shock protein 60 | gi|77702086 | 1 | |
| Nck-2 | gi|3930217 | 1 | Nck-2 | gi|3930217 | 1 | |
| Cytosolic phosphoprotein DP58 | gi|119616263 | 1 | Cytosolic phosphoprotein DP58 | gi|119616263 | 1 | |
| Nestin | gi|119573309 | 1 | Fibrin | gi|223002 | 1 | |
| Brain-specific angiogenesis inhibitor 2 | gi|55958576 | 1 | p51 isoform delNδ | gi|7248452 | 1 | |
| NHS protein | gi|219521678 | 1 | Nestin | gi|119573309 | 1 | |
| Zinc finger protein | gi|1613858 | 1 | Syntaxin 11 | gi|3248918 | 1 | |
PEG hydrogels (3400 Da) were incubated for 2 h with DMEM plus 10% fractionated (fraction I + II) or whole human serum, and proteins were eluted with 0.2% SDS followed by urea/DTT denaturation. TCPS samples were incubated 24 h with DMEM plus 10% fractionated (fraction I + II) or whole human serum, and proteins were directly denatured with urea/DTT.
Compared to direct preparation of MALDI samples on testing material, the elution and purification of adsorbed proteins from solid surface could avoid the possible deterioration of the substrate material and the subsequent interference to ensure the accuracy of mass spectrometry. In this study, SDS and acetic acid were chosen to elute adsorbed proteins since SDS is widely accepted in desorbing proteins from solid substrates [26–28] and acetic acid has been used in eluting proteins from dialysis membranes [9]. The employment of SDS significantly reduced the amount of urea used to directly denature proteins on a substrate and waived the removal procedure of urea by liquid chromatography. Our results showed that acetic acid selectively detached fibrinogen and fibrin from PEG hydrogels at 2 h and no significant hit of other major proteins was obtained (Table 4). In contrast, 0.2% SDS detached a broad range of proteins from PEG hydrogels, including albumin, fibrinogen, immunoglobulin, α2-macroglobulin, etc. SDS is anionic and binds to proteins thus results in protein denaturation by disrupting the protein tertiary structure. Acetic acid tends to break the salt bridges of proteins by reducing pH and destructs protein tertiary structures [29] and, thus, has limited effect on protein unfolding. In this study, only fibrinogen was desorbed by acetic acid, indicating the relatively weak adsorption of fibrinogen on PEG hydrogels compared to other serum proteins (e.g., albumin, immunoglobulin and α2-macroglobulin). The adsorption of fibrinogen on PEG-modified hydrogels was reported to be irreversible compared to albumin and immunoglobulin G when eluted with 0.5% SDS [30]. This current study, however, showed that fibrinogen was eluted by both acetic acid and 0.2% SDS from PEG hydrogels and TCPS, suggesting the reversibility of fibrinogen is likely dependent on the substrate property.
Table 4. Effect of elution method on MALDI results (PEG hydrogel as substrate).
| 0.2% SDS | 30% Acetic acid | No elution | ||||||
|---|---|---|---|---|---|---|---|---|
|
|
|
|
||||||
| Protein | Accession No. | No. of hits | Protein | Accession No. | No. of hits | Protein | Accession No. | No. of hits |
| Albumin | gi|11493459 | 30 | Fibrinogen | gi|2781209 | 27 | Albumin | gi|119626065 | 11 |
| gi|168988718 | gi|119625310 | gi|11493459 | ||||||
| gi|31615331 | gi|223170 | gi|168988718 | ||||||
| gi|122920512 | gi|119625326 | gi|3212456 | ||||||
| gi|3212456 | gi|78395029 | gi|122920512 | ||||||
| gi|158258947 | gi|119625339 | gi|763431 | ||||||
| gi|119626071 | gi|220702427 | |||||||
| gi|4502027 | gi|2781208 | |||||||
| gi|28592 | gi|119625338 | |||||||
| gi|178345 | gi|119625340 | |||||||
| gi|300313 | ||||||||
| Fibrinogen | gi|119625340 | 17 | Fibrinogen precursor | gi|70906437 | 6 | Fibrinogen precursor | gi|182424 | 3 |
| gi|2781208 | gi|70906439 | gi|13591823 | ||||||
| gi|70906435 | gi|70906435 | gi|4503689 | ||||||
| gi|78395029 | gi|182430 | |||||||
| gi|119625342 | gi|4503689 | |||||||
| gi|220702427 | gi|182424 | |||||||
| gi|182439 | ||||||||
| Fibrin | gi|223002 | 2 | Fibrin | gi|223002 | 4 | Fibrin | gi|223057 | 1 |
| gi|159795715 | gi|223057 | |||||||
| gi|159795715 | ||||||||
| gi|28373950 | ||||||||
| Immunoglobulin | gi|21669337 | 2 | Fibrinogen | gi|300313 | 1 | |||
| gi|229526 | ||||||||
| α2-Macroglobulin | gi|224053 | 1 | ||||||
| Phosphatidyl serine-binding phosphoprotein | gi|107288 | 1 | ||||||
| Serum amyloid P component precursor | gi|4502133 | 1 | ||||||
| Syntaxin 11 | gi|3248918 | 1 | ||||||
PEG hydrogels (3400 Da) were incubated for 2 h with DMEM plus 10% fractionated (fraction I + II) and proteins were eluted with 0.2% SDS or 30% acetic acid followed by urea/DTT denaturation. A sample without elution of proteins and directly denatured withurea/DTT served as control.
The increase of SDS concentration from 0.2% to 1% dramatically enhanced the elution of immunoglobulin from TCPS and also resulted in detectable vitronectin precursors. However, there was still no thrombin eluted (Table 5). Vitronectin, thrombin and fibrinogen were detected when these proteins on TCPS were denatured directly by urea/DTT. This indicates the adsorption of these proteins to TCPS may be governed partly by their molecular weight and the Vroman effect [31] since the adsorption of vitronectin and thrombin of relatively low molecular mass (approx. 75 and 37 kDa, respectively) was stronger than fibrinogen (approx. 340 kDa). In contrast, no vitronectin and thrombin adsorbed on PEG hydrogels was detected by MALDI when samples were denatured directly by urea/DTT, indicating the inhibitory effect of PEG hydrogels on these proteins.
Table 5. Effect of elution method on MALDI results (TCPS as substrate).
| 0.2% SDS | 1% SDS | No elution | |||||||
|---|---|---|---|---|---|---|---|---|---|
|
|
|
|
|||||||
| Protein | Accession No. | No. of hits | Protein | Accession No. | No. of hits | Protein | Accession No. | No. of hits | |
| Albumin | gi|168988718 | 22 | Immunoglobulin | gi|184747 | 52 | Albumin | gi|168988718 | 36 | |
| gi|11493459 | gi|229601 | gi|31615331 | |||||||
| gi|119626071 | gi|21757089 | gi|28592 | |||||||
| gi|27692693 | gi|21757086 | gi|122920512 | |||||||
| gi|78101694 gi|62113341 | gi|2765421 gi|29726970 | gi|3212456 gi|178345 | |||||||
| gi|119626074 | gi|20664303 | gi|4502027 | |||||||
| gi|3212456 | gi|49065860 | gi|62113341 | |||||||
| gi|6650826 | gi|23683338 | gi|23307793 | |||||||
| gi|19717684 | |||||||||
| Fibrinogen | gi|223170 | 12 | Albumin | gi|189054552 | 1 | Vitronectin | gi|13477169 | 4 | |
| gi|47168756 | gi|36575 | ||||||||
| gi|2781209 | gi|36573 | ||||||||
| gi|119389654 | gi|221042224 | ||||||||
| gi|119625310 | |||||||||
| Immunoglobulin | gi|1799560 | 7 | Fibrinogen | gi|4503689 | 1 | Thrombin | gi|118137345 | 4 | |
| gi|50301691 | gi|11514286 | ||||||||
| gi|33319302 | gi|34810002 | ||||||||
| gi|17902604 | gi|6980506 | ||||||||
| gi|17902616 | |||||||||
| Trigger transposable element derived 3 |
gi|23312394 | 1 | Fibrin | gi|223002 | 2 | Kininogen | gi|4504893 | 3 | |
| gi|28373950 | gi|62898910 | ||||||||
| gi|156231037 | |||||||||
| Haptoglobulin preproprotein |
gi|186910296 | 1 | Haptoglobulin preprotein | gi|186910296 | 1 | Fibrinogen | gi|300313 | 2 | |
| gi|2781209 | |||||||||
| Zinc finger protein | gi|111306532 | 1 | Serum amyloid P component precursor |
gi|4502133 | 1 | Heat shock protein 60 | gi|77702086 | 1 | |
| Thyroid receptor interactor |
gi|703108 | 1 | Golgi phosphoprotein | gi|11545859 | 1 | Nck-2 | gi|3930217 | 1 | |
| Heat shock protein 60 | gi|77702086 | 1 | Thyroid receptor interactor | gi|703108 | 1 | Cytosolic phosphoprotein DP58 | gi|119616263 | 1 | |
| Nck-2 | gi|3930217 | 1 | Host cell factor 1 | gi|98986457 | 1 | Fibrin | gi|223002 | 1 | |
| Heat shock protein 60 | gi|77702086 | 1 | p51 isoform delNδ | gi|7248452 | 1 | ||||
| Nck-2 | gi|3930217 | 1 | Nestin | gi|119573309 | 1 | ||||
| Vitronectin precursor | gi|88853069 | 1 | Syntaxin 11 | gi|3248918 | 1 | ||||
TCPS samples were incubated 24 h with DMEM plus 10% whole human serum, and proteins were eluted with 0.2% or 1% SDS, followed by urea/DTT denaturation. A sample without elution of proteins and directly denatured withurea/DTT served as control.
3.2. Quantification of Selected Adsorbed Serum Proteins by ELISA
The surface concentrations of adsorbed vitronectin, fibrinogen and thrombin were quantified using ELISA as a complementary method to MALDI because these proteins have been well documented in the host-biomaterial interaction [13]. Furthermore, the absence of complement components in MALDI results was unexpected since complement factors such as C3 have been found to be critical in various blood–material interaction studies [14, 19, 32]. Thus the adsorption of C3 on PEG hydrogels (575 and 3400 Da) and TCPS was also quantified by ELISA. Results showed the amounts of vitronectin, thrombin and fibrinogen on PEG hydrogels (3400 Da) were significantly less than on TCPS from 0.5 to 48 h (Fig. 1). The concentrations of these proteins on TCPS were relatively constant as compared to PEG hydrogels from 0.5 to 48 h. In the presence of other high abundance proteins, the low concentrations of vitronectin and thrombin on PEG hydrogels were likely below the detection threshold of MALDI. This was consistent to the previous mass spectrometry result that vitronectin and thrombin were only observed on TCPS, but not on PEG hydrogels. The adsorption of C3 from pooled human sera to TCPS was generally constant over time and PEG hydrogels significantly reduced the adsorption of C3 from pooled human sera (Fig. 2A). The low adsorption of C3 on PEG hydrogels was likely due to the absence of hydroxyl and amine groups on surface which are known to enhance the binding to carbonyl group in C3 [13]. Generally there was no significant difference in the adsorbed/absorbed C3 concentration amongst PEG hydrogels and TCPS incubated with C3-inactivated serum (Fig. 2B). Similar to vitronectin and fibrinogen on PEG hydrogels, the reason that no C3 was detected on both PEG hydrogels and TCPS by MALDI was probably because of the low amount of C3 adsorbed/absorbed to these substrates compared to other proteins. The concentrations of fibrinogen (3000–5000 μg/ml) and C3 (1300 μg/ml) are markedly higher than vitronectin (about 260–290 μg/ml) and thrombin (about 100 μg/ml) in human serum/plasma [33–37]. However, the amounts of adsorbed fibrinogen and C3 on TCPS were lower than vitronectin and thrombin (Figs 1 and 2A), indicating the relatively low affinity of fibrinogen and C3 to TCPS compared with vitronectin and thrombin, which is in agreement to the MALDI results. Unlike the PEG brush configuration which inhibits protein conformation thus hinders protein adsorption [38], the lack of hydroxyl and amine groups in the long hydrophobic chain of PEG hydrogels is likely to contribute to the decrease of C3 adsorption.
Figure 1.
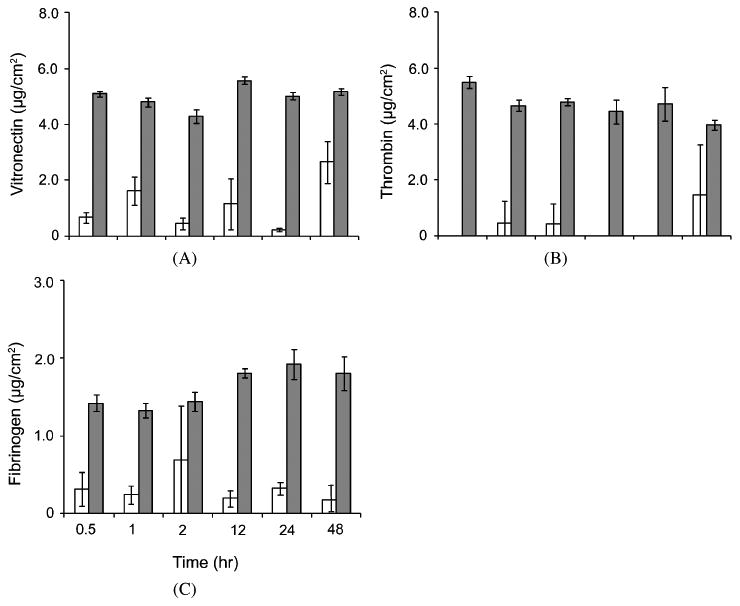
Human serum vitronectin (A), thrombin (B) and fibrinogen (C) adsorbed/absorbed onto PEG hydrogel (3400 Da, □) and TCPS (
 ) from DMEM supplemented with whole human serum at 0.5, 1, 2, 12, 24 and 48 h. All data presented as average ± SD (n = 3).
Figure 2.
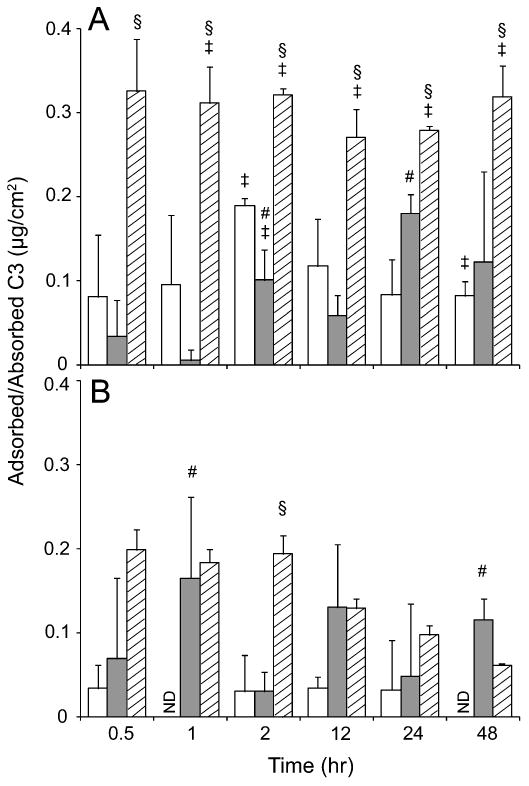
Human complement component C3 adsorbed/absorbed on PEG hydrogels (575 (□) and 3400 Da (
)) and TCPS (▨) from RPMI 1640 supplemented with pooled human sera (A) or C3-inactivated serum (B) at 0.5, 1, 2, 12, 24 and 48 h. All data presented as average ± SD (n = 3). § Significantly different compared to PEG hydrogels (575 and 3400 Da), P < 0.05; ‡significantly different compared to C3-inactivated serum, P < 0.05; #significantly different compared to PEG hydrogel (575 Da), P < 0.05. ND, below detection limit.
3.3. The Activation of C3 and Monocyte Adhesion on PEG Hydrogels and TCPS
Complement component C3 plays a pivotal role in both classic and alternative complement pathways. C3a is generated in the cleavage of C3 to form C3b; thus, it is an indicator of complement C3 activation. As an anaphylatoxin, C3a has a broad proinflammatory impact on cells such as cytokine expression and chemotaxis [39–43]. Moreover, C3a is also important in regulating both the coagulation and the complement cascades [44]. Given the significance of C3, the activation of C3 by PEG to generate C3a is surprisingly lacking in the literature. Thus, C3a concentration in the culture supernatant with and without cells were further determined in this study. Furthermore, C3 has been found adsorbed to different surfaces in blood plasma– material interaction [45–48]. C3 was also reported to mediate leukocyte adhesion to different surfaces [19, 45] by binding to albumin and immunoglobulin G, but not fibrinogen [45, 47]. However, the role of adsorbed C3 in mediating monocyte adhesion on PEG hydrogels is absent in literature.
To further determine the generation of C3a and the bioactivity of adsorbed C3 in mediating monocyte adhesion to PEG hydrogels, human primary monocytes were isolated and seeded onto PEG hydrogels (575 and 3400 Da) and TCPS with pooled or C3-inactivated human sera. Results showed that both PEG hydrogels and TCPS significantly enhanced the C3a concentration in the supernatant when compared with the baseline C3a concentration in the culture medium (Fig. 3). The presence of monocytes generally had no significant impact on the C3a concentration, indicating the C3a concentration in supernatant is dependent mainly on substrates. C3a concentration was similar between PEG hydrogels and TCPS. This suggests that the C3a formation is less dependent on the surfaces tested. Although PEG hydrogels mediated lower C3 adsorption than TCPS (Fig. 2), the extent of C3 activation between the two surfaces was comparable.
Figure 3.
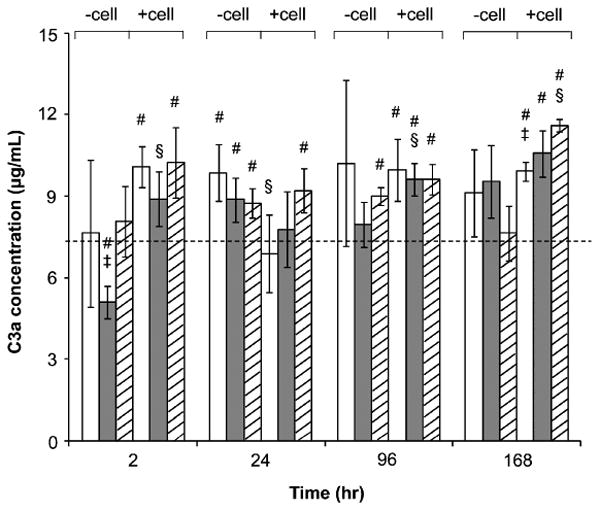
Soluble C3a concentration in culture supernatant with PEG hydrogels (575 (□) and 3400 Da (
)) and TCPS (▨). Human primary monocytes were seeded on these substrates in RPMI 1640 supplemented with 10% pooled human sera. Culture supernatants with and without cells were collected at 2, 24, 96 and 168 h. The C3a concentrations in supernatants were analyzed by ELISA. The dashed line represents the C3a concentration in 10% pooled human sera without incubation with any substrate. All data presented as average ± SD (n = 3). § Significantly different compared to the same substrate without cells, P < 0.05; ‡significantly different compared to TCPS, P < 0.05; #significantly different compared to pooled human sera, P < 0.05.
The adherent monocyte densities on PEG hydrogels were significantly higher with pooled sera than with C3-inactivated serum from 24 to 168 h (Fig. 4, P < 0.05). Similarly, the adherent cell density on TCPS was significantly higher at 24 and 96 h in the presence of pooled sera (P < 0.01) than with C3-inactivated serum. These indicate the significant effect of C3 on mediating monocyte adhesion to both PEG hydrogels and TCPS. Furthermore, the number of cells adhered to PEG hydrogels was significantly lower than that on TCPS with pooled sera from 2 to 96 h (P < 0.01), which could be partially contributed to the low adsorption of C3 on the hydrogels, although the C3a concentration of both TCPS and PEG hydrogels was comparable. The low concentration of other adsorbed proteins (e.g., fibrinogen, vitronectin and thrombin) on PEG hydrogels also contributed to the lower density of adherent cells since fibrinogen and vitronectin can both mediate cell adhesion and thrombin cleaves C3 to generate C3b which could also promote monocyte attachment. The morphology of adherent monocytes on PEG hydrogels and TCPS was similar at 24 h, but the density of cells on PEG hydrogels was markedly lower than on TCPS with pooled sera (Fig. 5).
Figure 4.
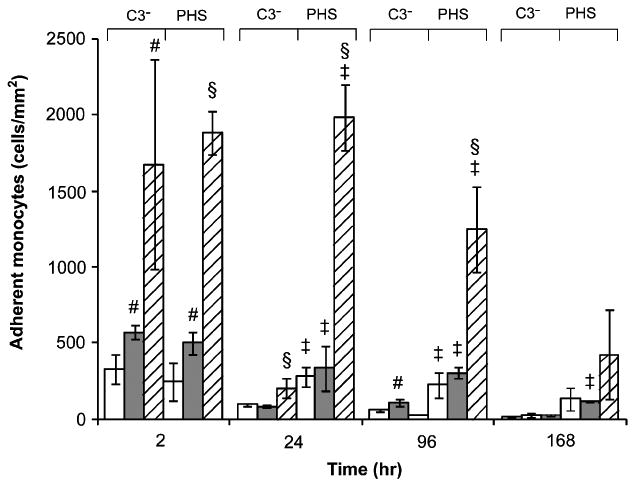
Adherent monocyte density on PEG hydrogels (575 (□) and 3400 Da (
) and TCPS (▨) with RPMI 1640 supplemented with C3-inactivated (C3−) or pooled human sera (PHS) at 2, 24, 96 and 168 h. Cell seeding density was 0.5 ml at 5 × 10 cells/ml. All data presented as average ± SD (n = 3). §Significantly different compared to PEG hydrogels (575 and 3400 Da), P < 0.05; ‡significantly different compared to C3-inactivated serum, P < 0.05; #significantly different compared to PEG hydrogel (575 Da), P < 0.05.
Figure 5.
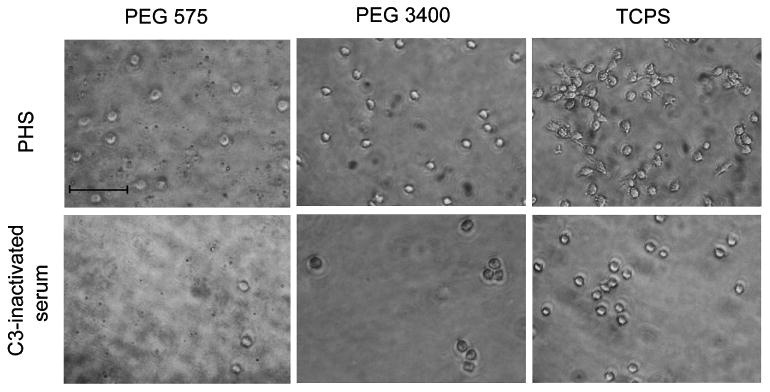
Adherent monocyte morphology on PEG hydrogels (575 and 3400 Da) and TCPS in RPMI 1640 supplemented with 10% pooled human sera (PHS) or C3-inactivated serum at 24 h. Adherent cells were washed with RPMI and imaged with a camera attached to inverted microscope at a magnification ×20. Scale bar = 50 μm.
4. Conclusion
The adsorption of blood proteins on solid surfaces significantly impacts the subsequent cell–material interaction and, thus, largely determines the host response to biomaterials. In this study, the complex proteome of serum proteins adsorbed onto PEG hydrogels and TCPS was probed by MALDI coupled with complementary immunoassays. When compared with TCPS, PEG hydrogels showed a significantly lower adsorption of vitronectin, thrombin, fibrinogen and complement component C3, although the soluble C3a concentration of TCPS and PEG hydrogels were comparable. Adherent monocyte density was also significantly lower on PEG hydrogels as compared to TCPS, while the inactivation of C3 resulted in a lower adherent monocyte density on both TCPS and PEG hydrogels. Therefore, we conclude that the biocompatibility of PEG hydrogels both in vitro and in vivo can be partly contributed to their limited C3 interaction and monocyte activity.
Acknowledgments
The authors thank Sean Zuckerman, Grzegorz Sabat and Yao Fu for their assistance in MALDI and FT-IR. This work was supported in part by NIH Grant R01 EB6613.
References
- 1.Nakanishi K, Sakiyama T, Imamura K. J Biosci Bioeng. 2001;91:233. doi: 10.1263/jbb.91.233. [DOI] [PubMed] [Google Scholar]
- 2.Welle A, Grunze M, Tur D. J Colloid Interface Sci. 1998;197:263. doi: 10.1006/jcis.1997.5238. [DOI] [PubMed] [Google Scholar]
- 3.Sun S, Yue Y, Huang X, Meng D. J Membr Sci. 2003;222:3. [Google Scholar]
- 4.Chen H, Yuan L, Song W, Wu Z, Li D. Prog Polym Sci. 2008;33:1059. [Google Scholar]
- 5.Higuchi A, Sugiyama K, Yoon BO, Sakurai M, Hara M, Sumita M, Sugawara S, Shirai T. Biomaterials. 2003;24:3235. doi: 10.1016/s0142-9612(03)00186-8. [DOI] [PubMed] [Google Scholar]
- 6.Haynes CA, Norde W. Colloids Surfaces B: Biointerfaces. 1994;2:517. [Google Scholar]
- 7.Kingshott P, St John HA, Griesser HJ. Anal Biochem. 1999;273:156. doi: 10.1006/abio.1999.4201. [DOI] [PubMed] [Google Scholar]
- 8.Kingshott P, Thissen H, Griesser HJ. Biomaterials. 2002;23:2043. doi: 10.1016/s0142-9612(01)00334-9. [DOI] [PubMed] [Google Scholar]
- 9.Ishikawa I, Chikazawa Y, Sato K, Nakagawa M, Imamura H, Hayama S, Yamaya H, Asaka M, Tomosugi N, Yokoyama H, Matsumoto K. Am J Nephrol. 2006;26:372. doi: 10.1159/000094779. [DOI] [PubMed] [Google Scholar]
- 10.Du H, Chandaroy P, Hui SW. Biochim Biophys Acta. 1997;1326:236. doi: 10.1016/s0005-2736(97)00027-8. [DOI] [PubMed] [Google Scholar]
- 11.Huang NP, Michel R, Voros J, Textor M, Hofer R, Rossi A, Elbert DL, Hubbell JA, Spencer ND. Langmuir. 2001;17:489. [Google Scholar]
- 12.Joeng JH, Lim DW, Han DK, Park TG. Colloids Surfaces B: Biointerfaces. 2000;18:371. doi: 10.1016/s0927-7765(99)00162-9. [DOI] [PubMed] [Google Scholar]
- 13.Gorbet MB, Sefton MV. Biomaterials. 2004;25:5681. doi: 10.1016/j.biomaterials.2004.01.023. [DOI] [PubMed] [Google Scholar]
- 14.Nilsson B, Ekdahl KN, Mollnes TE, Lambris JD. Mol Immunol. 2007;44:82. doi: 10.1016/j.molimm.2006.06.020. [DOI] [PubMed] [Google Scholar]
- 15.Zhao QH, McNally AK, Rubin KR, Renier M, Wu Y, Rose-Caprara V, Anderson JM, Hiltner A, Urbanski P, Stokes K. J Biomed Mater Res. 1993;27:379. doi: 10.1002/jbm.820270311. [DOI] [PubMed] [Google Scholar]
- 16.Hao YL, Ingham KC, Wickerhauser M. In: Methods of Plasma Protein Fractionation. Curling JM, editor. Academic Press; New York, NY: 1980. p. 57. [Google Scholar]
- 17.Puchades M, Westman A, Blennow K, Davidsson P. Rapid Commun Mass Spectrometr. 1999;13:344. doi: 10.1002/(SICI)1097-0231(19990315)13:5<344::AID-RCM489>3.0.CO;2-V. [DOI] [PubMed] [Google Scholar]
- 18.Pappin DJ, Hojrup P, Bleasby AJ. Curr Biol. 1993;3:327. doi: 10.1016/0960-9822(93)90195-t. [DOI] [PubMed] [Google Scholar]
- 19.McNally AK, Anderson JM. Proc Natl Acad Sci USA. 1994;91:10119. doi: 10.1073/pnas.91.21.10119. [DOI] [PMC free article] [PubMed] [Google Scholar]
- 20.Kragh-Hansen U. Pharm Rev. 1981;33:17. [PubMed] [Google Scholar]
- 21.Roche M, Rondeau P, Singh NR, Tarnus E, Bourdon E. FEBS Lett. 2008;582:1783. doi: 10.1016/j.febslet.2008.04.057. [DOI] [PubMed] [Google Scholar]
- 22.Mahmood TA, Miot S, Martin I, Riesle J, Langer R, van Blitterswijk CA. Biomacro-molecules. 2006;7:3012. doi: 10.1021/bm060489+. [DOI] [PubMed] [Google Scholar]
- 23.Chen H, Chen Y, Sheardown H, Brook MA. Biomaterials. 2005;26:7418. doi: 10.1016/j.biomaterials.2005.05.053. [DOI] [PubMed] [Google Scholar]
- 24.Hamad I, Hunter AC, Szebeni J, Moghimi SM. Mol Immunol. 2008;46:225. doi: 10.1016/j.molimm.2008.08.276. [DOI] [PubMed] [Google Scholar]
- 25.Ying SC, Gewurz AT, Jiang H, Gewurz H. J Immunol. 1993;150:169. [PubMed] [Google Scholar]
- 26.Zembala M, Voegel JC, Schaaf P. Langmuir. 1998;14:2167. [Google Scholar]
- 27.Cheng X, Canavan HE, Graham DJ, Castner DG, Ratner BD. Biointerphases. 2006;1:61. doi: 10.1116/1.2187980. [DOI] [PubMed] [Google Scholar]
- 28.Svendsen IE, Lindh L, Arnebrant T. Colloids Surfaces B: Biointerfaces. 2006;53:157. doi: 10.1016/j.colsurfb.2006.08.016. [DOI] [PubMed] [Google Scholar]
- 29.Neuweiler H, Doose S, Sauer M. Proc Natl Acad Sci USA. 2005;102:16650. doi: 10.1073/pnas.0507351102. [DOI] [PMC free article] [PubMed] [Google Scholar]
- 30.Park JH, Bae YH. Biomaterials. 2002;23:1797. doi: 10.1016/s0142-9612(01)00306-4. [DOI] [PubMed] [Google Scholar]
- 31.Brash JL. Ann N Y Acad Sci. 1987;516:206. doi: 10.1111/j.1749-6632.1987.tb33043.x. [DOI] [PubMed] [Google Scholar]
- 32.Malmsten M, Lassen B, Alstine JM, Nilsson UR. J Colloids Interface Sci. 1996;178:123. [Google Scholar]
- 33.Nogita T, Kawashima M. Arch Dermatol Res. 1992;284:315. doi: 10.1007/BF00372589. [DOI] [PubMed] [Google Scholar]
- 34.Nilehn JE, Ganrot PO. Scand J Clin Lab Invest. 1967;20:113. doi: 10.3109/00365517109095695. [DOI] [PubMed] [Google Scholar]
- 35.Halle M, Berg A, Keul J, Baumstark MW. Arterioscler Thromb Vasc Biol. 1996;16:144. doi: 10.1161/01.atv.16.1.144. [DOI] [PubMed] [Google Scholar]
- 36.Yonemasu K, Kitajima H, Tanabe S, Ochi T, Shinkai H. Immunology. 1978;35:523. [PMC free article] [PubMed] [Google Scholar]
- 37.Anderson L. J Physiol. 2005;563:23. doi: 10.1113/jphysiol.2004.080473. [DOI] [PMC free article] [PubMed] [Google Scholar]
- 38.Lazos D, Franzka S, Ulbricht M. Langmuir. 2005;21:8774. doi: 10.1021/la051049r. [DOI] [PubMed] [Google Scholar]
- 39.Sayah S, Ischenko AM, Zhakhov A, Bonnard AS, Fontaine M. J Neurochem. 1999;72:2426. doi: 10.1046/j.1471-4159.1999.0722426.x. [DOI] [PubMed] [Google Scholar]
- 40.Vecchiarelli A, Retini C, Casadevall A, Monari C, Pietrella D, Kozel TR. Infect Immun. 1998;66:4324. doi: 10.1128/iai.66.9.4324-4330.1998. [DOI] [PMC free article] [PubMed] [Google Scholar]
- 41.Takabayashi T, Vannier E, Clark BD, Margolis NH, Dinarello CA, Burke JF, Gelfand JA. J Immunol. 1996;156:3455. [PubMed] [Google Scholar]
- 42.Monsinjon T, Gasque P, Chan P, Ischenko A, Brady JJ, Fontaine MC. FASEB J. 2003;17:1003. doi: 10.1096/fj.02-0737com. [DOI] [PubMed] [Google Scholar]
- 43.Hartmann K, Henz BM, Krüger-Krasagakes S, Köhl J, Burger R, Guhl S, Haase I, Lippert U, Zuberbier T. Blood. 1997;89:2863. [PubMed] [Google Scholar]
- 44.Amara U, Rittirsch D, Flierl M, Bruckner U, Klos A, Gebhard F, Lambris JD, Huber-Lang M. Adv Exp Med Biol. 2008;632:71. doi: 10.1007/978-0-387-78952-1_6. [DOI] [PMC free article] [PubMed] [Google Scholar]
- 45.Sperling C, Maitz MF, Talkenberger S, Gouzy MF, Groth T, Werner C. Biomaterials. 2007;28:3617. doi: 10.1016/j.biomaterials.2007.04.041. [DOI] [PubMed] [Google Scholar]
- 46.Unsworth LD, Sheardown H, Brash JL. Biomaterials. 2005;26:5927. doi: 10.1016/j.biomaterials.2005.03.010. [DOI] [PubMed] [Google Scholar]
- 47.Andersson J, Ekdahl KN, Lambris JD, Nilsson B. Biomaterials. 2005;26:1477. doi: 10.1016/j.biomaterials.2004.05.011. [DOI] [PubMed] [Google Scholar]
- 48.Tan J, Brash JL. J Biomed Mater Res A. 2009;90:196. doi: 10.1002/jbm.a.32074. [DOI] [PubMed] [Google Scholar]