

Abstract
A major tool in understanding how the brain processes information is the analysis of neuronal output at each hierarchical level along the pathway of signal propagation. Theta rhythm and head directionality are the two main signals found across all levels of Papez's circuit, which supports episodic memory formation. Here, we provide evidence that the functional interaction between both signals occurs at a subcortical level. We show that there is population of head direction cells (39%) in rat anteroventral thalamic nucleus that exhibit rhythmic spiking in the theta range. This class of units, termed HD-by-theta (head direction-by-theta) cells, discharged predominantly in spike trains at theta frequency (6–12 Hz). The highest degree of theta rhythmicity was evident when the animal was heading/facing in the preferred direction, expressed by the Gaussian peak of the directional tuning curve. The theta-rhythmic mode of spiking was closely related to the firing activity of local theta-bursting cells. We also found that 32% of anteroventral theta-bursting cells displayed a head-directional modulation of their spiking. This crossover between theta and head-directional signals indicates that anterior thalamus integrates information related to heading and movement, and may therefore actively modulate hippocampo-dencephalic information processing.
Introduction
Head direction (HD) cells are neurons encoding the animal's directional heading in the horizontal plane (Taube et al., 1990). The information carried by diencephalic head direction cells is multimodal as it integrates external sensory inputs as well as internal idiothetic signals (Kudrimoti et al., 1996; Goodridge et al., 1998; Knierim et al., 1998; Zugaro et al., 2000). These idiothetic signals are driven by the combination of vestibular and proprioceptive inputs (Stackman and Taube, 1997; Stackman et al., 2003; van der Meer et al., 2007). The Papez's pathways mediating head direction signals share remarkably similar connectivity to those mediating theta rhythm (a sinusoidal oscillation of 6–12 Hz). Both pathways involve the tegmental nuclei → mammillary bodies → anterior thalamic nuclei → subicular/entorhinal cortices (Swanson and Cowan, 1977; Witter et al., 1990; Shibata, 1993a; van Groen and Wyss, 1995; Gonzalo-Ruiz et al., 1997; van Groen et al., 1999). Previous studies suggest that the head direction and theta systems involve parallel subcomponents of this circuitry (Vann and Aggleton, 2004; Vertes et al., 2004). Neurons possessing both theta and head-directional properties have been described at the highest level of this circuitry, namely the presubicular/parasubicular region (Cacucci et al., 2004; Boccara et al., 2010). The proposal that theta and head-directional processing converge at an earlier stage is supported by the demonstration of head direction cells in anteroventral thalamic nucleus in freely behaving animals (Yoganarasimha et al., 2006). Convergence of signal processing in anterior thalamus has already been demonstrated by the finding that there is integration of angular head velocity and head directionality in the spiking patterns of anterodorsal thalamic neurons (Blair and Sharp, 1995; Goodridge and Taube, 1997).
Here, we investigated whether there is integration of directional and theta-related information in thalamic anteroventral nucleus (AV). A characteristic feature of AV is the presence of theta-bursting and theta-modulated neurons (Vertes et al., 2001; Tsanov et al., 2011); thus, the major mode of information processing is linked to the thalamic propagation of the theta signal. Theta rhythm appears to serve a critical role for spatial and nonspatial mnemonic functions of the limbic system (Burgess et al., 2002; Buzsáki, 2005). Consistent with this view, electrophysiological studies in rats have found that plasticity occurs between sequentially activated hippocampal place cells during theta epochs (Mehta et al., 2000; Ekstrom et al., 2001), implicating the theta cycle as an information quantum (Skaggs et al., 1996; Buzsáki, 2002).
Rhythmic firing can also affect the degree of thalamic responsiveness. Ventrobasal thalamic neurons show higher sensitivity to incoming somatosensory stimuli when firing rhythmically than when firing tonically (Fanselow et al., 2001; Swadlow and Gusev, 2001). We propose that rhythmic modulation of the head direction thalamic signal could be evoked by a theta input. Here, we analyzed the spiking properties of thalamic anteroventral head direction cells and have found a population of neurons that fire rhythmically at theta frequency. We also detected theta-bursting cells in AV that undergo directional modulation. These data further elaborate the interaction of theta and head-directional processing within the structures of the Papez's circuit (Kocsis and Vertes, 1994; Vertes et al., 2001).
Materials and Methods
Surgical implantation of electrodes.
The recording electrodes consisted of eight bundles of four platinum–iridium wires (90% platinum, 10% iridium; HM-L insulated, 25 μm bare wire diameter; California Fine Wire) twisted together. Tetrodes were threaded through a 25 gauge guide cannula and protected with a 21 gauge cover. Tetrodes were then mounted in a small microdrive (Axona) and implanted in the anteroventral thalamus (−1.5 AP, −1.4 ML, and 5.0 mm dorsoventral to dura). For the cases with parallel hippocampal recordings, a recording electrode was implanted in CA3 subregion (−3.8 AP, −3.0 ML, and 3.0 mm dorsoventral to dura). Experiments were conducted in accordance with European Community Directive 86/609/EC and the Cruelty to Animals Act, 1876, and followed Bioresources Ethics Committee, Trinity College (Dublin, Ireland), and international guidelines of good practice.
Recording sessions.
The recordings took place in a square arena (64 × 64 × 25 cm high) situated in the center of a room with multiple background cues available (surrounding curtains were open). Rats were placed in the open field and 20 mg food pellets (TestDiet; formula 5TUL) were thrown in every 20 s to random locations within the open field; in this way, animals locomoted continuously, allowing for complete sampling of the environment. The duration of each experimental session was 16 min, allowing the recording of the local field signal with predominant theta periods.
Recording techniques.
After at least 1 week recovery, subjects were connected, via a 16 channel headstage (Axona), to a recording system, which also allowed for animal position tracking. Signals were amplified (10,000–30,000×) and bandpass filtered between 380 Hz and 6 kHz for single-unit detection. To maximize cell separation, only waveforms of sufficient amplitude (at least three times noise threshold) were acquired. Candidate waveforms were discriminated off-line using graphical cluster-cutting software (Axona), which allows waveform separation based on multiple features including spike amplitude, spike duration, maximum and minimum spike voltage, and the time of occurrence of maximum and minimum spike voltages. Autocorrelation histograms were calculated for each unit, and the unit was removed from further analysis if the histogram revealed the existence of correlations within the first 2 ms (refractory period), inconsistent with good unit isolation. Autocorrelograms were plotted between −1000 and 1000 ms, with a bin width of 1 ms.
Criteria for data inclusion.
Cells were selected on the basis of their directional correlates, rhythmicity of their firing, and spike isolation. We identified 226 well isolated units within the anterior thalamic nuclei from 12 male (250–350 g) Lister-Hooded rats (Harlan). Based on electrophysiological and postmortem histological criteria, we estimated that 135 of these units were from AV, while 91 were from anterodorsal nucleus (AD). For a cell to be classified as HD-by-theta, it had to meet the following criteria: (1) peak rate in the directional field exceeding 1 Hz, (2) peak firing rate ≥30% higher than the nonpreferred (background) firing rate, and (3) a value of the autocorrelogram calculated theta index >0.001. Only units that fired a sufficient number of spikes for the duration of the 16 min recording sessions to allow the theta index analysis (see below) were included. Thalamic units were classified as theta cells based on their phase locking to local theta oscillations, their bursting firing properties, and their spike shape (Christian and Deadwyler, 1986). A theta unit was defined as a directional theta cell if the peak firing rate was ≥30% higher than the nonpreferred firing rate. The nonpreferred firing rate represents the activity of the unit when the animal is facing the nonpreferred heading direction of the unit. Theta cells were defined as fast spiking for units with average firing rate >30 Hz, while the average firing rate of the slow spiking units was ≤30 Hz.
Theta index analysis.
A sine wave with decaying amplitude was fitted to the autocorrelograms shown in Equation 1:
 |
where t refers to time, and a–c, τ1, τ2, and ω are the fit parameters. The fit parameters are estimated using the least-squares fitting method. The theta index is defined as the ratio of the fitted parameters, a/b, where a is amplitude of oscillation and b is the offset of the oscillation. Only autocorrelograms for all spikes with values of the theta index different from zero were analyzed, excluding the units with low firing rates.
Head direction analyses.
Directional analyses were only performed for experiments with two LEDs (for all head direction cells in anterodorsal and anteroventral thalamic nuclei, 101 units in total). The rat's head direction was calculated for each tracker sample from the projection of the relative position of the two LEDs onto the horizontal plane. The directional tuning function for each cell was obtained by plotting the firing rate as a function of the rat's directional heading, divided into bins of 5°. The firing rate was computed based on the total number of spikes divided by the total time in that bin (Taube et al., 1990). To restrict the influence of inhomogeneous sampling on directional tuning, we accepted data only if all directional bins were sampled by the rat. The directionality of the HD units in the horizontal plane (measured in degrees) was normalized for comparison of the HD firing rate properties. The peak firing rate of cells that respond to different direction of heading was aligned to a head direction of 180° (Bassett et al., 2005). The firing rate was normalized (with values between 0 and 1) with respect to the peak firing rate for each unit (Bassett et al., 2005).
Gaussian function.
The Gaussian function or the Gaussian distribution is described mathematically by Equation 2:
 |
where a represents the peak of the curve; b, the position of the center peak; and c, width of the peak. The Gaussian distribution has the property that the majority of values 68% fall between ± 32 σ (SD) away from the mean.
Directional and locational information content.
Field maps were calculated by dividing the number of spikes which occurred in specific pixel coordinates by the total trial time the animal spent in that coordinate (Cacucci et al., 2004). This produced maps depicting the place fields of each cell in hertz. The pixel map is converted into a 32 × 32 array of square bins 2 cm on a side. The spatial selectivity of firing field (ratio of maximal signal-to-noise) was calculated by dividing the firing rate of the cell in the bin with the maximum average rate by its mean firing over the entire apparatus. To correct sampling bias and to quantify the influence of location on head direction cells, the maximum-likelihood model (MLM) analyses (Cacucci et al., 2004) were used. After the MLM correction, we calculated the locational and directional information as follows:
 |
where I refers to information content, pj is the probability of the rat occupying bin j, λj is the average firing rate in bin j, and λ is the average firing rate of the cell.
Distributive ratio analyses.
To overcome the problems of sampling bias, we also used the “distributive hypothesis” method (Muller et al., 1994; Cacucci et al., 2004). Similar to the MLM correction, the distributive hypothesis procedure was applied to quantify the influence of head direction on the spatial firing. The calculation of locational distributive ratio is based on the estimation of directional firing that one would predict under the null hypothesis that the firing of a cell is only modulated by location and that the only influence of head direction arises from the sampling bias discussed above. The predicted rate as a function of direction is as follows:
 |
where Rp is the firing rate in one pixel and Tp(θ) is the time spent facing head direction θ in that pixel. Then we tested whether the observed directional tuning for the cell, Robs(θ), differs from the one calculated under the assumption that the effect of direction is purely artifactual, Rpred(θ). We achieved this by computing a “distributive ratio” (DR) as follows:
 |
where N is the number of directional bins considered. For a perfect prediction, DR is zero. A perfect prediction indicates that the null hypothesis is true, namely, place cell firing is only modulated by location and the directional influence on place cell firing is only attributable to the inhomogeneity of sampling referred to above, whereas high values of this ratio would indicate a poor prediction (indicating that head direction accounts for some of the variability in the firing rate of the cell).
Definition of compact spike trains.
For HD-by-theta units, the trains included three or more spikes with interspike interval (ISI) of 10–50 and 15–250 ms pause, preceding the first spike of the train.
Interspike interval analysis.
The interspike scatter plot (ISI) represents the interval of the spike to the preceding one (marked on the abscissa) and the interval of the spike to the following one (marked on the ordinate). The interspike (ISI) ratio represents the ratio between the number of spikes from the largest cluster marked with red on the ISI plots and the summation of spikes in the second and third largest clusters in the ISI scatter plot (marked in green/blue on the ISI plots). We used mean shift clustering to cluster the spikes in the ISI scatter plots. Mean shift clustering allows the locating of the maxima of a density function given discrete data sampled from that function (Cheng, 1995). This function determines the weight of nearby points for reestimation of the mean. Mean shift clustering does not require prior knowledge of the number of clusters and it will produce arbitrarily shaped clusters that depend upon the topology of the data (Comaniciu and Meer, 2002). The burst mode was defined with maximal ISI interval of 4 ms to the preceding spike (Ramcharan et al., 2005).
Measurement of local field activity.
The field potential recordings were performed as previously described (Tsanov et al., 2011). The local field potential (LFP) was sampled at 250 Hz and stored for further off-line analysis. LFP signal frequency analysis was done using MATLAB's Signal Processing Toolbox (MATLAB) where the power was calculated using the short-time Fourier transform of the signal (hanning window of 2 s, with overlap of 1 s) and interpolated into color-coded power spectrograms. Information was displayed as the magnitude of the time-dependent Fourier transform versus time in a color gradient graph with the maximum corresponding to 0 dB. The LFP from 32 channels (eight tetrodes), in AV was correlated to the LFP of 2 channels in CA3 of five rats. Three recording sessions with duration of 16 min each were conducted for five animals.
Cross-spectral analyses.
We calculated the coherence, phase and cumulant density using NeuroSpec (Halliday et al., 1995), version 2.0 for MATLAB. In the time domain, the cumulant density function was estimated from the cross-spectrum, via Fourier transform. Cumulant density provides a measure of statistical dependence between random processes and assuming a zero value if the processes are independent (Halliday et al., 1995). The data are split into L nonoverlapping segments, each containing T data points, analyzed with the same discrete Fourier transform segment length, S = T. The total number of samples analyzed is r = LT. Only complete segments are analyzed; data points at the end of the record that did not make a complete segment are not included in the analysis.
Postmortem verification of electrode site.
At the end of the study, brains were removed for histological verification of electrode localization. The animals underwent transcardial perfusion with 0.1 m PBS followed by 10% formol–saline. The brains were postfixed in 10% formol–saline and then transferred to 25% sucrose overnight. Brain sections (16 μm) were Nissl-stained, using 1% toluidine blue, and examined using bright-field microscopy.
Statistical analyses.
All data were analyzed using Prism software (GraphPad Software). Statistical significance was estimated by using two-tailed t test and two-way ANOVA paired with post hoc Newman–Keuls test. The probability level interpreted as statistically significant was p < 0.05. All data points are plotted ± SEM.
Results
Histological and electrophysiological identification of thalamic units
We induced high-frequency current lesions through the electrodes that recorded theta-modulated head direction cells, to determine the exact location of our electrode tips among the nuclei of the anterior thalamus (Fig. 1A). A total of 226 well isolated units was recorded from AV and AD nuclei in 12 rats. All recordings were made during pellet chasing in a square arena. On the basis of the histological verification, we assigned 135 cells from nine rats to AV (Fig. 1A, bottom left) and 91 cells from eight rats to AD (Fig. 1A, bottom right). The recording positions in anteroventral nucleus were distributed predominantly in its medial compartment (Fig. 1A). To achieve maximum isolation of the extracellular signal, we used electrodes in a tetrode configuration, which allowed clear identification of thalamic units (McNaughton et al., 1983; Gray et al., 1995) (Fig. 1B). HD cells are characterized by a tuning curve (Taube et al., 1990), where the firing rate is represented on the ordinate and the animal's head direction represented on the abscissa. The normalized average tuning curve of the units recorded in anteroventral nucleus and defined later as HD-by-theta cells showed well expressed head directionality (Fig. 1C). Head directionality can also be depicted using polar plots (Knierim et al., 1995), where HD-by-theta cells (Fig. 2A) reveal similar to the putative HD cells directionality (Fig. 2B). The average firing rate (33.5 ± 1.66 Hz) and maximal firing rate (109.3 ± 7.43 Hz) of HD-by-theta units (n = 36) were comparable with the average (31.5 ± 1.55 Hz) and maximal (98.7 ± 5.9 Hz) firing rates of the HD units (n = 101), respectively (Table 1). The mean spike amplitude (261.9 ± 22.6 μV) and spike width (189.5 ± 22.6 μs) of the HD-by-theta spikes (Fig. 2C) showed similar values to the mean spike amplitude (251.1 ± 12.1 μV) and spike width (174.2 ± 6.5 μs) of the HD spikes, respectively (Fig. 2D).
Figure 1.
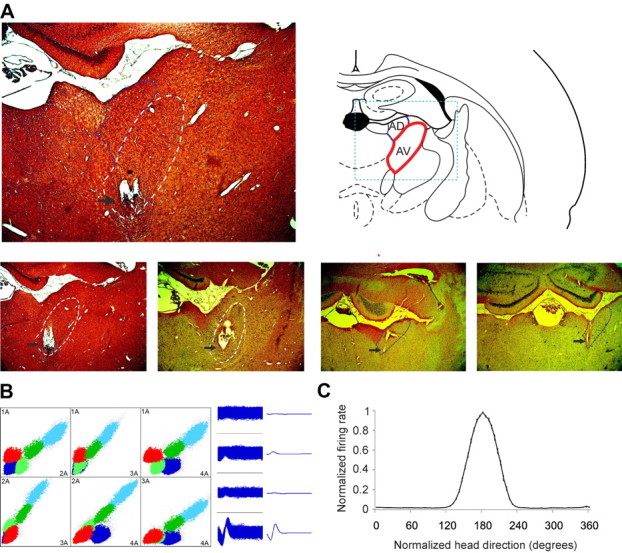
Anatomical location and electrophysiological detection of anteroventral units. A, Coronal brain section from a rat in which eight chronically implanted tetrodes targeted the AV (indicated with dashed white line). The black arrow indicates the tip of the tetrodes. The dashed blue line indicates the adjacent AD. The atlas schematic (right) shows rat anteroventral nucleus location (highlighted with red line). The dashed blue rectangle denotes the extent of the histological section on left. Bottom, Left, Coronal brain sections from two rats with chronically implanted tetrodes in AV (white line). High-frequency current was applied at the level of the identification of HD-by-theta units. Bottom, Right, Coronal brain sections from two rats with chronically implanted tetrodes in AD (blue line). B, Sample scatter plot, showing all signals recorded between each pair of electrodes on a given tetrode. Sample waveform (right) of a HD-by-theta cell, corresponding to the purple cluster in the scatter plot. C, Normalized firing rate versus head direction tuning plot of HD-by-theta units. The y-axis presents normalized firing rate, where the firing rate (with values between 0 and 1) is divided by the peak firing rate for each unit. The x-axis presents normalized head direction in degrees with the peak of the tuning curve for all units set to 180° (mean ± SEM).
Figure 2.

Spiking properties of anteroventral units. A, B, Head-directional properties of HD-by-theta units (A) and HD units (B). The spiking of HD-by-theta (A, top, left; marked with purple symbols) and HD (B, top, left; marked with red symbols) follows equivalent directional pattern. The experiments are conducted in rectangular recording arena and the animal's path is marked with black line. The polar plot examples reveal the head directionality of HD-by-theta (A, top, right) and HD (B, top, right) units. The polar plot for each cell represents the distribution of time heading in different directions across all time bins of the trial (blue) and the distribution of head directions for time bins when a spike was recorded from the cell (black). The coordinate system denotes maximal firing frequency of the recorded unit with 0 Hz in the center and 104.15/70.30 Hz in the periphery. The same signal can be plotted as firing rate versus head direction tuning plot for HD-by-theta (A, bottom) and HD (B, bottom) units. C, D, The spike waveform (left) and the autocorrelogram of spiking activity (right) for eight anteroventral HD-by-theta units (C) and four HD units (D). For the spike waveform, the solid curve represents the mean, and the dashed curve represents the SD. Autocorrelation histograms were calculated for −10/10 ms. The clear isolation of the neuronal extracellular response was identified by the absence of correlations within the first 2 ms of the refractory period.
Table 1.
Electrophysiological classification of thalamic units with head-directional properties
| Cell types |
|||
|---|---|---|---|
| Head direction | Head direction-by-theta | Directional theta | |
| n | 101 | 36 | 10 |
| Mean spike width (μs) | 174.2 ± 6.5 | 189.5 ± 22.6 | 186.1 ± 16.0 |
| Average frequency (Hz) | 31.5 ± 1.5 | 33.5 ± 1.6 | 26.8 ± 1.7 |
| Maximal frequency (Hz) | 98.7 ± 5.9 | 109.3 ± 7.4 | 133.7 ± 13.1 |
| Theta index all spikes | 0.0017 ± 0.0002 | 0.0217 ± 0.0004 | 0.274 ± 0.0551 |
Representation of mean spike width, average frequency, maximal frequency, and theta index of all spikes (mean ± SEM) for the three groups of units that express directional properties in anterodorsal and anteroventral thalamic nuclei.
Tonic and rhythmic profiles of head-directional cells
We estimated the occurrence of rhythmic patterns in neuronal spiking from the interspike intervals scatter plots of all AV neurons with head-directional tuning. The two-dimensional ISI scatter plot represents the action potentials as points, for which the abscissa indicates the interval before and the ordinate indicates the interval after the action potential. The ISI plots of 101 head direction units (44 from AD and 57 from AV) with predominantly tonic spiking were characterized with one major ISI cluster and defined as putative HD cells (Fig. 3A). The tonic ISI profile of HD cells can also be visualized by sample spike traces (Fig. 3A, bottom). Thirty-six head-directional units (HD-by-theta group, all of them from AV) showed an additional two ISI clusters, located in the 100 ms pre- and post-interspike intervals range (Fig. 3B,C). We found that the additional ISI clusters represent the first (Fig. 3B, bottom; marked with green) and the last spike (Fig. 3B, bottom; marked with purple) of rhythmically grouped spike trains. These compact spike trains occur at a frequency of 6–9 Hz (Fig. 3B,C, bottom). The most frequent spike train parameters for the HD-by-theta cells included three or more spikes with an interspike interval of 10 ms and a 25–250 ms pause preceding the first spike of the train. We show that the number of compact spike trains per total spikes from HD cells is much less compared with HD-by-theta cells (t test, p < 0.01) (Fig. 3D, left). This finding reflects the difference between the ISI profiles of these groups, represented by the ISI ratio (the ratio between the number of spikes from additional ISI clusters, marked in green/purple, and the number of spikes from the major cluster, marked in red on the ISI plots). The ISI ratio for HD-by-theta cells is severalfold higher than the ISI ratio of HD cells (t test, p < 0.001) (Fig. 3D, right). The major ISI cluster and the additional two ISI clusters contain the spikes forming the compact spike trains (Fig. 3E–H). ISI analyses therefore suggest the two main types of head-directional cells in AV: tonic and rhythmic units.
Figure 3.

Interspike interval characteristics of anteroventral neurons. A, Two-dimensional log-scale ISI scatter plots for HD unit. The abscissa indicates the interval to the previous action potential, and the ordinate indicates the interval to the next one. The points below the dashed horizontal red line represent the action potentials within the 4 ms range that defines bursting mode. The ISI plot on the right presents the action potentials from the central cluster (marked with red). Bottom, Sample recordings of the same head direction unit for 1 s duration (left) and 500 ms duration (right; marked with red). B, C, ISI plots for all spikes (left) and for the main clusters (right) of two HD-by-theta units. The central cluster is marked in red, with two further clusters (purple and green). Sample recordings of the same cell with 1 s duration (bottom, left) and 500 ms duration (bottom, right). Note that the spikes from the green ISI cluster in B take first position in the spike trains, while the spikes from the purple ISI cluster are positioned last. The intermediate spikes correspond to the points from the central red ISI cluster. D, Comparison between the relative number of spike trains between HD-by-theta and HD cell groups (left; t test, p < 0.01). Right, The ratio between additional green/purple clusters and central red cluster (ISI ratio) for the anteroventral HD-by-theta and HD cell groups (right; t test, p < 0.001). Error bars indicate SEM. **p < 0.01; ***p < 0.001. E, Three examples for all spike ISI histograms of HD units. F–H, ISI histograms of HD-by-theta units for all spikes (F), for the main ISI clusters (G), and when filtered for compact spike trains (H).
Theta rhythmicity of anteroventral neurons
We next quantified the rhythmicity of HD-by-theta cells. We fitted a sinusoidal function to the spike autocorrelogram of each neuron (represented by the red line in Fig. 4A,B) and used the relative amplitude of the fitting parameter to calculate the theta index (Royer et al., 2010). The theta index is the maximal amplitude of the sinusoidal fitted curve relative to the maximal value of the nonsinusoidal fitted curve of the autocorrelograms (for the theta index algorithm, see Materials and Methods). The predominant tonic spiking of HD cells was nonrhythmic autocorrelograms (Fig. 4A, top panels) with theta index values close to zero (0.0017 ± 0.0002). Rhythmic spiking resulted in theta-modulated autocorrelograms for HD-by-theta units (Fig. 4B, top panels), with theta index values of 0.0217 ± 0.0004 (Fig. 4C). As head-directional tuning curves obey a Gaussian distribution (Taube et al., 1990), we examined the rhythmicity of the spikes within the Gaussian peak to investigate how head-directional firing is modulated when the animal is facing the preferred direction for the recorded unit (Taube, 2010). The Gaussian peak function included spiking frequencies from the central part of the head-directional tuning curve (Fig. 4D, marked with a red rectangle). Unlike the HD autocorrelogram (Fig. 4A, middle panels) and the HD theta index (0.0018 ± 0.0002), HD-by-theta autocorrelograms (Fig. 4B, middle panels) showed higher rhythmicity, with values of 0.0484 ± 0.0064. To uncover the rhythmic properties of the spike trains, we analyzed the theta index only for the action potentials composing the spike trains (Fig. 4E,F), where the theta index of HD-by-theta group reached values of 0.6255 ± 0.0086. The Gaussian peak of the spike trains showed that the theta index increased significantly, compared with the Gaussian peak of all spikes of HD-by-theta units (t test, p < 0.01) (Fig. 4G). In this case, the rhythmicity of the HD-by-theta autocorrelograms (Fig. 4B, bottom panels) reached their maximal value (0.1870 ± 0.0265), while the HD autocorrelogram revealed zero values when filtered for spike trains (Fig. 4A, bottom panels).
Figure 4.

Evaluation of theta rhythmicity. A, B, The 1000 ms autocorrelograms of two HD units (A) and four HD-by-theta units (B). The fitted vertical red line indicates the relative amplitude of the sinusoid component of the autocorrelogram, visualizing the degree of autocorrelogram rhythmicity (Royer et al., 2010). The top panels show autocorrelograms for all spikes, the middle panels include all spikes from the Gaussian peak, and the bottom panels include only the spike trains from the Gaussian peak. C, Theta index of all spikes for HD-by-theta (n = 36) and HD (n = 101) cell groups. D, The range of the Gaussian peak is denoted with red rectangle upon the head direction tuning curves for HD (left), and two HD-by-theta units (middle and right). E, Theta index of spike trains for HD-by-theta and HD cell groups (t test, p < 0.01). F, ISI plots of the units presented in D. Comparison between ISI histograms of HD (left) and HD-by-theta (middle and right) units for all spikes (top panels) and when filtered for spike trains (bottom panels). G, Comparison between theta index values of all spikes Gaussian peak (gray bar) and spike trains Gaussian peak (white bar) for HD-by-theta units (t test, p < 0.01). Error bars indicate SEM. **p < 0.01; ***p < 0.001.
To determine the frequency with which the compact spike trains of thalamic head-directional units occur, we plotted an intertrain interval diagram (Fig. 5A). The sequence of HD-by-theta spike trains predominated in the range of 80–170 ms, corresponding to the frequency range of 6–12 Hz (Fig. 5A, black). In comparison, the HD spike trains did not show a preferred frequency range (Fig. 5A, gray). To determine the spike train frequency, we also analyzed the mean spike train frequency for each HD-by-theta unit across all recording sessions (Fig. 5B). We found a distribution of the spike train frequency in the range of 7.89 ± 0.15 Hz. These data show that HD-by-theta units exhibit a constant preference for their spiking frequency (which is ∼8 Hz).
Figure 5.

Theta rhythmicity of anteroventral spike clusters. A, Distribution of spike train intervals (mean ± SEM) for HD-by-theta units. The dashed vertical line denotes interval of 125 ms (8 Hz). The values of HD cells are indicated with gray. B, Mean values of the spike train frequency (in hertz) for all HD-by-theta cells. The inset on the right represents the averaged frequency for all HD-by-theta cells (along with their SD).
Theta cells correspond to HD rhythmicity
The AV is also a location of theta cells (Tsanov et al., 2011), and we next aimed to determine whether the firing pattern of HD-by-theta units is related to thalamic theta cells. We analyzed the recordings in which we detected both theta and HD-by-theta units on the same channel of the same tetrode. This proximity suggests with a high probability that both cells are close enough to be innervated with the axonal branches of the same presynaptic afferent. The cross-correlograms between these cell pairs demonstrated the synchronous rhythmicity for both units (Fig. 6A). Furthermore, the cross-correlation was negative at time lag 0 between theta and HD-by-theta spikes for all pairs (marked with a vertical white line). When compared with a cross-correlation between theta and putative HD cells recorded from the same channel, we found no evidence of synchronization (Fig. 6B). The negative cross-correlation between theta and HD-by-theta spikes can be seen in sample traces of these cell pairs (Fig. 6C). The rhythmic bursts of theta cells (red traces) were paralleled occasionally by pauses of HD-by-theta spiking activity (purple traces). The subsequent pauses formed compact spike trains, which were evident during the firing of HD-by-theta cell in the preferred head direction (black trace, bottom). These parallel events occurred at the troughs (marked with dotted rectangles) of the simultaneously recorded local field potential (green trace). Thus, the intervals between the spike trains of HD-by-theta cells corresponded to the local field troughs, which in turn are phase-locked to theta cell bursts.
Figure 6.

Rhythmic modulation of anteroventral units corresponds to the activity of theta cells. A, Three examples of cross-correlograms between theta and HD-by-theta units recorded from the same tetrode channel. Time 0 is denoted by the dashed white line. B, Cross-correlogram between theta and HD units recorded from the same tetrode channel. C, Sample recordings, representing the parallel activity of theta (red) and HD-by-theta (purple) units. The left panels represent the recorded activity (from 3 different cells) in one animal, while the right panels show similar episodes (from 3 different cells) in a second animal. Simultaneously recorded LFP (green trace) is below. The rectangular box denotes parallel theta cell activity, HD-by-theta pause, and LFP oscillation trough. Bottom, Concurrent head direction (black trace) measured in degrees (y-axis).
Directionally modulated theta cells in anteroventral nucleus
We have found theta modulation of the head-directional signal in AV. Next, we examined whether there was a reciprocal influence of the head-directional system on the theta signal. We therefore analyzed the directional characteristics of all theta-bursting cells recorded within the population of head direction cells, located in the medial part of AV. The small sample size of all theta cells recorded in this region (31; 23%) is comparable with the low density of theta cells in the hippocampal formation (Jung et al., 1994). We identified a group of theta-bursting cells (10/7%), for which the difference between maximal and average firing frequency for preferred head direction reached 40%, and we defined this population as directional theta cells (Fig. 7A–C). Directional theta units possessed an intermediate firing frequency, with an average rate of 26.8 ± 1.7 Hz and a maximal rate of 133.7 ± 13.1 Hz (Fig. 7C, top). The remaining theta units were grouped as slow- (Fig. 7C, middle) and fast-spiking (Fig. 7C, bottom) theta cells, depending on their absolute frequency. For slow-spiking units, the average firing rate was 18.5 ± 1.7 Hz and the maximal firing rate was 76.1 ± 10.5 Hz. For the fast-spiking units, the average firing rate was 63.6 ± 6.4 Hz and the maximal firing rate was 208.8 ± 24.1 Hz. The theta-spiking profile of thalamic theta units is evident when expressed through an autocorrelogram (Fig. 7D) and ISI plots (Fig. 7E). We evaluated the information content of thalamic theta cells by computing place and directional components (Burgess et al., 2005) of the firing of 10 directional theta cells and compared it with the information content of 10 fast-spiking and 12 slow-spiking theta cells. The information content quantifies the amount of spatial information (locational or directional) carried by each spike, expressed in bits per spike (Cacucci et al., 2004). The directional information of directional theta spikes was significantly higher than the directional information of fast-spiking (t test, p < 0.01) and slow-spiking (t test, p < 0.01) theta units (Fig. 7F, left). In comparison, the locational information of directional theta spikes did not show significantly different values (Fig. 7F, right). We also compared distributive ratios for both the directional and locational component of the firing of the units between directional theta cells and fast-/slow-spiking theta cells. Distributive ratios measure the goodness-of-fit between a predicted and an observed firing distribution (Muller et al., 1994). Similarly, the directional (Fig. 7G, left), but not locational (Fig. 7G, right), distributive ratio was significantly higher for directional theta cells, compared with fast-spiking (t test, p < 0.01) and slow-spiking (t test, p < 0.01) theta cells. Thus, we propose that the firing of directional theta cells is modulated by the animal's head direction.
Figure 7.

Directional modulation of anteroventral theta cells. A, Sample tetrodes scatter plot (left) and the corresponding waveform of a directional theta unit (right). B, Polar plot examples reveal head directionality of directional theta unit (right) compared with fast-spiking theta cell (left). The polar plot for each cell represents the distribution of time heading in different directions across all time bins of the trial (red) and the distribution of head directions for time bins when a spike was recorded from the cell (black). The coordinate system denotes maximal firing frequency of the recorded unit with 0 Hz in the center and 69.54/22.68 Hz in the periphery. C, Firing rate versus head direction tuning plot for directional theta (top), slow-spiking theta (middle), and fast-spiking theta (bottom) cells. The x-axis presents normalized head direction degrees that set the peak of tuning curve for all units to 180°. The y-axis represents absolute firing frequency in spikes per second (mean ± SEM). D, Sample 1000 ms autocorrelograms for directional theta (top), slow-spiking theta (middle), and fast-spiking theta (bottom) cells. E, Sample ISI plots for directional theta (top), slow-spiking theta (middle), and fast-spiking theta (bottom) cells. F, Comparison of the directional (left) and locational (right) information for the directional theta (n = 10), slow-spiking theta (n = 12), and fast-spiking theta (n = 10) cells (t test, p < 0.01). G, Comparison of the directional (left) and locational (right) distributive ratio for the same cells. Error bars indicate SEM. **p < 0.01.
HD cells correspond to the directionality of theta units
Although the rhythmic properties of directional theta units are similar to the other theta-bursting cells with a comparable spike train frequency (Fig. 8A), spike distribution (Fig. 8B), and theta index (Fig. 8C), the preferred direction of spiking suggests that these cells receive a distinct afferent signal. Again, we looked for evidence of possible presynaptic inputs that trigger the directionality signal. We identified directional theta and HD units, recorded on the same tetrode channel, and we found similar directionality (Fig. 9A). The cross-correlograms between these cell pairs revealed synchronous activity with a positive correlation at time lag 0 (Fig. 9B, marked with a vertical dashed white line). This suggests that the common head-directional input induces increased spiking of directional theta units when HD activity is present (Fig. 9C), compared with the inactive period of a HD unit (Fig. 9D) when the animal was heading in a nonpreferred head direction (Fig. 9D, bottom; HD degrees are indicated with black trace).
Figure 8.

Comparison of the rhythmic properties between anteroventral theta cells classes. A, Intertrain intervals distribution (mean ± SEM) for directional theta (top), slow-spiking theta (middle), and fast-spiking theta (bottom) cells. Note that the peaks and troughs for all cell classes share the same rhythmic pattern, with the highest peak located at 125 ms (8 Hz). B, C, Relative number of spike trains (B) and theta index values (C) for directional theta unit, fast-spiking theta, and slow-spiking theta cells. Error bars indicate SEM.
Figure 9.

Directional modulation of anteroventral theta cells corresponds to HD activity. A, Firing rate versus head direction tuning plot for a directional theta (red) and a HD cell (purple) recorded from the same tetrode channel. The inset on the left represents the spike waveform (above) and −10/10 ms autocorrelogram (below) for the theta-bursting unit, while the inset on the right represents the same parameters for the HD unit. B, Two examples of cross-correlograms between proximally located directional theta and HD cells. Time 0 is denoted by dashed white line. C, Sample recordings, representing the parallel activity of directional theta (red) and HD (purple) units and recorded during the preferred direction for the HD unit. Simultaneously recorded LFP (green trace) and the concurrent heading direction, measured in degrees (black trace), are plotted below. D, Sample recordings of the same pair during nonpreferred for the HD unit direction. Simultaneously recorded LFP (green trace) and the concurrent heading direction, measured in degrees (black trace), are plotted below. Note the decreased number of directional theta spikes compared with C.
Thalamic and hippocampal theta are functionally related
Our final intention was to determine whether the rhythmic activity observed in the anteroventral thalamic nucleus expresses the same frequency and temporal resolution as hippocampal theta rhythm. This would address the question of whether theta rhythm in anterior thalamus is a functional part of the limbic theta oscillation. For this, we recorded simultaneously LFPs from hippocampal area CA3 (Fig. 10A) and AV (Fig. 10B) in five rats. Thalamic LFP theta power is dependent on the proximity of theta cells to the recording tetrodes (Tsanov et al., 2011), and as a result, the LFPs recorded by different tetrodes in anterior thalamus (in total 32 channels per rat) can be divided into theta and nontheta groups. During the pellet-chasing task, the LFP power reached its peak in the range of 7–10 Hz for hippocampal and thalamic theta recordings (Fig. 11A). Coherence analysis showed that the highest degree of coherence between hippocampal and thalamic theta signal is in the range of 7–10 Hz (Fig. 11B). The synchronization of concurrent hippocampal and thalamic theta oscillations (Fig. 11C) is apparent when both signals are cross-correlated (Fig. 11D, above, red line). The positive value of the central cumulant peak indicates that hippocampal and thalamic theta signals are in-phase. The additional positive cumulant peaks are in the range of 125 ms, revealing that the cross-correlation represents oscillations with a frequency ∼8 Hz. The central cumulant peak is shifted from lag 0 (marked with a dotted vertical line), which demonstrates a time delay between both signals. Based on the timing of this phase shift (Fig. 11E, above), we estimated that thalamic theta precedes hippocampal theta by ∼7–10 ms. In comparison, hippocampal and thalamic nontheta signals are less correlated (Newman–Keuls, p < 0.001) (Fig. 11D, bottom, gray line), without a phase-shift between the signals (Fig. 11E, bottom). We conclude that thalamic and hippocampal theta rhythms are synchronized oscillations.
Figure 10.

A, B, Parallel recordings from hippocampus and anterior thalamus. Coronal section shows the trace of recording electrode in hippocampal CA3 region (A) and anteroventral thalamic nucleus (B; marked with white). The black arrows indicate the tip of the recording electrodes.
Figure 11.

Synchronous hippocampal and thalamic theta oscillations. A, Color-coded 3 s power spectrograms, representing simultaneous recording of LFP from hippocampal area CA3 (left panels), anteroventral theta (middle panels), and anteroventral nontheta (right panels) signal. The black dashed line indicates the frequency level of 8 Hz. B, Coherence plot between hippocampal LFP and anteroventral theta (red trace) and nontheta (gray trace) LFP (mean ± SEM). C, Sample LFP traces for the simultaneously recorded hippocampal (black), anteroventral theta (red), and anteroventral nontheta (gray) LFPs. D, Cross-correlation between hippocampal and anteroventral theta (top, red trace) and nontheta (bottom, gray trace) signal (mean ± SEM). Time lag 0 is denoted by the dashed vertical line. E, Phase plots between hippocampal LFP and anteroventral theta (top) and nontheta (bottom) LFP (mean ± SEM).
Discussion
We provide the first evidence that there is a substantial population of head direction cells in the thalamic anteroventral nucleus that spike rhythmically in the theta frequency range. The single-unit recordings from anteroventral thalamic nucleus revealed that the spiking activity of local theta cells can undergo head-directional modulation. The spectral power from this region shows coherence with hippocampal theta rhythm, suggesting that the anterior thalamus is a functional component of limbic theta processing. Together, these results demonstrate integration of directional and theta processing at the level of the anterior thalamus.
Cell types in anterior thalamus
Based on its anatomical and cytoarchitectonic properties, the anterior thalamus is subdivided into AD, AV, and anteromedial nuclei (Kruger et al., 1995). Electrophysiologically, anterodorsal neurons exhibit head direction properties (Taube, 1995), whereas anteroventral and anteromedial nuclei are linked to theta rhythm (Albo et al., 2003). Numerous electrophysiological investigations have targeted AD in freely behaving rats, revealing that anterodorsal neurons function as HD cells (Taube, 1995; Goodridge and Taube, 1997; Zugaro et al., 2001, 2002; Yoganarasimha et al., 2006). By comparison, most data reported from the adjacent anteroventral nucleus have been conducted without concurrent measures of head directionality (Vertes et al., 2001; Albo et al., 2003; Talk et al., 2004). HD cells in AV have previously been described (Taube, 1995; Yoganarasimha et al., 2006) but have not been quantified. Here, we show that the medial part of anteroventral nucleus is a locus of HD cells, where 69% of recorded units expressed a clear head-directional tuning curve. A population of anteroventral cells fires rhythmically at theta frequency (5–12 Hz) (Vertes et al., 2001), and these neurons are defined as theta cells (Tsanov et al., 2011). An intriguing issue was whether thalamic neurons can integrate head direction and theta rhythm. The possibility that head-directional and theta signals might merge in anterior thalamus was suggested by the curious finding that anterodorsal HD cells gradually developed rhythmic firing in the slow theta frequency range (6 Hz) after bilateral destruction of the lateral mammillary bodies (Blair et al., 1999).
We used three independent criteria to estimate theta modulation of anteroventral head direction neurons: (1) interspike interval ratio, (2) theta index, and (3) spike train frequency. Interspike interval histograms reveal the temporal relationship between HD spikes (Taube, 2010), and our interspike interval ratio shows the number of spikes clustered around the 100 ms interspike interval. We found that these ISI clusters are formed from the first and the last spike of the spike groups, occurring at frequency of 6–12 Hz. We referred to the rhythmic groups of spikes as compact spike trains, but not as bursts because of their interspike interval that reached values of 10 ms. The definition of burst mode in thalamus varies from 4 ms (Ramcharan et al., 2005) up to 10 ms (Fanselow et al., 2001) interspike interval. To avoid misinterpretation of the observed spike pattern, we defined the bursting in our recordings with a maximum of 4 ms interspike interval. Measurement of autocorrelogram parameters is the most conventional method to identify rhythmic pattern in neuronal spiking (Steriade et al., 1991; O'Keefe and Recce, 1993), and on that basis, we evaluated theta rhythmicity using the theta index (Royer et al., 2010). We found that the value of the theta index for the preferred direction of the spiking trains reaches values of 0.18 for HD-by-theta units. Importantly, these values are comparable with the theta index of anteroventral theta cells, which are 0.11 and 0.49 for the fast- and slow-spiking theta cells (Tsanov et al., 2011). For comparison, the theta index of putative HD cells was 0.0018. The third measurement with which we evaluated spiking rhythmicity was the spiking train frequency. This parameter demonstrates the predominant frequency with which rhythmic spike groups are distributed (Wang et al., 1995). We estimated the frequency of the spike train distribution to be 6–12 Hz, which represents theta frequency modulation. Based on the above-mentioned analyses, we defined these cells as HD-by-theta units, and this cell type comprised 26% of all recorded units in medial AV or 39% of the head-directional units in AV.
Information processing in Papez's circuit
One of the major inputs to AV arises from the medial mammillary bodies (Seki and Zyo, 1984), which in turn receive projections from the ventral tegmental nucleus (Cruce, 1977; Hayakawa and Zyo, 1984), hippocampal formation (Swanson and Cowan, 1977; Ishizuka, 2001), and medial septum and supramammillary nucleus (Gonzalo-Ruiz et al., 1992). Thus, the mammillary bodies project to AV a theta signal that integrates tegmental, septal, and reciprocal hippocampal theta activity (Pan and McNaughton, 1997, 2002; Bassant and Poindessous-Jazat, 2001; Kocsis et al., 2001). The supramammillary nucleus is a part of an ascending system involving the medial septum (Vertes, 1992; Borhegyi et al., 1998) and this system is proposed as the cholinergic pacemaker of theta in the hippocampo-diencephalic circuit (Brazhnik and Vinogradova, 1986). Consequently, theta rhythm in the mammillary bodies and hippocampus is abolished after procaine injections in the medial septum (Kirk and McNaughton, 1991; Kirk et al., 1996).
Our finding that AV contains HD-by-theta cells suggests a convergence of the highly processed theta and head direction signals. This convergence might facilitate upstream another level of integration relating visual and idiothetic (theta and head direction) information (Knierim et al., 1998; Yoganarasimha and Knierim, 2005; Hargreaves et al., 2007). The existence of higher-level of integration is demonstrated by postsubicular units that integrate place and direction (Taube et al., 1990; Sharp, 1996). Although anterior thalamus is reciprocally connected to postsubiculum, there are no reports to date of postsubicular cells that integrate theta and HD signal. The level of integration that involves theta may occur in entorhinal cortex and the parahippocampal cortices where attractor-based models of path integration explain the formation of grid/place fields (McNaughton et al., 2006; Moser et al., 2008). Neurons that express spatial, head-directional, and theta properties are found in presubicular and parasubicular cortices and are named TPD (theta-modulated place-by-direction) units (Cacucci et al., 2004). Recent findings have shown concurrent directional and theta modulation of grid cells in the same region (Boccara et al., 2010). This line of research supports current oscillatory interference models that suggest that grid cell firing in entorhinal/parasubicular cortices is highly dependent on a combination of theta and head direction cell activity (Burgess et al., 2007; Burgess, 2008; Hasselmo and Brandon, 2008). Thalamic signals from anterodorsal and anteroventral nuclei may update grid cell firing via the presubicular and parasubicular cortices (van Groen and Wyss, 1990, 1995; Shibata, 1993b). These afferents define the thalamocortical connection of Papez's circuit and the extended hippocampal system (Vann and Aggleton, 2004). Functionally, this system is involved in episodic memory formation (Burgess et al., 2002; Buzsáki, 2005), and the anterior thalamic nuclei are a vital component of this system (Aggleton and Sahgal, 1993; Harding et al., 2000). Concordantly, the patterns of episodic memory loss seen in patients with anterior thalamic pathology are similar to those seen in patients with lesions in the medial temporal lobe (Harding et al., 2000; Van der Werf et al., 2000). The information flow within the thalamocortical pathway of Papez's circuit has been studied through lesion studies of the head direction system. Lesions of the dorsal presubiculum (postsubiculum) (Goodridge and Taube, 1997) and hippocampus (Golob and Taube, 1997) did not disrupt the HD signal in anterodorsal thalamic nucleus. In contrast, lesions of the anterodorsal nucleus disrupted the HD signal in the postsubiculum (Goodridge and Taube, 1997), suggesting that the propagation of HD signal is ascending (i.e., in a bottom-up direction). In parallel to the HD system, the theta system complements the information processing in Papez's circuit (Vann and Aggleton, 2004). Here, we propose that this theta system shares the same ascending signal propagation. Cross-correlation and coherence analyses of simultaneously recorded local field potentials from hippocampus and anterior thalamus show that thalamic theta precedes hippocampal theta by 7–10 ms. We also reveal that approximately one-third (32%) of theta-bursting cells, which generate thalamic theta local field potential (Tsanov et al., 2011), undergo head-directional modulation in the medial part of anteroventral nucleus. The observed crossover between head direction and theta processing may functionally implicate an oscillatory enhancement of the HD signal. This hypothesis is suggested by the finding that rhythmic oscillations generate a period during which thalamic neurons are highly sensitive to incoming stimuli (Nicolelis et al., 1995) and that the rhythmic mode can augment the detection of incoming stimuli (Guido and Weyand, 1995; Sherman and Guillery, 1996; Sherman, 2001).
In conclusion, our data demonstrate that AV neurons integrate head-directional and theta information, and we propose that this signal follows an ascending direction in thalamocortical projection of Papez's circuit. These findings may help to explain the formation of the complex firing properties of neurons in presubiculum and parasubiculum and other parts of the extended hippocampal formation.
Footnotes
This work was supported by Wellcome Trust Grant 081075 (J.P.A., S.M.O'M., J.T.E., S.D.V.).
The authors declare no competing financial interests.
References
- Aggleton JP, Sahgal A. The contribution of the anterior thalamic nuclei to anterograde amnesia. Neuropsychologia. 1993;31:1001–1019. doi: 10.1016/0028-3932(93)90029-y. [DOI] [PubMed] [Google Scholar]
- Albo Z, Viana Di Prisco G, Vertes RP. Anterior thalamic unit discharge profiles and coherence with hippocampal theta rhythm. Thalamus Relat Syst. 2003;2:133–144. [Google Scholar]
- Bassant MH, Poindessous-Jazat F. Ventral tegmental nucleus of Gudden: a pontine hippocampal theta generator? Hippocampus. 2001;11:809–813. doi: 10.1002/hipo.1096. [DOI] [PubMed] [Google Scholar]
- Bassett JP, Zugaro MB, Muir GM, Golob EJ, Muller RU, Taube JS. Passive movements of the head do not abolish anticipatory firing properties of head direction cells. J Neurophysiol. 2005;93:1304–1316. doi: 10.1152/jn.00490.2004. [DOI] [PubMed] [Google Scholar]
- Blair HT, Sharp PE. Anticipatory head direction signals in anterior thalamus: evidence for a thalamocortical circuit that integrates angular head motion to compute head direction. J Neurosci. 1995;15:6260–6270. doi: 10.1523/JNEUROSCI.15-09-06260.1995. [DOI] [PMC free article] [PubMed] [Google Scholar]
- Blair HT, Cho J, Sharp PE. The anterior thalamic head-direction signal is abolished by bilateral but not unilateral lesions of the lateral mammillary nucleus. J Neurosci. 1999;19:6673–6683. doi: 10.1523/JNEUROSCI.19-15-06673.1999. [DOI] [PMC free article] [PubMed] [Google Scholar]
- Boccara CN, Sargolini F, Thoresen VH, Solstad T, Witter MP, Moser EI, Moser MB. Grid cells in pre- and parasubiculum. Nat Neurosci. 2010;13:987–994. doi: 10.1038/nn.2602. [DOI] [PubMed] [Google Scholar]
- Borhegyi Z, Maglóczky Z, Acsády L, Freund TF. The supramammillary nucleus innervates cholinergic and GABAergic neurons in the medial septum-diagonal band of Broca complex. Neuroscience. 1998;82:1053–1065. doi: 10.1016/s0306-4522(97)00301-1. [DOI] [PubMed] [Google Scholar]
- Brazhnik ES, Vinogradova OS. Control of the neuronal rhythmic bursts in the septal pacemaker of theta-rhythm: effects of anaesthetic and anticholinergic drugs. Brain Res. 1986;380:94–106. doi: 10.1016/0006-8993(86)91433-2. [DOI] [PubMed] [Google Scholar]
- Burgess N. Grid cells and theta as oscillatory interference: theory and predictions. Hippocampus. 2008;18:1157–1174. doi: 10.1002/hipo.20518. [DOI] [PMC free article] [PubMed] [Google Scholar]
- Burgess N, Maguire EA, O'Keefe J. The human hippocampus and spatial and episodic memory. Neuron. 2002;35:625–641. doi: 10.1016/s0896-6273(02)00830-9. [DOI] [PubMed] [Google Scholar]
- Burgess N, Cacucci F, Lever C, O'Keefe J. Characterizing multiple independent behavioral correlates of cell firing in freely moving animals. Hippocampus. 2005;15:149–153. doi: 10.1002/hipo.20058. [DOI] [PMC free article] [PubMed] [Google Scholar]
- Burgess N, Barry C, O'Keefe J. An oscillatory interference model of grid cell firing. Hippocampus. 2007;17:801–812. doi: 10.1002/hipo.20327. [DOI] [PMC free article] [PubMed] [Google Scholar]
- Buzsáki G. Theta oscillations in the hippocampus. Neuron. 2002;33:325–340. doi: 10.1016/s0896-6273(02)00586-x. [DOI] [PubMed] [Google Scholar]
- Buzsáki G. Theta rhythm of navigation: link between path integration and landmark navigation, episodic and semantic memory. Hippocampus. 2005;15:827–840. doi: 10.1002/hipo.20113. [DOI] [PubMed] [Google Scholar]
- Cacucci F, Lever C, Wills TJ, Burgess N, O'Keefe J. Theta-modulated place-by-direction cells in the hippocampal formation in the rat. J Neurosci. 2004;24:8265–8277. doi: 10.1523/JNEUROSCI.2635-04.2004. [DOI] [PMC free article] [PubMed] [Google Scholar]
- Cheng Y. Mean shift, mode seeking, and clustering. IEEE Trans Pattern Anal Mach Intell. 1995;17:790–799. [Google Scholar]
- Christian EP, Deadwyler SA. Behavioral functions and hippocampal cell types: evidence for two nonoverlapping populations in the rat. J Neurophysiol. 1986;55:331–348. doi: 10.1152/jn.1986.55.2.331. [DOI] [PubMed] [Google Scholar]
- Comaniciu D, Meer P. A robust approach toward feature space analysis. IEEE Trans Pattern Anal Mach Intell. 2002;24:603–619. [Google Scholar]
- Cruce JA. An autoradiographic study of the descending connections of the mammillary nuclei of the rat. J Comp Neurol. 1977;176:631–644. doi: 10.1002/cne.901760411. [DOI] [PubMed] [Google Scholar]
- Ekstrom AD, Meltzer J, McNaughton BL, Barnes CA. NMDA receptor antagonism blocks experience-dependent expansion of hippocampal “place fields.”. Neuron. 2001;31:631–638. doi: 10.1016/s0896-6273(01)00401-9. [DOI] [PubMed] [Google Scholar]
- Fanselow EE, Sameshima K, Baccala LA, Nicolelis MA. Thalamic bursting in rats during different awake behavioral states. Proc Natl Acad Sci U S A. 2001;98:15330–15335. doi: 10.1073/pnas.261273898. [DOI] [PMC free article] [PubMed] [Google Scholar]
- Golob EJ, Taube JS. Head direction cells and episodic spatial information in rats without a hippocampus. Proc Natl Acad Sci U S A. 1997;94:7645–7650. doi: 10.1073/pnas.94.14.7645. [DOI] [PMC free article] [PubMed] [Google Scholar]
- Gonzalo-Ruiz A, Alonso A, Sanz JM, Llinás RR. Afferent projections to the mammillary complex of the rat, with special reference to those from surrounding hypothalamic regions. J Comp Neurol. 1992;321:277–299. doi: 10.1002/cne.903210208. [DOI] [PubMed] [Google Scholar]
- Gonzalo-Ruiz A, Morte L, Lieberman AR. Evidence for collateral projections to the retrosplenial granular cortex and thalamic reticular nucleus from glutamate and/or aspartate-containing neurons of the anterior thalamic nuclei in the rat. Exp Brain Res. 1997;116:63–72. doi: 10.1007/pl00005745. [DOI] [PubMed] [Google Scholar]
- Goodridge JP, Taube JS. Interaction between the postsubiculum and anterior thalamus in the generation of head direction cell activity. J Neurosci. 1997;17:9315–9330. doi: 10.1523/JNEUROSCI.17-23-09315.1997. [DOI] [PMC free article] [PubMed] [Google Scholar]
- Goodridge JP, Dudchenko PA, Worboys KA, Golob EJ, Taube JS. Cue control and head direction cells. Behav Neurosci. 1998;112:749–761. doi: 10.1037//0735-7044.112.4.749. [DOI] [PubMed] [Google Scholar]
- Gray CM, Maldonado PE, Wilson M, McNaughton B. Tetrodes markedly improve the reliability and yield of multiple single-unit isolation from multi-unit recordings in cat striate cortex. J Neurosci Methods. 1995;63:43–54. doi: 10.1016/0165-0270(95)00085-2. [DOI] [PubMed] [Google Scholar]
- Guido W, Weyand T. Burst responses in thalamic relay cells of the awake behaving cat. J Neurophysiol. 1995;74:1782–1786. doi: 10.1152/jn.1995.74.4.1782. [DOI] [PubMed] [Google Scholar]
- Halliday DM, Rosenberg JR, Amjad AM, Breeze P, Conway BA, Farmer SF. A framework for the analysis of mixed time series/point process data—theory and application to the study of physiological tremor, single motor unit discharges and electromyograms. Prog Biophys Mol Biol. 1995;64:237–278. doi: 10.1016/s0079-6107(96)00009-0. [DOI] [PubMed] [Google Scholar]
- Harding A, Halliday G, Caine D, Kril J. Degeneration of anterior thalamic nuclei differentiates alcoholics with amnesia. Brain. 2000;123:141–154. doi: 10.1093/brain/123.1.141. [DOI] [PubMed] [Google Scholar]
- Hargreaves EL, Yoganarasimha D, Knierim JJ. Cohesiveness of spatial and directional representations recorded from neural ensembles in the anterior thalamus, parasubiculum, medial entorhinal cortex, and hippocampus. Hippocampus. 2007;17:826–841. doi: 10.1002/hipo.20316. [DOI] [PubMed] [Google Scholar]
- Hasselmo ME, Brandon MP. Linking cellular mechanisms to behavior: entorhinal persistent spiking and membrane potential oscillations may underlie path integration, grid cell firing, and episodic memory. Neural Plast. 2008;2008:658323. doi: 10.1155/2008/658323. [DOI] [PMC free article] [PubMed] [Google Scholar]
- Hayakawa T, Zyo K. Comparative anatomical study of the tegmentomammillary projections in some mammals: a horseradish peroxidase study. Brain Res. 1984;300:335–349. doi: 10.1016/0006-8993(84)90844-8. [DOI] [PubMed] [Google Scholar]
- Ishizuka N. Laminar organization of the pyramidal cell layer of the subiculum in the rat. J Comp Neurol. 2001;435:89–110. doi: 10.1002/cne.1195. [DOI] [PubMed] [Google Scholar]
- Jung MW, Wiener SI, McNaughton BL. Comparison of spatial firing characteristics of units in dorsal and ventral hippocampus of the rat. J Neurosci. 1994;14:7347–7356. doi: 10.1523/JNEUROSCI.14-12-07347.1994. [DOI] [PMC free article] [PubMed] [Google Scholar]
- Kirk IJ, McNaughton N. Supramammillary cell firing and hippocampal rhythmical slow activity. Neuroreport. 1991;2:723–725. doi: 10.1097/00001756-199111000-00023. [DOI] [PubMed] [Google Scholar]
- Kirk IJ, Oddie SD, Konopacki J, Bland BH. Evidence for differential control of posterior hypothalamic, supramammillary, and medial mammillary theta-related cellular discharge by ascending and descending pathways. J Neurosci. 1996;16:5547–5554. doi: 10.1523/JNEUROSCI.16-17-05547.1996. [DOI] [PMC free article] [PubMed] [Google Scholar]
- Knierim JJ, Kudrimoti HS, McNaughton BL. Place cells, head direction cells, and the learning of landmark stability. J Neurosci. 1995;15:1648–1659. doi: 10.1523/JNEUROSCI.15-03-01648.1995. [DOI] [PMC free article] [PubMed] [Google Scholar]
- Knierim JJ, Kudrimoti HS, McNaughton BL. Interactions between idiothetic cues and external landmarks in the control of place cells and head direction cells. J Neurophysiol. 1998;80:425–446. doi: 10.1152/jn.1998.80.1.425. [DOI] [PubMed] [Google Scholar]
- Kocsis B, Vertes RP. Characterization of neurons of the supramammillary nucleus and mammillary body that discharge rhythmically with the hippocampal theta rhythm in the rat. J Neurosci. 1994;14:7040–7052. doi: 10.1523/JNEUROSCI.14-11-07040.1994. [DOI] [PMC free article] [PubMed] [Google Scholar]
- Kocsis B, Di Prisco GV, Vertes RP. Theta synchronization in the limbic system: the role of Gudden's tegmental nuclei. Eur J Neurosci. 2001;13:381–388. [PubMed] [Google Scholar]
- Kruger L, Saporta S, Swanson LW. New York: Cambridge UP; 1995. Photographic atlas of the rat brain: the cell and fiber architecture illustrated in three planes with stereotaxic coordinates. [Google Scholar]
- Kudrimoti HS, Knierim JJ, McNaughton BL. Dynamics of visual cue control over head direction cells. Ann N Y Acad Sci. 1996;781:642–644. doi: 10.1111/j.1749-6632.1996.tb15746.x. [DOI] [PubMed] [Google Scholar]
- McNaughton BL, O'Keefe J, Barnes CA. The stereotrode: a new technique for simultaneous isolation of several single units in the central nervous system from multiple unit records. J Neurosci Methods. 1983;8:391–397. doi: 10.1016/0165-0270(83)90097-3. [DOI] [PubMed] [Google Scholar]
- McNaughton BL, Battaglia FP, Jensen O, Moser EI, Moser MB. Path integration and the neural basis of the “cognitive map”. Nat Rev Neurosci. 2006;7:663–678. doi: 10.1038/nrn1932. [DOI] [PubMed] [Google Scholar]
- Mehta MR, Quirk MC, Wilson MA. Experience-dependent asymmetric shape of hippocampal receptive fields. Neuron. 2000;25:707–715. doi: 10.1016/s0896-6273(00)81072-7. [DOI] [PubMed] [Google Scholar]
- Moser EI, Kropff E, Moser MB. Place cells, grid cells, and the brain's spatial representation system. Annu Rev Neurosci. 2008;31:69–89. doi: 10.1146/annurev.neuro.31.061307.090723. [DOI] [PubMed] [Google Scholar]
- Muller RU, Bostock E, Taube JS, Kubie JL. On the directional firing properties of hippocampal place cells. J Neurosci. 1994;14:7235–7251. doi: 10.1523/JNEUROSCI.14-12-07235.1994. [DOI] [PMC free article] [PubMed] [Google Scholar]
- Nicolelis MA, Baccala LA, Lin RC, Chapin JK. Sensorimotor encoding by synchronous neural ensemble activity at multiple levels of the somatosensory system. Science. 1995;268:1353–1358. doi: 10.1126/science.7761855. [DOI] [PubMed] [Google Scholar]
- O'Keefe J, Recce ML. Phase relationship between hippocampal place units and the EEG theta rhythm. Hippocampus. 1993;3:317–330. doi: 10.1002/hipo.450030307. [DOI] [PubMed] [Google Scholar]
- Pan WX, McNaughton N. The medial supramammillary nucleus, spatial learning and the frequency of hippocampal theta activity. Brain Res. 1997;764:101–108. doi: 10.1016/s0006-8993(97)00431-9. [DOI] [PubMed] [Google Scholar]
- Pan WX, McNaughton N. The role of the medial supramammillary nucleus in the control of hippocampal theta activity and behaviour in rats. Eur J Neurosci. 2002;16:1797–1809. doi: 10.1046/j.1460-9568.2002.02267.x. [DOI] [PubMed] [Google Scholar]
- Ramcharan EJ, Gnadt JW, Sherman SM. Higher-order thalamic relays burst more than first-order relays. Proc Natl Acad Sci U S A. 2005;102:12236–12241. doi: 10.1073/pnas.0502843102. [DOI] [PMC free article] [PubMed] [Google Scholar]
- Royer S, Sirota A, Patel J, Buzsáki G. Distinct representations and theta dynamics in dorsal and ventral hippocampus. J Neurosci. 2010;30:1777–1787. doi: 10.1523/JNEUROSCI.4681-09.2010. [DOI] [PMC free article] [PubMed] [Google Scholar]
- Seki M, Zyo K. Anterior thalamic afferents from the mamillary body and the limbic cortex in the rat. J Comp Neurol. 1984;229:242–256. doi: 10.1002/cne.902290209. [DOI] [PubMed] [Google Scholar]
- Sharp PE. Multiple spatial/behavioral correlates for cells in the rat postsubiculum: multiple regression analysis and comparison to other hippocampal areas. Cereb Cortex. 1996;6:238–259. doi: 10.1093/cercor/6.2.238. [DOI] [PubMed] [Google Scholar]
- Sherman SM. Tonic and burst firing: dual modes of thalamocortical relay. Trends Neurosci. 2001;24:122–126. doi: 10.1016/s0166-2236(00)01714-8. [DOI] [PubMed] [Google Scholar]
- Sherman SM, Guillery RW. Functional organization of thalamocortical relays. J Neurophysiol. 1996;76:1367–1395. doi: 10.1152/jn.1996.76.3.1367. [DOI] [PubMed] [Google Scholar]
- Shibata H. Efferent projections from the anterior thalamic nuclei to the cingulate cortex in the rat. J Comp Neurol. 1993a;330:533–542. doi: 10.1002/cne.903300409. [DOI] [PubMed] [Google Scholar]
- Shibata H. Direct projections from the anterior thalamic nuclei to the retrohippocampal region in the rat. J Comp Neurol. 1993b;337:431–445. doi: 10.1002/cne.903370307. [DOI] [PubMed] [Google Scholar]
- Skaggs WE, McNaughton BL, Wilson MA, Barnes CA. Theta phase precession in hippocampal neuronal populations and the compression of temporal sequences. Hippocampus. 1996;6:149–172. doi: 10.1002/(SICI)1098-1063(1996)6:2<149::AID-HIPO6>3.0.CO;2-K. [DOI] [PubMed] [Google Scholar]
- Stackman RW, Taube JS. Firing properties of head direction cells in the rat anterior thalamic nucleus: dependence on vestibular input. J Neurosci. 1997;17:4349–4358. doi: 10.1523/JNEUROSCI.17-11-04349.1997. [DOI] [PMC free article] [PubMed] [Google Scholar]
- Stackman RW, Golob EJ, Bassett JP, Taube JS. Passive transport disrupts directional path integration by rat head direction cells. J Neurophysiol. 2003;90:2862–2874. doi: 10.1152/jn.00346.2003. [DOI] [PubMed] [Google Scholar]
- Steriade M, Dossi RC, Nuñez A. Network modulation of a slow intrinsic oscillation of cat thalamocortical neurons implicated in sleep delta waves: cortically induced synchronization and brainstem cholinergic suppression. J Neurosci. 1991;11:3200–3217. doi: 10.1523/JNEUROSCI.11-10-03200.1991. [DOI] [PMC free article] [PubMed] [Google Scholar]
- Swadlow HA, Gusev AG. The impact of “bursting” thalamic impulses at a neocortical synapse. Nat Neurosci. 2001;4:402–408. doi: 10.1038/86054. [DOI] [PubMed] [Google Scholar]
- Swanson LW, Cowan WM. An autoradiographic study of the organization of the efferent connections of the hippocampal formation in the rat. J Comp Neurol. 1977;172:49–84. doi: 10.1002/cne.901720104. [DOI] [PubMed] [Google Scholar]
- Talk A, Kang E, Gabriel M. Independent generation of theta rhythm in the hippocampus and posterior cingulate cortex. Brain Res. 2004;1015:15–24. doi: 10.1016/j.brainres.2004.04.051. [DOI] [PubMed] [Google Scholar]
- Taube JS. Head direction cells recorded in the anterior thalamic nuclei of freely moving rats. J Neurosci. 1995;15:70–86. doi: 10.1523/JNEUROSCI.15-01-00070.1995. [DOI] [PMC free article] [PubMed] [Google Scholar]
- Taube JS. Interspike interval analyses reveal irregular firing patterns at short, but not long, intervals in rat head direction cells. J Neurophysiol. 2010;104:1635–1648. doi: 10.1152/jn.00649.2009. [DOI] [PMC free article] [PubMed] [Google Scholar]
- Taube JS, Muller RU, Ranck JB., Jr Head-direction cells recorded from the postsubiculum in freely moving rats. I. Description and quantitative analysis. J Neurosci. 1990;10:420–435. doi: 10.1523/JNEUROSCI.10-02-00420.1990. [DOI] [PMC free article] [PubMed] [Google Scholar]
- Tsanov M, Chah E, Wright N, Vann SD, Reilly R, Erichsen JT, Aggleton JP, O'Mara SM. Oscillatory entrainment of thalamic neurons by theta rhythm in freely moving rats. J Neurophysiol. 2011;105:4–17. doi: 10.1152/jn.00771.2010. [DOI] [PMC free article] [PubMed] [Google Scholar]
- van der Meer MA, Knierim JJ, Yoganarasimha D, Wood ER, van Rossum MC. Anticipation in the rodent head direction system can be explained by an interaction of head movements and vestibular firing properties. J Neurophysiol. 2007;98:1883–1897. doi: 10.1152/jn.00233.2007. [DOI] [PubMed] [Google Scholar]
- Van der Werf YD, Witter MP, Uylings HB, Jolles J. Neuropsychology of infarctions in the thalamus: a review. Neuropsychologia. 2000;38:613–627. doi: 10.1016/s0028-3932(99)00104-9. [DOI] [PubMed] [Google Scholar]
- van Groen T, Wyss JM. The connections of presubiculum and parasubiculum in the rat. Brain Res. 1990;518:227–243. doi: 10.1016/0006-8993(90)90976-i. [DOI] [PubMed] [Google Scholar]
- van Groen T, Wyss JM. Projections from the anterodorsal and anteroventral nucleus of the thalamus to the limbic cortex in the rat. J Comp Neurol. 1995;358:584–604. doi: 10.1002/cne.903580411. [DOI] [PubMed] [Google Scholar]
- van Groen T, Kadish I, Wyss JM. Efferent connections of the anteromedial nucleus of the thalamus of the rat. Brain Res Brain Res Rev. 1999;30:1–26. doi: 10.1016/s0165-0173(99)00006-5. [DOI] [PubMed] [Google Scholar]
- Vann SD, Aggleton JP. The mammillary bodies: two memory systems in one? Nat Rev Neurosci. 2004;5:35–44. doi: 10.1038/nrn1299. [DOI] [PubMed] [Google Scholar]
- Vertes RP. PHA-L analysis of projections from the supramammillary nucleus in the rat. J Comp Neurol. 1992;326:595–622. doi: 10.1002/cne.903260408. [DOI] [PubMed] [Google Scholar]
- Vertes RP, Albo Z, Viana Di Prisco G. Theta-rhythmically firing neurons in the anterior thalamus: implications for mnemonic functions of Papez's circuit. Neuroscience. 2001;104:619–625. doi: 10.1016/s0306-4522(01)00131-2. [DOI] [PubMed] [Google Scholar]
- Vertes RP, Hoover WB, Viana Di Prisco G. Theta rhythm of the hippocampus: subcortical control and functional significance. Behav Cogn Neurosci Rev. 2004;3:173–200. doi: 10.1177/1534582304273594. [DOI] [PubMed] [Google Scholar]
- Wang XJ, Golomb D, Rinzel J. Emergent spindle oscillations and intermittent burst firing in a thalamic model: specific neuronal mechanisms. Proc Natl Acad Sci U S A. 1995;92:5577–5581. doi: 10.1073/pnas.92.12.5577. [DOI] [PMC free article] [PubMed] [Google Scholar]
- Witter MP, Ostendorf RH, Groenewegen HJ. Heterogeneity in the dorsal subiculum of the rat. distinct neuronal zones project to different cortical and subcortical targets. Eur J Neurosci. 1990;2:718–725. doi: 10.1111/j.1460-9568.1990.tb00462.x. [DOI] [PubMed] [Google Scholar]
- Yoganarasimha D, Knierim JJ. Coupling between place cells and head direction cells during relative translations and rotations of distal landmarks. Exp Brain Res. 2005;160:344–359. doi: 10.1007/s00221-004-2016-9. [DOI] [PubMed] [Google Scholar]
- Yoganarasimha D, Yu X, Knierim JJ. Head direction cell representations maintain internal coherence during conflicting proximal and distal cue rotations: comparison with hippocampal place cells. J Neurosci. 2006;26:622–631. doi: 10.1523/JNEUROSCI.3885-05.2006. [DOI] [PMC free article] [PubMed] [Google Scholar]
- Zugaro MB, Tabuchi E, Wiener SI. Influence of conflicting visual, inertial and substratal cues on head direction cell activity. Exp Brain Res. 2000;133:198–208. doi: 10.1007/s002210000365. [DOI] [PubMed] [Google Scholar]
- Zugaro MB, Tabuchi E, Fouquier C, Berthoz A, Wiener SI. Active locomotion increases peak firing rates of anterodorsal thalamic head direction cells. J Neurophysiol. 2001;86:692–702. doi: 10.1152/jn.2001.86.2.692. [DOI] [PubMed] [Google Scholar]
- Zugaro MB, Berthoz A, Wiener SI. Peak firing rates of rat anterodorsal thalamic head direction cells are higher during faster passive rotations. Hippocampus. 2002;12:481–486. doi: 10.1002/hipo.10022. [DOI] [PubMed] [Google Scholar]