Abstract
Single photon emission computed tomography (SPECT) myocardial perfusion imaging (MPI) remains a critical tool in the diagnosis of coronary artery disease (CAD). However, after more than three decades of use, photon detection efficiency remains poor and unchanged. This is due to the continued reliance on parallel-hole collimators first introduced in 1964. These collimators possess poor geometric efficiency. Here we present the performance evaluation results of a newly designed multipinhole collimator with 20 pinhole apertures (PH20) for commercial SPECT systems. Computer simulations and numerical observer studies were used to assess the noise, bias and diagnostic imaging performance of a PH20 collimator in comparison with those of a low energy high resolution (LEHR) parallel-hole collimator. Ray-driven projector/backprojector pairs were used to model SPECT imaging acquisitions, including simulation of noiseless projection data and performing MLEM/OSEM image reconstructions. Poisson noise was added to noiseless projections for realistic projection data. Noise and bias performance were investigated for five mathematical cardiac and torso (MCAT) phantom anatomies imaged at two gantry orbit positions (19.5 cm and 25.0 cm). PH20 and LEHR images were reconstructed with 300 MLEM iterations and 30 OSEM iterations (10 subsets), respectively. Diagnostic imaging performance was assessed by a receiver operating characteristic (ROC) analysis performed on a single MCAT phantom; however, in this case PH20 images were reconstructed with 75 pixel-based OSEM iterations (4 subsets). Four PH20 projection views from two positions of a dual-head camera acquisition and sixty LEHR projections were simulated for all studies. At uniformly-imposed resolution of 12.5 mm, significant improvements in SNR and diagnostic sensitivity (represented by the area under the ROC curve, or AUC) were realized when PH20 collimators are substituted for LEHR parallel- hole collimators. SNR improves by factors of 1.94-2.34 for the five patient anatomies and two orbital positions studied. For the ROC analysis the PH20 AUC is larger than the LEHR AUC with a p-value of 0.0067. Bias performance, however, decreases with the use of PH20 collimators. Systematic analyses showed PH20 collimators present improved diagnostic imaging performance over LEHR collimators, requiring only collimator exchange on existing SPECT cameras for their use.
1. Introduction
Coronary artery disease (CAD) is the leading cause of death and morbidity worldwide, and places a heavy economic burden on the global economy (WHO 2008). Single photon emission computed tomography (SPECT) has established itself as a successful and critical component of cost-saving measures when used to screen high risk CAD patients for medical intervention and/or referral to cardiac catheterization laboratories (Garber and Solomon 1999, Hachamovitch et al. 2002). Yet despite the success of SPECT, it is being challenged by 82Rb-PET and coronary computed tomography angiography (CCTA). Part of the reason for the improved diagnostic efficacy of 82Rb-PET MPI and CCTA over SPECT MPI is the low photon detection efficiency inherent in conventional parallel-hole SPECT systems, where photon detection efficiency is the fraction of emitted photons detected by the imaging system (Bateman et al. 2006, Garber and Solomon 1999).
In order to compensate for the low photon detection efficiency of conventional parallel-hole SPECT systems a pinhole collimation has been suggested (Jasczak et al. 1993). Pinhole collimation has obvious advantages over parallel-hole collimation due to significant magnification that enhances detector resolution when the object is placed near the pinhole. In fact, imaging with a set of seven pinholes was investigated as early as 1978 (Vogel et al. 1978). Imaging with multiple pinholes has been extensively investigated in the context of small-animal imaging (Beekman et al. 2005, Cao et al. 2005, Nuyts et al. 2009, van der Have et al. 2009, Vunckx et al. 2008, Vunckx et al. 2008). The superior performance of the multipinhole collimators in small animal imaging with sub-millimeter spatial resolution has driven its use for imaging small human organs such as the brain and heart Ishizu et al. 1995, Mok et al. 2009, Shokouhi et al. 2010, Havelin et al. 2013). Multipinhole collimator performance with application to human cardiac imaging has been the subject of recent investigations (Funk et al. 2006, Steele et al. 2008). Our 20 pinhole design builds off the earlier work of the 9 pinhole by Funk et al. (2006) except without the use of septa to separate projection data and an attempt to utilize as much of the detector area as possible. Currently, there is a commercial dedicated cardiac SPECT system that is based on multipinhole collimators combined with modular solid-state CdZnTe radionuclide detectors (GE Discovery 530c). In addition, there have been extensive commercial and research developments of dedicated cardiac SPECT cameras that utilize the technologies of slit-slat collimators (e.g., CardiArc, Canton, MI, and Chang et al. 2009 IEEE TNS), high-aspect ratio parallel collimators tied with CdZnTe detectors (D-SPECT, Spectrum Dynamics, Caesarea, Israel). A good summary of some of the currently available dedicated cardiac cameras can be found in Garcia (2011).
In this study, we present a quantitative performance evaluation of a multipinhole collimator with 20 pinhole apertures (PH20) applying techniques developed for small-animal applications to human myocardial perfusion imaging. Our PH20 collimators with their 0.75 cm aperture size provide much superior photon detection efficiency over the commercial multipinhole (a total of 19 pinholes coupled with active detectors) cardiac SPECT system (GE Discovery 530c) because our collimators have more apertures and larger pinholes. This collimator is designed to fit existing SPECT cameras (see Figure 1a) without any need of mechanical or architectural modifications while providing over an order-of-magnitude larger photon detection efficiency than can be achieved with conventional LEHR parallel-hole collimators (see Figure 1b). Detailed simulation performance test results of the PH20 collimator are presented in comparison to a LEHR parallel-hole collimator with particular emphasis on the effect of increased efficiency, simultaneous angular sampling on noise performance, and diagnostic sensitivity. We also present task-based and voxel-based performance assessments of the image quality. We define a task-based assessment of a classification task as a receiver operating characteristic (ROC) analysis of tasks involving human or numerical observers emulating human performance (Barrett et al. 1993, Gullberg et al. 1989). These studies provide absolute quantification of the diagnostic capabilities of imaging systems. Voxel-based assessments examine noise, resolution, and bias properties of images and are a useful alternative or complement to task-based assessments. The image quality characteristics such as signal-to-noise ratio (SNR), bias, and the area under the ROC curve (AUC) are presented as a function of resolution as performance metrics for LEHR and PH20 SPECT imaging systems.
Figure 1.
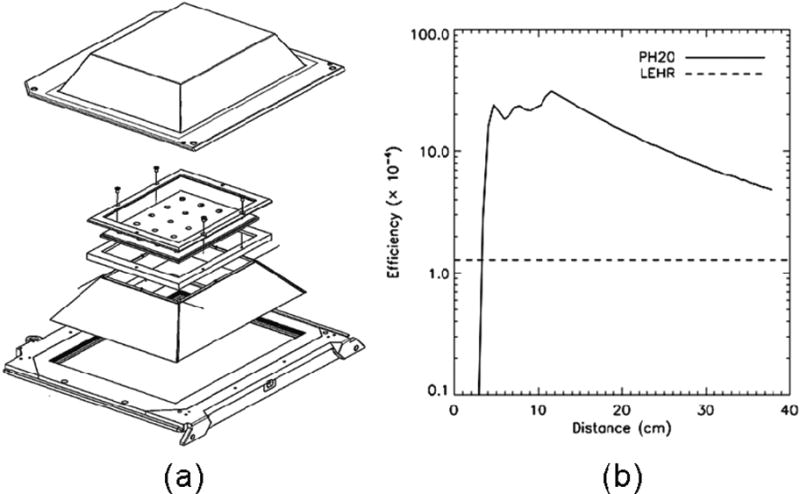
(a) A multipinhole collimator with 20 pinhole apertures designed to be fit on an Infinia Hawkeye 4 (GE Healthcare, Chalfont St. Giles, UK). (b) PH20 (solid line) and LEHR (dashed line) point source photon detection efficiencies as function of distance from the collimator center.
2. Materials and Methods
2.1. Computer simulations
A matched projector/backprojector pair derived from ray-driven techniques (Gullberg et. al 1989, Zeng et. al 1991, Hu et. al 2008) was used to assess PH20 and LEHR collimator performance. Collimator geometry, depth-dependent blur, and attenuation were modeled in the projector. Compton scatter and detector response (including the effects of finite position resolution, photon penetration, and parallax) were ignored. Six configurations of a dual-head SPECT camera system with circular movement of the collimator heads were modeled for estimation of noise properties for both PH20 and LEHR systems. Each configuration is defined by the gender and cardiac geometry of the digital phantom, and the radius-of-rotation (ROR) of the gantry orbit. The mathematical cardiac and torso phantom (MCAT) (Seagars 2001) was used exclusively in this work as a digital model simulating patient anatomies and radioactive tracer distributions. Five MCAT anatomies were investigated: a male torso with an average size heart (NM), a female torso with an average size heart (NF), a male torso with a small heart (SM), a female torso with a small heart (SF), and a female torso with a large heart (LF). In this study all acquisitions assume a circular orbit with either a 19.5 cm (N) or a 25.0 cm (F) radius of rotation (ROR); the former chosen as a minimum limit presented by the patient bed and the latter to represent typical orbits to accommodate the breast tissue for female or obese patients. Further, we assumed a total acquisition time of 600s divided equally between all projection views as is the standard in clinical practice for LEHR (Henzlova et al. 2006, Holly et al. 2007). These phantoms and orbits were taken as a representative and not a comprehensive sample of possible patient types and orbits that might be seen in clinical practice. The female torso contains breast tissue simulating the presence of additional attenuating matter encountered, e.g., when imaging large or obese patients. Large and small heart sizes reflect heart sizes 20% larger and 20% smaller than normal, respectively, as defined in the MCAT phantom. Table 1 contains a summary of the properties of the 6 anatomic models investigated: NMN, NFF, SMN, SFF, LFF NMF. Only the NFF geometry was studied for the task-based assessment.
Table 1.
Simulated patient configurations.
| Model |
Heart Sizea |
Breast Tissueb |
ROR (cm)c |
LV Voxelsd |
|---|---|---|---|---|
| NMN | +0 | N | 19.5 | 106 |
| NFF | +0 | Y | 25.0 | 106 |
| SMN | −20 | N | 19.5 | 74 |
| SFF | −20 | Y | 25.0 | 74 |
| LFF | +20 | Y | 25.0 | 148 |
| NMF | +0 | N | 25.0 | 106 |
% change relative to normal MCAT size
N – no; Y – yes
radius-of-rotation for a circular orbit
number of voxels in image slice studied for voxel-based assessment
NMN = normal male torso at 19.5cm (near)
NFF = normal female torso at 25.0cm (far)
SMN = small male torso (n)ear
SFF = small female torso (f)ar
LFF = large female torso (f)ar
NMF = normal male torso (f)ar
Given a real object, Λ, and an imaging system, Θ, an image of the object can be obtained. We denote the derived or reconstructed image as λ̂. (λ̂ may also be interpreted as an estimator.) Then the imaging system is described mathematically as a mapping Θ : Λ → λ̂. Λ is the object or the object space (depending on the context) and λ is the noiseless reconstructed image or image space. In reality Λ is a continuous variable; however it is convenient to discretize Λ (and λ) into 64 × 64 × 64 cubic volume elements, or voxels, with sides of length 6.25 mm and we do so throughout this work. Λ is the mean activity defining a Poisson emission process and is never actually observed, however it is estimated from projection measurements. In emission tomography (e.g. PET and SPECT) the image acquisition process may be modeled as follows,
| Eq. 1 |
where η and ε are vectors and H is the projector, or system matrix. The backprojector is then HT. η are the projection measurements and ε are the estimated background counts in η (taken to be identically zero in this investigation), e.g. due to scatter. Equation 1 is the projection operation (for ε ≡ 0) and is the basis of our simulations, i.e. given H and Λ, η can be obtained numerically. It is important to note that η denotes noiseless projection data and <η> denotes noisy data and are obtained by adding Poisson noise to η. <η> is a vector of random variables. Subscripted variables denote the contents of projection bins or voxels in object or image space.
The system matrix encodes the number of projection views, angle of rotation (AOR), radius of rotation (for a circular gantry orbit), patient anatomy (in the form of an attenuation map), and pinhole geometry including the layout of the pinholes on the aperture plate. Each of the configurations listed in Table 1 were imaged with four PH20 (45° AOR) and sixty LEHR (3° AOR) projection views. The projection views were discretized into 128 × 128 square projection bins, or pixels, with sides of length 0.44 cm. The 0.75 cm diameter PH20 circular apertures are arranged on a 5 × 4 rectangular grid (see Figure 1a) with 6.2 cm spacing in the long dimension and 5.8125 cm spacing in the short dimension and 32.7° half-opening angle (see Figure 2). The number of pinholes and geometric arrangement are based on the gamma camera size and physically allowed radius of rotation for the gamma camera for which we designed the collimators to utilize as much of the useful detector real estate as possible and to prevent significant overlap of the minified projections within the field of view. The pinhole aperture size (0.75 cm) was determined from Monte Carlo simulation studies as shown in this report, to originally match spatial resolution of SPECT MPI using LEHR collimators. The pinhole is made in the knife-edge configuration. The detector-to-pinhole distance is 12.2 cm. The LEHR collimator consists of circular holes with diameter 0.119 cm and length 1.875 cm. The distance between the detector surface and the LEHR collimator is 0.75 cm. These parameters are summarized in Table 2a. We include the geometric efficiency and sensitivity of the LEHR using standard formula at distances of 19.5 and 25 cm (Cherry et. al 2003) assuming optimal septal thicknesses in Table 2b. For PH20 these parameters were calculated based on theoretical work using our design parameters and those of the camera (Metzler et. al 2001, Metzler and Accorsi 2005). We assume an infinitesimal septal thickness for LEHR since we ignore scatter, to model an ideal collimator. This will overestimate the efficiency but make our results independent of LEHR collimator material. Since the LEHR collimator performs an approximate Radon transform of the radioactivity distribution, the object space was reduced in size to 64 × 64 × 20 voxels to speed up the simulations. This size reduction has a negligible effect on the core results of this paper.
Figure 2.
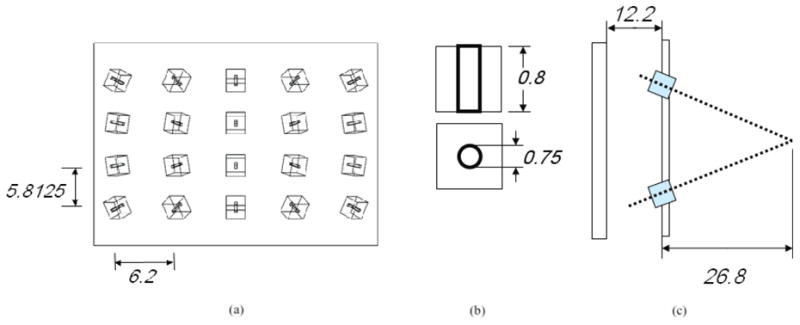
(a) Transparent view of the 20 pinhole collimator, shown is the column and row spacing. (b) Individual pinhole bore length and circular diameter (c) Simple diagram of the detector to focal length distance and detector to camera distance. All distances given are in centimeters.
Table 2.
(a) Summary of LEHR and PH20 simulation parameters. All measurements given in centimeters. (b) Geometric efficiency and spatial resolution for LEHR and PH20 are calculated at distances of 19.5cm and 25.0cm from the center of the detector for point sources.
| Diameter | Length | Configuration | D-Ca Distance | |
|---|---|---|---|---|
| LEHR | 0.119 | 1.88 | Hexagonal | 0.75 |
| PH20 | 0.75 | 0.8 | Square (6.2 short, 5.81 long) |
12.2 |
| (a) | ||||
| Collimator | EFFb 19.5cm | EFF 25.0cm | SRc19.5cm | SR 25.0 cm |
|---|---|---|---|---|
| LEHR | 1.3 × 10⁻⁴ | 1.3 ×10− 4 | 1.39cm | 1.75cm |
| PH20 | 1.6 × 10− 3 | 9.5 × 10− 4 | 4.01cm | 5.4cm |
| (b) | ||||
detector-collimator distance
efficiency
spatial resolution
System matrices for the six configurations listed in Table 1 for both PH20 and LEHR SPECT imaging systems were generated. 25 mCi of 99mTc-sestamibi (140 keV) was simulated for the voxel-based assessment and distributed throughout the phantoms according to the relative weights for each organ listed in Table 3. Table 3 also lists the percent uptake of the administered dose in each modeled organ. For the task-based assessment rest and stress protocols were simulated with 2 mCi and 6.24 mCi of 99mTc-sestamibi, respectively (Strauss et al. 2008). 300 s per PH20 view and 20 s per LEHR view were simulated. Projections were then generated according to Equation 1. For realistic data Poisson noise was added and the projections were then reconstructed.
Table 3.
Estimated organ specific count rates for 25 mCi of 99mTc (140 keV) administered in the NMN MCAT patient anatomy as a function of projection angular sample derived from MGEANT Monte Carlo simulations.
| % total activity | relative weightsa | −22.5° | 0.0° (LL) | 22.5° | 45.0° (LAO) | 67.5° | 90.0° (A) | 112.5 ° | 135°(RAO) | |
|---|---|---|---|---|---|---|---|---|---|---|
| bodyb | 22.4 | 2 | 31184 | 30981 | 30652 | 30772 | 31347 | 31863 | 33201 | 34308 |
| liver | 54.6 | 75 | 135431 | 131668 | 114213 | 85536 | 53631 | 29285 | 16846 | 16043 |
| kidneys | 8.76 | 75 | 448 | 744 | 744 | 655 | 447 | 298 | 278 | 269 |
| spleen | 4.30 | 60 | 705 | 1171 | 1643 | 1841 | 2089 | 3098 | 5564 | 5086 |
| heartc | 8.35 | 75 | 16459 | 28563 | 39966 | 44606 | 40439 | 30562 | 18935 | 11896 |
| stomach | 1.62 | 10 | 941 | 1462 | 936 | 2266 | 2322 | 2096 | 1641 | 1188 |
| total | 100.03 | - | 185168 | 194660 | 189154 | 165677 | 130274 | 97202 | 76465 | 68791 |
per voxel
includes lungs and blood
myocardium
2.2. Image reconstruction
The maximum likelihood expectation maximization (MLEM) algorithm (Shepp and Vardi 1982) were used to estimate Λ for a given a set of projection measurements, <η>. The PH20 projection data set used in the voxel-based analysis were reconstructed with 300 iterations of standard MLEM algorithm. All LEHR projection data, however, were reconstructed with 30 iterations of the ordered subsets expectation maximization (OSEM) algorithm (Hudson and Larkin 1994) with 10 subsets. The PH20 images analyzed in the task-based analysis were reconstructed with 4 subsets of pixel-based OSEM (Branderhorst et al. 2010). The OSEM algorithm requires the partitioning of the projection data into M groupings (subsets), Sm, where 1 ≤ m ≤ M. Each subset, , was treated as an independent data and processed sequentially according to the standard OSEM algorithm with the updated image of one subset serving as input into the next subset. An iteration was completed when all subsets have been processed. This technique achieves an acceleration factor approximately equal to the number of subsets (Hudson and Larkin 1994).
The scalar product of the number of subsets and the number of iterations for OSEM and POSEM is roughly equivalent to the same number of MLEM iterations, even in the case of severely truncated data (Lalush and Tsui 2000) for the purposes of noise evaluation. In particular, the total number of views for 20PH used here, 8, is insufficient for OSEM with similar number of subsets.
2.3. Validation
The projector/backprojector pair was used to both simulate projection data and to perform image reconstruction. Given the importance of the projector/backprojector pair in this work, it is critical to verify that it produces realistic results. Figure 3 compares projection data obtained from MGEANT (Sturner 2000) Monte Carlo (MC) simulations and analytic results. The estimated counts for each projection angle for the MC data set were 30% higher than the analytic data set for LEHR. For PH20, the estimated counts for the MC data set were 30% lower than the analytic data set.
Figure 3.
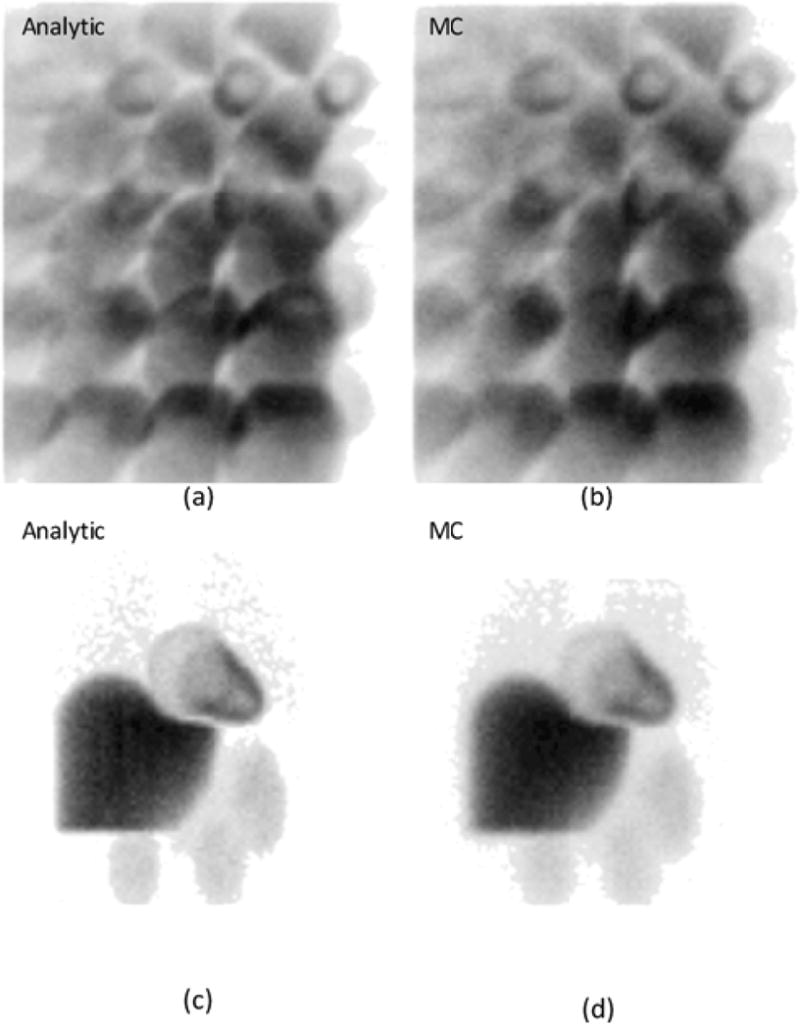
PH20 (a) analytic and (b) Monte Carlo simulated projections; and LEHR (c) analytic and (d) Monte Carlo simulated projections. The PH20 analytic projection contains 30% more counts than in (b), whereas (c) contains 30% fewer counts than in (d). The latter discrepancy is, in part, explained by the use of hexagonal instead of circular holes in the collimator geometry of the MC simulations.
MGEANT simulations were also used to estimate organ specific count rates in the 99mTC energy window (20%) at 140 keV. In these MC simulations a MCAT generated radioactivity distribution within an elliptical water phantom matching the dimensions of the MCAT phantom (12.5 cm and 18.5 cm semiminor and semimajor axis lengths, respectively, and 40 cm axial length) was simulated. Count rates as a function of orbit position on a circular orbit of radius 19.5 cm are given in Table 3. The advantage PH20 SPECT affords is increased counts per detector pixel and so care must be exercised to ensure count rates are within the tolerances of the SPECT camera. A 20% loss in counts is expected at 300 kcps per head for the Infinia Hawkeye 4 SPECT/CT camera (GE Healthcare, Chalfont St. Giles, UK) (Erlandsson 2009).
2.4. Voxel-based assessment of image quality
SPECT MPI requires the comparison of rest and stress images for the detection of perfusion defects. Rest images serve as approximate background-only measurements free of defects even in the presence of severe coronary artery stenosis. Detectable ischemia will present as regions of diminished intensity in stress images relative to corresponding regions in rest images due to a reduction of coronary flow reserve (CFR) in diseased myocardial tissue (Uren et al. 1994). The detection task is therefore approximately equivalent to the problem of extracting a signal from measurements containing background. An appropriate measure of lesion detectability in these circumstances is the signal-to-noise ratio (SNR).
To determine the SNR we add a small impulse δΛb to each voxel in the object, project it and then reconstruct it (without noise). For the small impulses used here, the contrast-to-noise (CNR) and SNR are roughly equivalent. The resulting image is denoted λ(δb), emphasizing that this image is derived from an object with an added impulse. A corresponding image, λ, without added impulse is also obtained. Thus, we calculate the fraction of the recovered impulse, the CRC, and the SNR as follows:
| (Eq. 2) |
| (Eq. 3) |
Since we use the impulse (and the recovery of that impulse) to determine the noise response, it should be chosen as large as possible to give a larger relative scale to the CRC and thus the SNR. For our application impulses δΛb on the order of 10-5Λb were investigated, representing the inverse of the detector counting rate (GE Healthcare 2006): impulses larger than this would begin to interfere in the counts of the original signal and of surrounding voxels. The standard error in each voxel b, σb, is realized with 120 Poisson noise sets.
The SNR was calculated for voxels in the LV wall lying within a transaxial (test) slice intersecting the PH20 and LEHR collimator centers. In total, 614 LV voxels were analyzed from the 6 patient types (106 NMN + 106 NFF + 74 SMN + 74 SFF + 148 LFF + 106 NMF = 614) and are listed in Table 1. For each voxel a reconstruction for the CRC for both LEHR and PH20 collimator was performed and additional reconstructions of 120 noise realizations were performed for σb for a total of 614 × 2 + 120 × 6 + 6 = 2673 reconstructions (six noiseless reconstructions without impulse are required).
2.5. Resolution
Resolution is a difficult topic in the context of nonlinear iterative reconstruction methods. However it is advantageous to compare PH20 and LEHR imaging performances at (nearly) matched resolutions. To achieve this and to simplify the interpretation of resolution we observe that the point-spread function (PSF) of a bias-free image resembles the post-filter (Nuyts 2002, Nuyts and Fessler 2003). In practice bias-free images are unachievable, however can be approximately obtained with a sufficiently large number of iterations. PH20 and LEHR images are reconstructed with 300 MLEM iterations and 30 OSEM (10 subsets) iterations, respectively, and are post-filtered with an isotropic 3D Gaussian filter. Uniform and isotropic resolution is then approximately obtained. We note that in addition to defining the PSF the post-filter also reduces local fluctuations in the reconstructed images.
An objection may be raised regarding the application of this technique to images reconstructed using OSEM. It has been shown (Schmidlin 1999) that the noise properties of OSEM reconstructed images may be, in general, slightly inferior to pure MLEM reconstructed images. Thus, before we apply OSEM algorithms, we have compared noise properties of MLEM and OSEM reconstructed images and found that the noise properties are actually in good agreement.
2.6. Bias
Bias is a measure of reconstructed image accuracy and is an important consideration in dynamic SPECT studies requiring absolute blood flow measurements. Bias is also reflective of nonuniform resolution. We note that λ̂b(η̂(Λ)) is an estimator of the parameter Λb, the mean activity in voxel b. A realization of λ̂b given noisy measurement data <η> is the estimate, and in this sense λ̂b may be considered a random variable. Bias, Bb, is then
| Eq. 4 |
For our purpose, it is more convenient to consider the mean absolute percent error (MAPE), or bias fraction, as a measure of bias:
| Eq. 5 |
Equation 4 is defined on a per voxel basis and allows for the generation of bias maps which are useful visualization tools. Equation 5 is also useful for estimating the accuracy of derived kinetic rate constants in dynamic SPECT studies, e.g. K1 in the one-compartment model (Morris et. al 2006). K1 (for sestamibi uptake in the myocardium) increases by approximately 15% for a CFR value of 3 (Uren et al. 1994, Hatada 2006) limiting the required precision and accuracy of input function and time activity curve measurements.
2.7. Task-based assessment of image quality
In diagnostic nuclear cardiology, the blood flow to the heart muscle is assessed by low-dose/high-dose pair of rest/stress scan. The stress images are then compared with rest images. A significant blockage in the coronary arteries will indicate a perfusion defect. A typical administered doses are 8 mCi for the rest and 25 mCi for the stress acquisition. Here we investigate PH20 and LEHR rest and stress studies with 2 mCi and 6.24 mCi for the rest and stress studies (i.e., a factor of 4 reduction) and observe the diagnostic utility of the resulting images.
For our receiver operating characteristic (ROC) analysis we used the channelized Hotelling observer (Myers 1987). We followed a prescription presented in (Frey 2002). In this numerical observer study the template was trained with 36 Poisson noise realizations of the NFF anatomy and 3 defect locations in the left ventricular (LV) myocardium (anterior, lateral, and inferior LV walls). The defect is 120□ wide and approximately 1 cm thick. Both defect-present and defect-absent noise realizations were used in the training for a total of 36 × 3 × 2 = 216 training sets. In addition, 216 corresponding testing sets were used in the ROC analysis. This process was repeated for PH20 and LEHR studies for a total of 864 reconstructions. The defect contrast in these studies was 20% and the simulated activities were 2 mCi and 6.24 mCi for the rest and stress studies, respectively.
Spatial resolutions vary with distance differently between pinhole and parallel-hole systems. We match the spatial resolutions of the two systems with the application of the Gaussian post-filter described in Section 2.5. The FWHM of this filter is varied from 0.5 cm to 3.5 cm to span the range of most clinically relevant SPECT imaging. The lower limit is determined by the voxel size used in the reconstruction.
3. Results
3.1. Signals-to-noise ratio
Figure 4 shows CRC, σb, and CNR maps for PH20 and LEHR NFF slices. For each anatomy the mean SNR (averaged over all voxels in the test slice) is shown in Figure 5a. The optimal resolution occurs at the local maxima; however, this may not be the desired resolution in a given application. Figure 5b is a major result of this effort, namely, PH20 MPI has demonstrated improvement in SNR over LEHR SPECT MPI by factors of approximately 1.9-2.4 at a uniformly imposed resolution of 12.5 mm.
Figure 4.
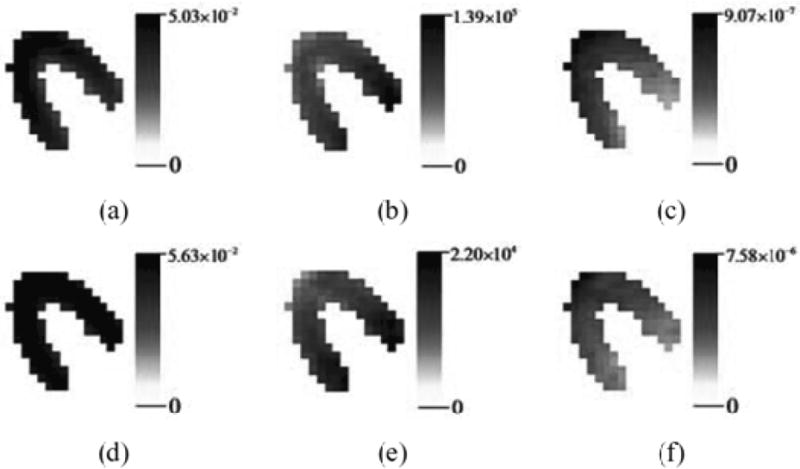
PH20 (a) CRC, (b) standard error, and (c) SNR; and LEHR (d) CRC, (e) standard error, and (f) SNR. CRC correlates with resolution, and may be used to assess resolution uniformity. A comparison of (a) and (d) reveals greater uniformity of resolution along the inner LV wall for the LEHR reconstructed data.
Figure 5.
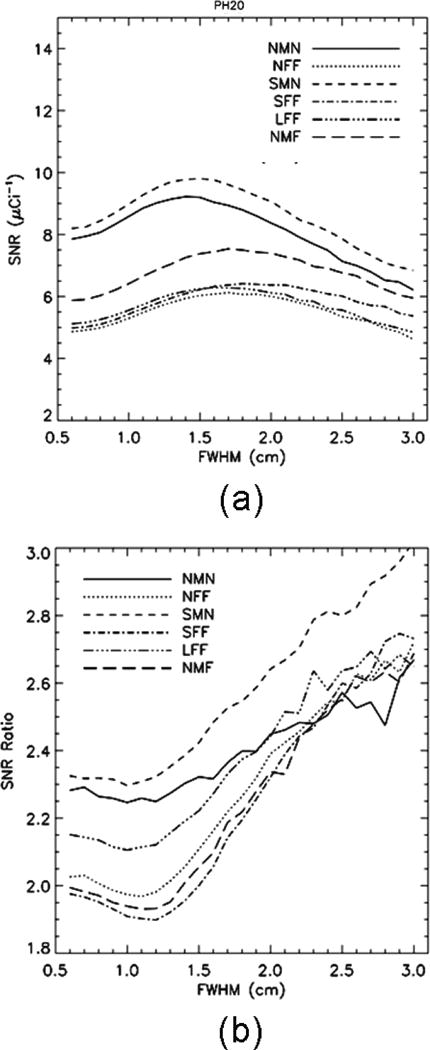
(a) SNR per μCi per voxel averaged over all voxels for each patient anatomy listed in Table 1 for PH20. (b) Ratios of PH20 to LEHR SNRs as a function of the resolution generated by the Gaussian postfilter.
CRC correlates highly with resolution (Qi and Leahy 1999) and a visual inspection of Figure 4a reveals nonuniformities in resolution along the inner LV myocardium in the PH20 images, whereas resolution should be quite uniform in corresponding regions (Figure 4d) in the LEHR reconstructed images. An examination of bias in these slices should confirm these observations.
3.2. Bias
Determination of bias requires 6 × 2 = 12 noiseless reconstructions and results are readily available for all voxels in the 64 × 64 × 64 PH20 image space and 64 × 64 × 20 LEHR image space. Figure 6 displays bias results for the NFF test slice. Averages over the four ROIs shown in Figure 6(a) for all six anatomies are listed in Table 3. Regions of high activity are generally less biased than regions of relatively low activity. It is also apparent that LEHR (30 OSEM iterations) bias performance exceeds that of PH20. LEHR LV and LV blood (pool) image values are within 1% and 10% of object values, respectively, and PH20 LV and LV blood (pool) values are within 10% and 20%-40%, respectively.
Figure 6.
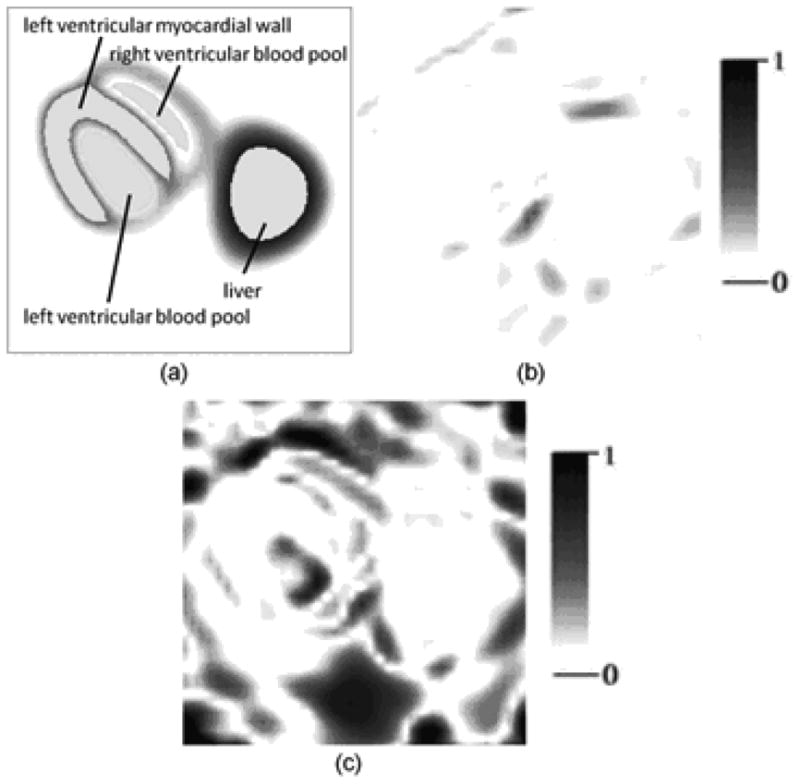
(a) ROI definitions for determination of mean bias fractions (see Table 3) and NFF test slice bias maps for (b) LEHR (30 iterations of OSEM), and (c) PH20. Bias fractions are scaled from 0 (white) to 1 (black).
Bias should correlate inversely with resolution uniformity. Figure 6c indicates resolution should be approximately uniform within the myocardium with some degradation along the inner LV wall, consistent with an examination of the CRC in these regions.
3.3. ROC analysis
Results of the ROC analysis are shown in Figure 7. The AUC is presented as a function of the post-filter resolution. The statistical significance of the differences in AUC was analyzed using the ROCKIT software package (Kurt Rossmann Laboratories for Radiologic Image Research, University of Chicago). At a resolution of 12.5 mm the differences in AUC are statistically significant with a p-value of 0.0067.
Figure 7.
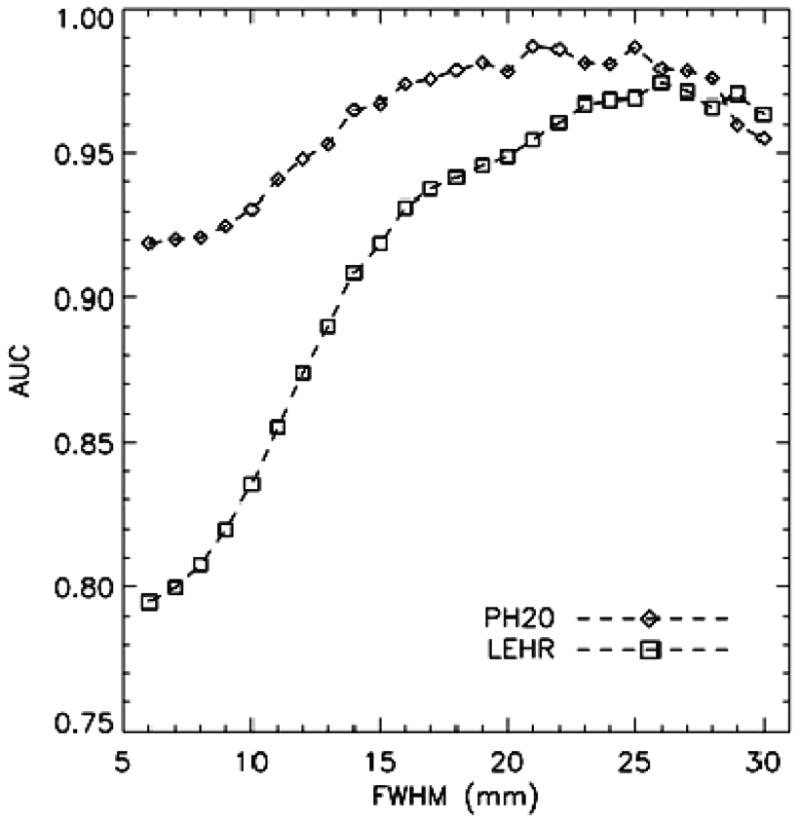
AUC as a function of resolution of the Gaussian postfilter. NFF training and testing data were used exclusively for these results. At 12.5 mm PH20 AUC is larger than the LEHR AUC with a p-value of 0.0067.
3.4 Dose Reduction
In this section PH20 and LEHR MPI acquisitions with 2 mCi of 99mTc-sestamibi administered at rest and 6.25 mCi administered at peak stress are simulated and performance assessed. Figures 8a and 8b show the geometry of the perfusion defect. The angular width of the defect is 30□ and spans the entire length of the LV. Figure 8c contains reconstructed short-axis slices. Comparison of the PH20 rest and stress images reveals a subtle abnormality. The abnormality is absent in the LEHR images. These results are consistent with both the voxel-based and task-based assessments presented in earlier sections.
Figure 8.
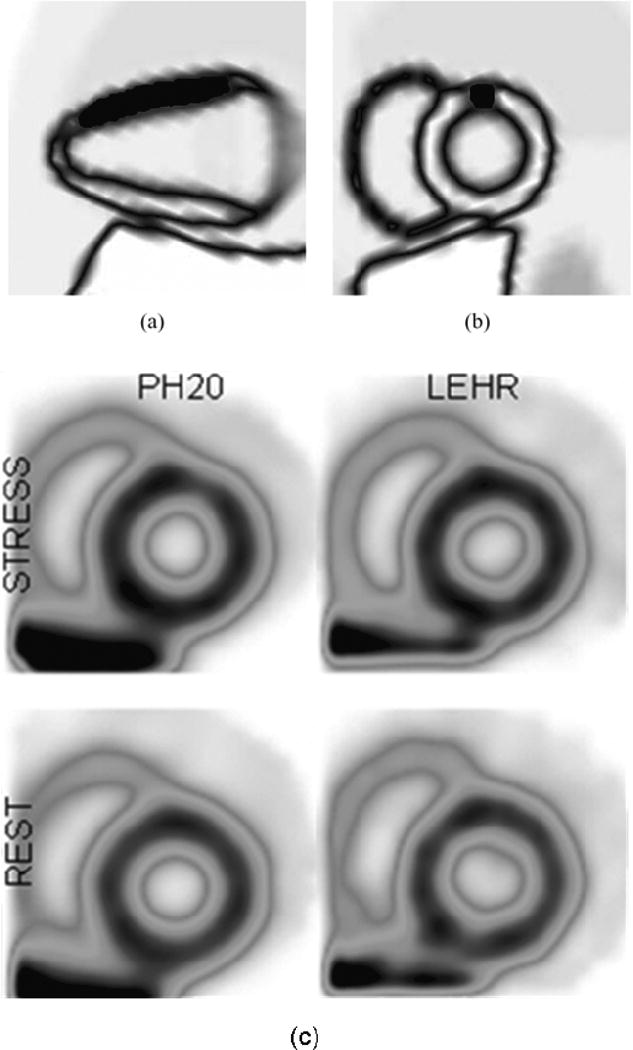
(a) Perfusion defect geometry (20% contrast). (b) Short axis view of the phantom with perfusion defect in (a). (c) Reconstructed PH20 and LEHR short-axis slices of the phantom in (a). An abnormality is present in the PH20 images. No abnormality is apparent in the LEHR images.
4. Discussion
The results of this work assume photon detection efficiencies presented in Figure 1b as calculated by our analytic projector/backprojector pair. Comparisons with MC simulations reveal an over estimation of PH20 detection efficiencies by almost 30% and an underestimation of LEHR detection efficiencies by almost 30%. The former can be explained by the inability of the analytic projector/backprojector to model counting losses from high count rates (as in multipinhole systems) and the latter by the use of hexagonal instead of circular holes for the MC simulations. Correcting for these discrepancies would limit the improvement in PH20 SNR to 30%-70%; however, the efficiency of a clinical LEHR collimator for the Infinia SPECT camera is 0.7 × 10⁻⁴ (GE Healthcare, Chalfont St. Giles, UK) and the efficiency of the LEHR collimator examined in this paper is 1.3 × 10⁻⁴, or larger than clinical LEHR efficiencies by over 85% because we assume an ideal collimator with very high attenuation and low septal thickness. Even if the MC results hold for PH20 detection efficiencies, we expect the relative performances of the collimators in clinical settings to generally follow the major results of this work.
We have ignored the effects of scatter on our projection data. Compton scatters comprise roughly 30%-35% of the counts in PH20 and LEHR projection data and will result in some degradation of reconstructed image quality. We anticipate that incorporation of a scatter model into these investigations will lead to further improvements in PH20 SNR and diagnostic performance relative to LEHR collimator performance due to the improved counting statistics in PH20 projection data.
5. Conclusion
For the patient anatomies investigated PH20 SPECT MPI demonstrates superior noise performance and diagnostic sensitivity over conventional LEHR SPECT MPI. The use of PH20 collimators on current SPECT cameras requires only a simple collimator exchange, an already common procedure performed in SPECT imaging rooms.
Table 4.
| LEHR (30 iterations) | PH20 | |||||||
|---|---|---|---|---|---|---|---|---|
|
| ||||||||
| Phantom | LVa | LV Blood |
RVb Blood |
Liver | LV | LV Blood |
RV Blood |
Liver |
| NMN | 0.005 | 0.050 | 0.033 | 0.008 | 0.106 | 0.332 | 0.330 | 0.063 |
| NFF | 0.008 | 0.067 | 0.079 | 0.012 | 0.083 | 0.316 | 0.161 | 0.024 |
| SMN | 0.006 | 0.028 | 0.033 | 0.006 | 0.108 | 0.300 | 0.183 | 0.071 |
| SFF | 0.009 | 0.039 | 0.069 | 0.010 | 0.094 | 0.203 | 0.323 | 0.024 |
| LFF | 0.008 | 0.097 | 0.076 | 0.017 | 0.080 | 0.393 | 0.390 | 0.040 |
| NMF | 0.007 | 0.054 | 0.043 | 0.011 | 0.052 | 0.274 | 0.079 | 0.024 |
left ventricular myocardium
right ventricle
Acknowledgments
We thank Dr. George Sayre for helpful discussions. This work was supported in part by National Heart, Lung and Blood Institute under Grant #R21 HL083073 (J.D.B. and Y.S.) and Grant #R01 HL050663 (J.E., U.S., G.T.G., and Y.S.), and National Institute of Biomedical Imaging and Bioengineering under Grant R01 EB012965 (T.-C.L. and Y.S.).
Appendix A
We follow an approach outlined in (16) and characterize the image quality of SPECT systems by examining noise properties on a per voxel basis in the image. Using this technique a small signal, or impulse, δΛb, is added to voxel b in the object. The object is then projected and the (noiseless) projections are reconstructed. The resulting image is denoted λ(δb), emphasizing that this image is derived from an object with an added impulse. A corresponding image, λ, without added impulse is also obtained. Only a fraction of the impulse is recovered in b in λ(δb) due to the finite local impulse response (LIR) function of the imaging system (31):
| Eq. 6 |
Note that lirb(b) (λ) is a vector. The recovered impulse is . The standard error in b, σb, is estimated from images reconstructed from Poisson noise realizations of the noiseless projection data without impulse. The SNR for the added signal δΛb in voxel b is approximately . Given the identical simulated radioactivity distribution for both PH20 and LEHR SPECT, the advantage of PH20 SPECT is the greater acquisition time per view for a MPI study with a fixed total acquisition time.
In (16) image quality is characterized by the contrast-to-noise ratio (CNR):
| Eq. 7 |
where σb is the standard error and is the contrast-recovery-coefficient (CRC). The CNR is an appropriate measure of image quality when comparing systems imaging identical objects. This is a consequence of the object appearing explicitly in the partial derivative in Equation 4. When the LIR is nearly independent of Λb, Equation 4 is approximately the recovered impulse fraction. With this interpretation of lir(b) the SNR is then
| Eq. 8 |
The CNR is then equivalent to the SNR when comparing systems imaging identical objects, due to the cancellation of δΛb. The SNR is then a suitable image quality metric when comparing SPECT systems imaging different objects.
In practice estimating the LIR using Equation 4 requires a sufficiently large number of noisy reconstructions with and without impulse. The calculations may be simplified if the reconstruction of a noiseless projection data set is approximately equal to the mean of many noisy reconstructions, i.e. λ(η(Λ))=E[λ̂(η̂(Λ))] This approximation results in the so-called linearized local impulse response (LLIR) function (31):
| Eq. 8 |
and has been shown to be an accurate approximation (32). is an approximation of Equation 8 if δΛb is sufficiently small, and therefore is consistently used to estimate Equation 7 in this work.
References
- Anger HO. Scintillation camera. Rev Sci Instrum. 1958;29:27–33. [Google Scholar]
- Anger HO. Scintillation Camera with Multichannel Collimators. J Nucl Med. 1964;5:515–31. [PubMed] [Google Scholar]
- Barrett HH, Yao J, Rolland JP, Myers KJ. Model observers for assessment of image quality. Proc Natl Acad Sci U S A. 1993;90:9758–65. doi: 10.1073/pnas.90.21.9758. [DOI] [PMC free article] [PubMed] [Google Scholar]
- Bateman TM, Heller GV, McGhie AI, Friedman JD, Case JA, Bryngelson JR, Hertenstein GK, Moutray KL, Reid K, Cullom SJ. Diagnostic accuracy of rest/stress ECG-gated Rb-82 myocardial perfusion PET: comparison with ECG-gated Tc-99m sestamibi SPECT. J Nucl Cardiol. 2006;13:24–33. doi: 10.1016/j.nuclcard.2005.12.004. [DOI] [PubMed] [Google Scholar]
- Beekman FJ, van der Have F, Vastenhouw B, van der Linden AJ, van Rijk PP, Burbach JP, Smidt MP. U-SPECT-I: a novel system for submillimeter-resolution tomography with radiolabeled molecules in mice. J Nucl Med. 2005;46:1194–200. [PubMed] [Google Scholar]
- Branderhorst W, Vastenhouw B, Beekman FJ. Pixel-based subsets for rapid multi-pinhole SPECT reconstruction. Phys Med Biol. 2010;55:2023–34. doi: 10.1088/0031-9155/55/7/015. [DOI] [PubMed] [Google Scholar]
- Cao Z, Bal G, Accorsi R, Acton PD. Optimal number of pinholes in multi-pinhole SPECT for mouse brain imaging--a simulation study. Phys Med Biol. 2005;50:4609–24. doi: 10.1088/0031-9155/50/19/013. [DOI] [PubMed] [Google Scholar]
- Chen J, Einstein AJ, Fazel R, Krumholz HM, Wang Y, Ross JS, Ting HH, Shah ND, Nasir K, Nallamothu BK. Cumulative exposure to ionizing radiation from diagnostic and therapeutic cardiac imaging procedures: a population-based analysis. J Am Coll Cardiol. 2010;56:702–11. doi: 10.1016/j.jacc.2010.05.014. [DOI] [PMC free article] [PubMed] [Google Scholar]
- Cherry S, Phelps M, Sorenson J. Physics in nuclear medicine. third. Philadelphia, PA: Saunders; 2003. [Google Scholar]
- Dorbala S, Hachamovitch R, Curillova Z, Thomas D, Vangala D, Kwong RY, Di Carli MF. Incremental prognostic value of gated Rb-82 positron emission tomography myocardial perfusion imaging over clinical variables and rest LVEF. JACC Cardiovasc Imaging. 2009;2:846–54. doi: 10.1016/j.jcmg.2009.04.009. [DOI] [PMC free article] [PubMed] [Google Scholar]
- Erlandsson K, Kacperski K, van Gramberg D, Hutton BF. Performance evaluation of D-SPECT: a novel SPECT system for nuclear cardiology. Phys Med Biol. 2009;54:2635–49. doi: 10.1088/0031-9155/54/9/003. [DOI] [PubMed] [Google Scholar]
- Fessler JA, Rogers WL. Spatial resolution properties of penalized-likelihood image reconstruction: space-invariant tomographs. IEEE Trans Image Process. 1996;5:1346–58. doi: 10.1109/83.535846. [DOI] [PubMed] [Google Scholar]
- Frey EC, Gilland KL, Tsui BM. Application of task-based measures of image quality to optimization and evaluation of three-dimensional reconstruction-based compensation methods in myocardial perfusion SPECT. IEEE Trans Med Imaging. 2002;21:1040–50. doi: 10.1109/TMI.2002.804437. [DOI] [PubMed] [Google Scholar]
- Funk T, Kirch DL, Koss JE, Botvinick E, Hasegawa BH. A novel approach to multipinhole SPECT for myocardial perfusion imaging. J Nucl Med. 2006;47:595–602. [PubMed] [Google Scholar]
- Garber AM, Solomon NA. Cost-effectiveness of alternative test strategies for the diagnosis of coronary artery disease. Ann Intern Med. 1999;130:719–28. doi: 10.7326/0003-4819-130-9-199905040-00003. [DOI] [PubMed] [Google Scholar]
- Garcia E, Faber T, Esteves F. Cardiac Dedicated Ultrafast SPECT Cameras: New Designs and Clinical Implications. J Nucl Med. 2011;52:210–217. doi: 10.2967/jnumed.110.081323. [DOI] [PubMed] [Google Scholar]
- GE Healthcare GH. InfiniaTM HawkeyeTM 4 Product Datasheet. 2006 [online] Available at: http://www.gehealthcare.com.
- Gullberg GT, Zeng GL, Tsui BMW, Hagius JT. An iterative reconstruction algorithm for single photon emission computed tomography with cone beam geometry. Int J Imag Sys Tech. 1989;1:169–86. [Google Scholar]
- Gunter DL, editor. The fundamentals of PET and SPECT. London: Elsevier Academic Press; 2004. [Google Scholar]
- Hachamovitch R, Berman DS, Kiat H, Cohen I, Friedman JD, Shaw LJ. Value of stress myocardial perfusion single photon emission computed tomography in patients with normal resting electrocardiograms: an evaluation of incremental prognostic value and cost-effectiveness. Circulation. 2002;105:823–9. doi: 10.1161/hc0702.103973. [DOI] [PubMed] [Google Scholar]
- Hatada K, Ruiz M, Riou LM, Lima RL, Goode AR, Watson DD, Beller GA, Glover DK. Organ biodistribution and myocardial uptake, washout, and redistribution kinetics of Tc-99m N-DBODC5 when injected during vasodilator stress in canine models of coronary stenoses. J Nucl Cardiol. 2006;13:779–90. doi: 10.1016/j.nuclcard.2006.08.016. [DOI] [PubMed] [Google Scholar]
- Havelin RJ, Miller BW, Barrett HH, Furenlid LR, Murphy JM, Dwyer RM, Foley MJ. Design and performance of a small-animal imaging system using synthetic collimation. Phys Med Biol. 2013;58:3397–412. doi: 10.1088/0031-9155/58/10/3397. [DOI] [PMC free article] [PubMed] [Google Scholar]
- Henzlova M, Cerquiera M, Mahmarian J. Stress protocols and tracers. J Nucl Caridol. 2006;13:80–90. doi: 10.1016/j.nuclcard.2006.08.011. [DOI] [PubMed] [Google Scholar]
- Holly T, Abbott B, Al-Mallah M, Calnon D, Cohen M, Difilippo F, Ficaro E, Freeman M, Hendel R, Jain D, Leonard S, Nichols K, Polk D, Soman P. Myocardial perfusion and function: single photon emission computer tomography. J Nucl Cardio. 2007;14:39–60. doi: 10.1007/s12350-010-9246-y. [DOI] [PubMed] [Google Scholar]
- Hu J, Boutchko R, Sitek A, Reutter BW, Huesman RH, Gulberg GT. Dynamic molecular maging of cardiac innervation using a dual head pinhole SPECT system. LBNL REport Number LBNL-60008 2008 [Google Scholar]
- Hudson HM, Larkin RS. Accelerated image reconstruction using ordered subsets of projection data. IEEE Trans Med Imaging. 1994;13:601–9. doi: 10.1109/42.363108. [DOI] [PubMed] [Google Scholar]
- IMV Medical Information Division I. 2008 Nuclear Medicine Market Summary Report. 2008 [Google Scholar]
- Ishizu K, Mukai T, Yonekura Y, Pagani M, Fujita T, Magata Y, Nishizawa S, Tamaki N, Shibasaki H, Konishi J. Ultra-high resolution SPECT system using four pinhole collimators for small animal studies. J Nucl Med. 1995;36:2282–7. [PubMed] [Google Scholar]
- Jaszcazk RJ, Li J, Wang H, Zalutsky MR, Coleman RE. Pinhole collimation for ultra-high resolution, small-field-of-view SPECT. Phys Med Biol. 1993;39:425–37. doi: 10.1088/0031-9155/39/3/010. [DOI] [PubMed] [Google Scholar]
- Metzler SD, Accorsi R. Resolution- versus sensitivity-effective diameter in pinhole collimation: experimental verification. Phys Med Biol. 2005;21:5005–17. doi: 10.1088/0031-9155/50/21/004. [DOI] [PubMed] [Google Scholar]
- Metzler SD, Bowsher JE, Smith MF, Jaszczak RJ. Analytic determination of pinhole collimator sensitivity with penetration. IEEE Trans Med Imaging. 2001;20:730–41. doi: 10.1109/42.938241. [DOI] [PubMed] [Google Scholar]
- Min JK, Gilmore A, Budoff MJ, Berman DS, O'Day K. Cost-effectiveness of coronary CT ngiography versus myocardial perfusion SPECT for evaluation of patients with chest pain and no known coronary artery disease. Radiology. 2010;254:801–8. doi: 10.1148/radiol.09090349. [DOI] [PubMed] [Google Scholar]
- Mok GS, Wang Y, Tsui BM. Quantification of the Multiplexing Effects in Multi-Pinhole Small Animal SPECT: A Simulation Study. IEEE Trans Nucl Sci. 2009;56:2636–43. doi: 10.1109/TNS.2009.2023444. [DOI] [PMC free article] [PubMed] [Google Scholar]
- Morris ED, Endres CJ, Schmidt KC, Christian BT, Muzic RF Jr, Fisher RE, editors. The Fundamentals of PET and SPECT. London: Elsevier Academic Press; 2004. [Google Scholar]
- Myers KJ, Barrett HH. Addition of a channel mechanism to the ideal-observer model. J Opt Soc Am A. 1987;4:2447–57. doi: 10.1364/josaa.4.002447. [DOI] [PubMed] [Google Scholar]
- Nuyts J. On estimating the variance of smoothed MLEM images. IEEE Trans Nucl Sci. 2002;49:714–21. [Google Scholar]
- Nuyts J, Fessler JA. A penalized-likelihood image reconstruction method for emission tomography, compared to postsmoothed maximum-likelihood with matched spatial resolution. IEEE Trans Med Imaging. 2003;22:1042–52. doi: 10.1109/TMI.2003.816960. [DOI] [PubMed] [Google Scholar]
- Nuyts J, Vunckx K, Defrise M, Vanhove C. Small animal imaging with multi-pinhole SPECT. Methods. 2009;48:83–91. doi: 10.1016/j.ymeth.2009.03.015. [DOI] [PubMed] [Google Scholar]
- Qi J, Leahy RM. A theoretical study of the contrast recovery and variance of MAP reconstructions from PET data. IEEE Trans Med Imaging. 1999;18:293–305. doi: 10.1109/42.768839. [DOI] [PubMed] [Google Scholar]
- Schmidlin P, Bellemann M, Brix G. Subsets and overrelaxation in iterative image reconstruction. Phys Med Biol. 1999;44:1385–96. doi: 10.1088/0031-9155/44/5/321. [DOI] [PubMed] [Google Scholar]
- Seagars WP, Lalush DS, Tsui BMW. Modeling respiratory mechanics in the MCAT and spline-based MCAT and spline-based MCAT phantoms. IEEE Trans Nucl Sci. 2001;48:89–97. [Google Scholar]
- Shepp LA, Vardi Y. Maximum likelihood reconstruction for emission tomography. IEEE Trans Med Imaging. 1982;1:113–22. doi: 10.1109/TMI.1982.4307558. [DOI] [PubMed] [Google Scholar]
- Shokouhi S, Wilson DW, Metzler SD, Peterson TE. Evaluation of image reconstruction for mouse brain imaging with synthetic collimation from highly multiplexed SiliSPECT projections. Phys Med Biol. 2010;55:5151–68. doi: 10.1088/0031-9155/55/17/017. [DOI] [PMC free article] [PubMed] [Google Scholar]
- Strauss H, Miller D, Wittry M. Procedure Guideline for Myocardial Perfusion Imaging. J Nucl Med. 2008;36:155–161. doi: 10.2967/jnmt.108.056465. [DOI] [PubMed] [Google Scholar]
- Sturner SJ. MGEANT-A GEANT-based multi-purpose simulation package for gamma-ray astronomy missions. Proc Fifth Comp Symp. 2000:818–24. [Google Scholar]
- Tsui B, Lalush D. Performance of Ordered-Subset Reconstruction Algorithms Under Conditions of Extreme Attenuation and Truncation in Myocardial SPECT. J Nucl Med. 2000;41:737–744. [PubMed] [Google Scholar]
- Uren NG, Melin JA, De Bruyne B, Wijns W, Baudhuin T, Camici PG. Relation between myocardial blood flow and the severity of coronary-artery stenosis. N Engl J Med. 1994;330:1782–8. doi: 10.1056/NEJM199406233302503. [DOI] [PubMed] [Google Scholar]
- van der Have F, Vastenhouw B, Ramakers RM, Branderhorst W, Krah JO, Ji C, Staelens SG, Beekman FJ. U-SPECT-II: An Ultra-High-Resolution Device for Molecular Small-Animal Imaging. J Nucl Med. 2009;50:599–605. doi: 10.2967/jnumed.108.056606. [DOI] [PubMed] [Google Scholar]
- Vogel RA, Kirch D, LeFree M, Steele P. A new method of multiplanar emission tomography using a seven pinhole collimator and an Anger scintillation camera. J Nucl Med. 1978;19:648–54. [PubMed] [Google Scholar]
- Vunckx K, Beque D, Defrise M, Nuyts J. Single and multipinhole collimator design evaluation method for small animal SPECT. IEEE Trans Med Imaging. 2008;27:36–46. doi: 10.1109/TMI.2007.902802. [DOI] [PubMed] [Google Scholar]
- Vunckx K, Suetens P, Nuyts J. Effect of overlapping projections on reconstruction image quality in multipinhole SPECT. IEEE Trans Med Imaging. 2008;27:972–83. doi: 10.1109/TMI.2008.922700. [DOI] [PubMed] [Google Scholar]
- WHO. Top 10 causes of death. 2008 [online] Available at: http://who.int/mediacentre/factsheets/fs310/en/index.html.
- Wilson DW, Tsui BM, Barrett HH. Noise properties of the EM algorithm: II. Monte Carlo simulations. Phys Med Biol. 1994;39:847–71. doi: 10.1088/0031-9155/39/5/005. [DOI] [PubMed] [Google Scholar]
- Yoshinaga K, Chow BJ, Williams K, Chen L, deKemp RA, Garrard L, Lok-Tin Szeto A, Aung M, Davies RA, Ruddy TD, Beanlands RS. What is the prognostic value of myocardial perfusion imaging using rubidium-82 positron emission tomography? J Am Coll Cardiol. 2006;48:1029–39. doi: 10.1016/j.jacc.2006.06.025. [DOI] [PubMed] [Google Scholar]
- Zeng GL, Gullberg GT, Tsui BMW, Terry JA. Three-dimensional iterative reconstruction algorithms with attenuation and geometric point response correction. IEEE Trans Nucl Sci. 1991;38:693–702. [Google Scholar]


