INTRODUCTION
Central corneal thickness (CCT) has been identified as a strong predictor for the development of primary open angle glaucoma (POAG) and shown to be associated with severity of the disease.1,2, 3 Recently, it has been suggested that understanding the biomechanical properties of the cornea other than CCT might lead to improvements in the diagnosis and management of glaucoma.4, 5,6 Parameters such as elasticity and viscous properties may also influence corneal resistance to applanation and, therefore, IOP measurements obtained by Goldmann Applanation Tonometry (GAT).4, 5 Further, there is speculation that corneal biomechanical properties could reflect structural vulnerabilities of the globe that predispose it to the development of glaucoma.7 A model of eye-wall stress, incorporating CCT, axial length, and IOP, has previously been shown be able to predict progression to glaucoma.8 Clinical measurements of biomechanical parameters of the cornea were facilitated by the advent of the Ocular Response Analyzer (ORA, Reichert Ophthalmic Instruments Inc, Buffalo, NY, USA).9 The ORA measures the corneal hysteresis (CH) and the corneal resistance factor (CRF) by analyzing the responses of the cornea when submitted to air jet-induced deformation.
Previous studies have shown that CH and CRF are significantly reduced in glaucoma patients compared to normal subjects. Further, they appear to be risk factors for glaucoma progression independent of CCT. 6, 7, 10–12 In addition, it was observed recently that CH, but not CCT, is associated with optic disc surface deformation induced by acute IOP rise.7 In this study, it was concluded that corneal biomechanics are related to distensibility of the optic nerve complex, itself serving as a surrogate for the risk of or probability of glaucoma pathogenesis.
All these studies, however, only studied the relationship between corneal properties and functional measures of glaucoma. The aim of the current study was to investigate whether there is an association between corneal biomechanical parameters and the severity of glaucoma as defined by the visual field and retinal nerve fiber layer (RNFL) thickness using both SDOCT and GDx measurements13, 14.
METHODS
This was an observational cross-sectional study. Subjects included were part of the longitudinal Diagnostic Innovations in Glaucoma Study (DIGS) conducted at the Hamilton Glaucoma Center, University of California, San Diego.
Each participant underwent a complete ophthalmologic examination, including visual acuity assessment, slit-lamp biomicroscopy, gonioscopy, dilated fundoscopic examination using 78-diopter (D) lens, stereoscopic disc photography, and standard automated perimetry using the 24-2 Swedish Interactive Threshold Algorithm (SAP-SITA; Carl Zeiss Meditec, Inc, Dublin, California, USA). Central corneal thickness (CCT) was measured using an ultrasound pachymeter (Pachette DGH 500; DGH Technology, Inc, Philadelphia, Pennsylvania, USA) over an undilated pupil and the mean of 3 readings was recorded. Corneal curvature was obtained using an autorefractor (Humphrey - Zeiss model S97; Carl-Zeiss Meditec). Axial length was acquired with the IOLMaster (Carl-Zeiss Meditec). To study the influence of corneal biomechanical parameters as measured by the ORA on the visual field and RNFL thickness, we included eyes suspected of having the disease as well as those with confirmed glaucoma. Fellow eyes were excluded if any of the following criteria were met: 1) quality of ORA, visual field, SDOCT and/or GdX examinations did not meet minimum quality criteria (see below) or 2) were diagnosed as “normal”.
Ocular Response Analyser
Participants underwent testing with the Ocular Response Analyzer (software version 2.02, ORA, Reichert Ophthalmic Instruments, Depew, NY, USA). Only readings with a waveform score (WS) of ≥7 in a software-generated scale of 0 to 10 were included in data analysis. At least two measurements were obtained per eye and the one with the highest quality WS was retained for the analysis. Briefly, the ORA uses an applied force-displacement relationship by delivering a collimated air pulse on the cornea. The difference between the inward and outward motion applanation pressures (P1 and P2, respectively) owing to the delivered air jet is called corneal hysteresis (CH), and this is measured in millimeters of mercury (mm Hg). CH is assumed to reflect the viscous properties of the cornea as well as its dampening and energy absorption capacity. The ORA also provides the corneal resistance factor (CRF), which seems to be an indication of the overall “resistance” or elasticity of the cornea. It is derived from the formula (P1 - kP2), where k is a constant determined from an empirical analysis of the relationship between both P1 and P2 in studies evaluating eyes that underwent corneal change induced by laser in situ keratomileusis (LASIK).9 The device also provides a Goldmann-correlated intraocular pressure (IOP) measurement (IOPg) (average of P1 and P2) and a corneal-compensated intraocular pressure (IOPcc). IOPcc is considered to be less affected by corneal properties such as the central corneal thickness (CCT).
Standard Automated Perimetry
To be classified as glaucomatous, patients had to have at least two consecutive, reliable (fixation losses and false negatives ≤ 33%, and < 15% false positives) and repeatable abnormal standard automated perimetry (SAP) tests using the 24-2 Swedish Interactive Threshold Algorithm with either a pattern standard deviation (PSD) outside the 95% normal limits or a glaucoma hemifield test (GHT) result outside the 99% normal limits. Patients considered suspect for glaucoma had either an IOP > 21 mmHg, and/or glaucomatous optic disc damage based on standardized asessment of simultaneous stereohotographs by two experienced graders with a minimum of two reliable SAP visual fields without evidence of repeatable visual field damage. The Visual Field Assessment Center (VisFACT) reviewed all visual fields and checked for the presence of artifacts such as lid and rim artifacts, fatigue effects, inattention or inappropriate fixation.15
Retinal Nerve Fiber Layer Thickness Measurements
Thickness of the RNFL was measured with the GDx enhanced corneal compensation (ECC) (Carl Zeiss Meditec, Dublin, California, USA) and the Spectralis spectral domain optical coherence tomography (SDOCT) (Heidelberg Engineering, Heidelberg, Germany). When there were multiple images during the same visit, the one with the highest quality scores was chosen for statistical analysis. Measurements with SAP, GDxECC, SDOCT and ORA were taken within 6 months of each other. Since most participants had either SDOCT or GDxECC scans, we divided them into a SDOCT and a GDxECC subgroup.
Patients were imaged using a commercially available scanning laser polarimeter with enhanced corneal compensation (GDx ECC; Carl-Zeiss Meditec, Inc). The general principles of scanning laser polarimetry and the algorithms used for enhanced corneal compensation have been described in detail elsewhere.16 An experienced examiner masked to the subject’s identity and results of the other tests assessed the quality of the GDx images. A good quality image required a focused and evenly illuminated reflectance image with a centered optic disc. The image quality score had to be greater than or equal to 7 and the typical scan score (TSS) grater or equal to 80. RNFL retardation measurements were obtained on a 3.2-mm-diameter calculation circle around the optic nerve head. The GDx provides measurements of RNFL retardation, which are converted to estimated RNFL thickness using a fixed conversion factor.
The Spectralis OCT (Spectralis HRA+OCT; software version 5.3.0.0) device uses a dual-beam SD-OCT and a confocal laser scanning ophthalmoscope that works by emitting a superluminescent diode light with a center wavelength of 870 nm and an infrared scan to simultaneously provide images of ocular microstructures. The Spectralis OCT device incorporates a real-time eye tracking system that couples confocal laser scanning ophthalmoscope and SD-OCT scanners to adjust for eye movements and to ensure that the same location of the retina is scanned over time. The protocol used was the RNFL circle scan, which consists of 1024 A-scan points from a 3.45-mm circle centered on the optic disc. All patients had their corneal curvature inputted into the machine before the examination. The examiner is required to manually place the scan around the optic disc. The acquisition rate of the device is 40 000 a-scans per second at an axial resolution of 3.9 μm. The instrument includes scan averaging to reduce noise, thus increasing the effective acquisition time. To be included, all images were reviewed for non-centered scans and had to have a signal strength >15 dB. The images were reviewed by the Information and Data Evaluation Analysis (IDEA) reading center, based at the University of California, San Diego.
Statistical analysis
Data are presented as means and standard deviations (SD). Initially, the associations between variables were evaluated using scatterplots and locally weighted scatterplott smoothing (LOWESS). A linear regression modeling technique was used to study the effect of biomechanical properties of the cornea (CCT, CRF and CH) on visual field mean defect (MD), pattern standard deviation (PSD), and RNFL thickness measurements. Initially, univariable regression models were fitted with MD, PSD, or average RNFL thickness (for the SDOCT and GDxECC groups) as dependent variables and CH as independent variable. Similar models were built with CRF as independent variable. Subsequently, multivariable models were built to evaluate the effect of corneal biomechanical properties on visual field indices and RNFL thickness while adjusting for other parameters such as age, CCT, and axial length. As measurements from both eyes of the same individual are likely to correlate, the use of standard statistical methods for parameter estimation can lead to underestimation of standard errors and to confidence intervals that are too narrow. Therefore to account for the fact that both eyes of some patients were included in the analyses, generalized estimating equations (GEE) with robust standard errors (Huber-White sandwich variance estimator) were used to adjust for these potential correlations.
All tests were 2-sided and a P-value less than 0.05 was considered statistically significant. Statistical analyses were performed using Stata 10.0 (StataCorp, College Station, TX)
RESULTS
This study included a total 299 eyes of 191 participants (151 suspect and 148 glaucoma eyes), of which 146 eyes of 92 participants had undergone SDOCT imaging (84 suspect and 62 glaucoma eyes) and 204 eyes of 142 participants had GDxECC imaging (98 suspect and 106 glaucoma eyes). The mean age of the participants was 68.1 years (SD: 11.0 years; range 30–91 years). Of these, 182 (60.8%) were female. Forty-three individuals (51 eyes) participated in both subgroups. There was no significant difference in their demographic characteristics from the rest of study population. Demographic and clinical characteristics are compared in Table 1.
Table 1.
Association between Corneal Biomechanical Properties and Glaucoma Severity. Demographic and Ocular Characteristics (Mean ± Standard Deviation) for the Visual Field Group and the two Structural Sub-groups by Glaucoma Diagnosis.
| Variable | Visual field-group | SDOCT-subgroup | GDxECC-subgroup | ||||||||
|---|---|---|---|---|---|---|---|---|---|---|---|
|
| |||||||||||
| Suspect Glaucoma (n=151 eyes) | Established Glaucoma (n=148 eyes) | P value | Suspect Glaucoma (n=84 eyes) | Established Glaucoma (n=62 eyes) | P value | Suspect Glaucoma (n= 98 eyes) | Established Glaucoma (n= 106 eyes) | P value | |||
| Age (years) | 65.5 ± 11.4 | 70.9 ± 9.9 | <0.01 | 65.4 ± 10.9 | 71.8 ± 8.1 | <0.01 | 64.9 ± 11.9 | 70.5 ± 10.7 | <0.01 | ||
| Sex (female) | 100 (66%) | 82 (55%) | 0.18 | 55(65%) | 35 (56%) | 0.55 | 58 (59%) | 58 (55%) | 0.56 | ||
| Ancestry (African-Descent) | 31 (20%) | 56 (37%) | 0.04 | 22 (26%) | 25 (40%) | 0.04 | 12(12%) | 37 (35%) | <0.01 | ||
| MD (dB) | −0.38 ± 1.6 | −3.3 ± 3.3 | <0.01 | −0.4 ± 1.3 | −3.8 ± 3.5 | <0.01 | −0.3 ± 1.8 | −3.0 ± 3.3 | <0.01 | ||
| PSD (dB) | 1.6 ± 0.9 | 4.0 ± 3.0 | <0.01 | 1.5 ± 0.3 | 4.5 ± 3.1 | <0.01 | 1.7 ± 1.2 | 3.8 ± 2.9 | <0.01 | ||
| CCT (μm) | 561.9 ± 41.9 | 546.1 ± 39.9 | <0.01 | 557.3 ± 39.1 | 539.6 ± 42.2 | <0.01 | 567.2 ± 43.6 | 545.9 ± 38.7 | <0.01 | ||
| AL (mm) | 23.9 ± 1.2 | 23.9 ± 1.2 | 0.88 | 24.0 ± 1.2 | 23.8 ± 1.0 | 0.27 | 24.2 ± 1.3 | 23.9 ± 1.3 | 0.26 | ||
| Average RNFL thickness | - | - | - | 92.8 ± 11.5 | 82.5 ± 16.4 | <0.01 | 48.4 ± 5.2 | 45.0 ± 7.7 | <0.01 | ||
| ORA parameters | |||||||||||
| CH (mmHg) | 10.4 ± 1.7 | 9.4 ± 1.7 | <0.01 | 10.1 ± 1.7 | 9.2 ± 1.7 | <0.01 | 10.6 ± 1.7 | 9.4 ± 1.7 | <0.01 | ||
| CRF (mmHg) | 10.7 ± 2.1 | 9.4 ± 2.0 | <0.01 | 10.5 ± 2.0 | 8.9 ± 2.1 | <0.01 | 10.8 ± 2.2 | 9.5 ± 2.0 | <0.01 | ||
| IOPg (mmHg) | 16.6 ± 4.5 | 15.0 ± 5.6 | <0.01 | 16.6 ± 4.7 | 13.7 ± 5.9 | <0.01 | 16.3 ± 4.3 | 15.3 ± 5.3 | 0.11 | ||
| IOPcc (mmHg) | 16.9 ± 4.1 | 16.6 ± 5.4 | 0.22 | 17.3 ± 4.4 | 15.7 ± 5.8 | 0.14 | 16.5 ± 3.7 | 16.9 ± 5.1 | 0.55 | ||
Abbreviations: AL = axial length; CCT = central corneal thickness; CH = corneal hysteresis; CRF = corneal resistance factor; dB = decibel; GAT = Goldmann Applanation Tonometry; IOPcc = corneal-compensated intraocular pressure; IOPg = intraocular pressure equivalent to Goldmann; ORA = Ocular Response Analyser.
Figures 1a and b show scatterplots of ORA parameters (CH and CRF) versus visual field MD. The observed relationship was close to linear. There was a significant albeit weak positive correlation between CH and MD (R2 = 0.03; P < 0.001) as well as PSD (R2 = 0.01; P < 0. 02). Similar correlations were found between CRF and MD (R2= 0.1; P < 0.001) and CRF and PSD (R2= 0.1; P < 0.001). Figures 1a and 1b show scatterplots between ORA parameters and MD. CCT was also positively associated with MD and PSD (R2 = 0.06; P < 0.01 and R2 = 0.04; P < 0.01, respectively). Men had lower mean CH (9.6 vs. 10.1 mmHg) and CRF (9.8 vs. 10.2 mmHg) than women although these differences were not statistically significant. A negative correlation was found between age and CH (R2 = 0.09; P < 0.01) and CRF (R2 = 0.09; P < 0.01). This relationship was equally strong for both genders. In multivariable regression models adjusting for CCT, age, and axial length, the relationship between CRF and both visual field indices remained statistically significant (P < 0.01 for both MD and PSD) while the association between CH and visual field indices did not (P = 0.78 for MD and P = 0.60 for PSD) (Table 2). CCT was significantly related to PSD and MD in the multivariable models that included CH.
Figure 1. Association of corneal hysteresis and corneal resistance factor and visual field.
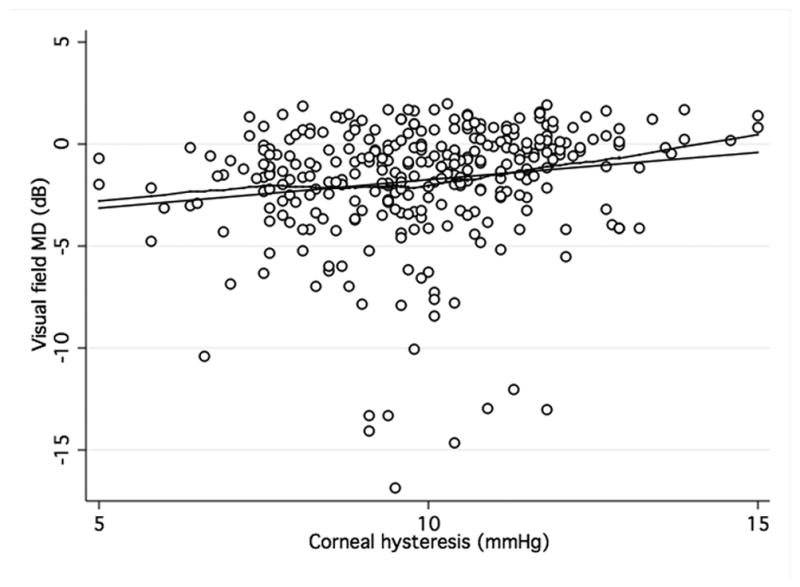
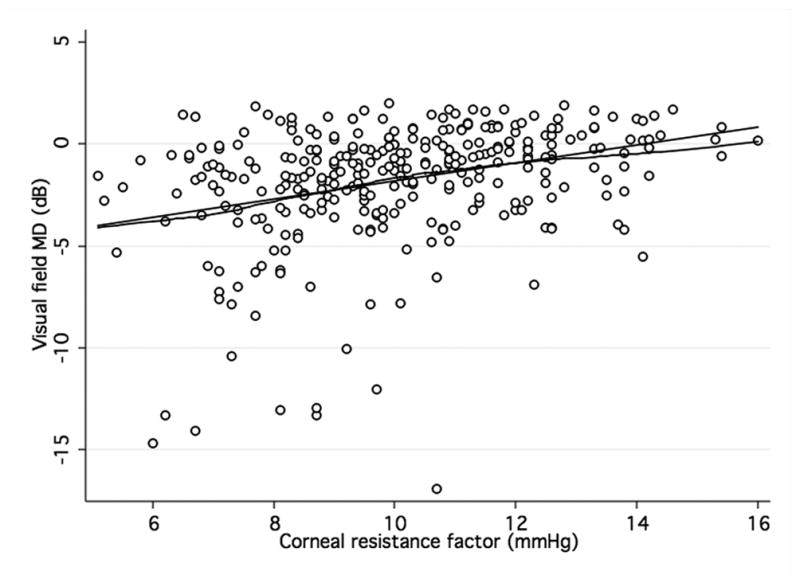
Scatterplots with locally weighted smoothing (LOWESS) of corneal hysteresis (CH) (a) and corneal resistance factor (CRF) (b), as measured by the Ocular Response Analyser, and visual field mean defect (MD).
Table 2.
Association between corneal hysteresis, corneal resistance factor and visual field indices MD and PSD (dependent variables) in a multivariable regression model with other ocular and demographic variables.
| Dependent variable | Independent variable | Coefficient (RSE) | P Value |
|---|---|---|---|
| MD | CH (mm Hg) | 0.03 (0.10) | 0.78 |
| Age (year) | −0.03 (0.01) | 0.04 | |
| CCT (μm) | 0.02 (0.01) | <0.01 | |
| Axial length (mm) | −0.01 (0.12) | 0.97 | |
|
| |||
| CRF (mm Hg) | 0.34 (0.11) | <0.01 | |
| Age (year) | −0.02 (0.01) | 0.24 | |
| CCT (μm) | 0.01 (0.01) | 0.23 | |
| Axial length (mm) | 0.07 (0.17) | 0.72 | |
|
| |||
| PSD | CH (mm Hg) | −0.05 (0.10) | 0.60 |
| Age (year) | 0.01 (0.01) | 0.60 | |
| CCT (μm) | −0.01 (0.01) | 0.02 | |
| Axial length (mm) | −0.10 (0.17) | 0.54 | |
|
| |||
| CRF (mm Hg) | −0.38 (0.11) | <0.01 | |
| Age (year) | −0.01 (0.01) | 0.54 | |
| CCT (μm) | −0.01 (0.00) | <0.97 | |
| Axial length (mm) | −0.18 (0.16) | 0.27 | |
Abbreviations: CH = Corneal hysteresis; CCT = Central corneal thickness; RNFL = Retinal Nerve Fiber Layer; RSE = Robust standard error
When analyzing the relationship between ORA and structural parameters, there was a significant, although weak, positive association between both CH and CRF and average RNFL thickness (R2 = 0.07; P < 0.001 and R2 = 0.05; P < 0.001, respectively) in the GDxECC group. This positive correlation with CH and CRH, however, was weaker in the SDOCT group (R2 = 0.01; P = 0.06 and R2 = 0.01; P = 0.21, respectively) and did not reach statistical significance. These observations are illustrated by figures 2 and 3 that show scatterplots of ORA parameters (CH and CRF) versus average RNFL thickness. A significant correlation of CCT with both CH (R2 = 0.23, P < 0.01) and CRF (R2 = 0.32, P < 0.01) was observed, with lower CH measurements in eyes with thinner central corneas. In multivariable regression models adjusting for CCT, age, and axial length, the relationship between CH and RNFL thickness was weaker and no longer statistically significant both on SDOCT (P = 0.74) (Table 3) and on GDxECC measurements (P = 0.13) (Table 4). Similarly, the association between CRF and average RNFL thickness became not significant (P = 0.40 [SDOCT] and (P = 0.56 [GDxECC]) in multivariable analysis.
Figure 2. Association of corneal hysteresis and corneal resistance factor and SDOCT.
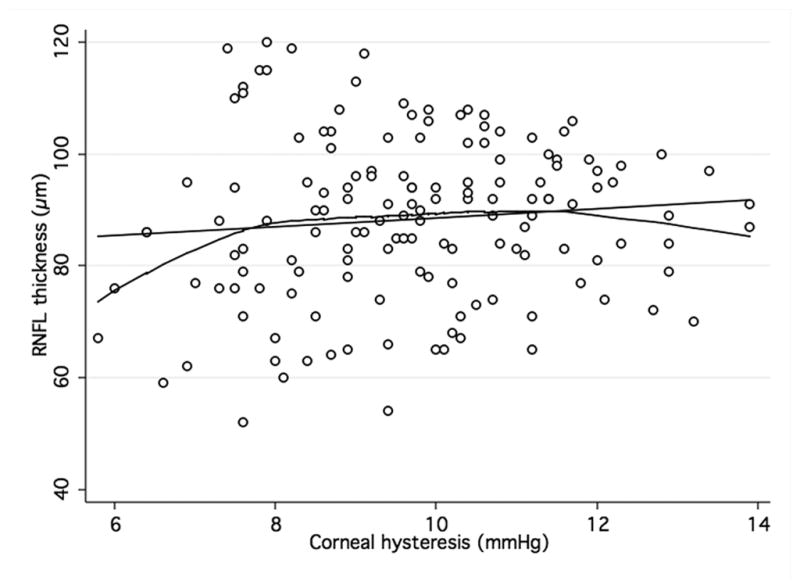
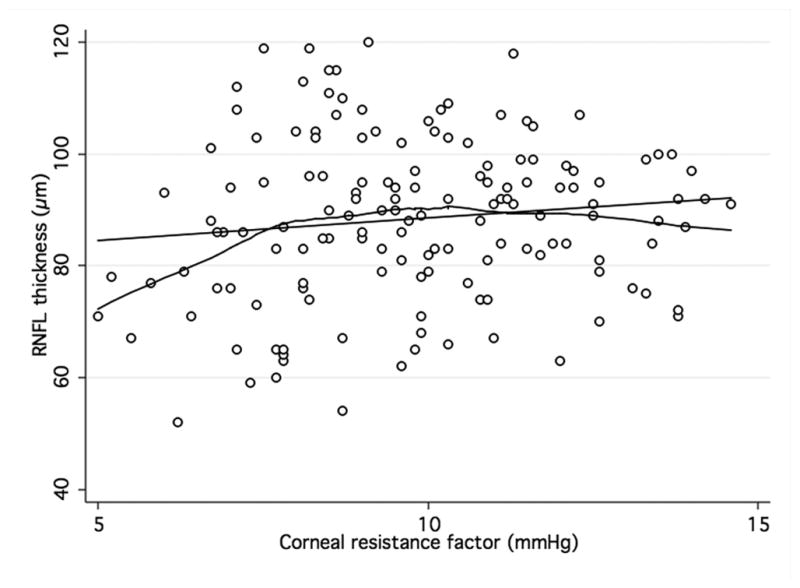
Scatterplots with locally weighted smoothing (LOWESS) of corneal hysteresis (CH) (a) and corneal resistance factor (CRF) (b), as measured by the Ocular Response Analyser, and average RNFL thickness, as measured by SDOCT.
Figure 3. Association of corneal hysteresis and corneal resistance factor and GDxECC.
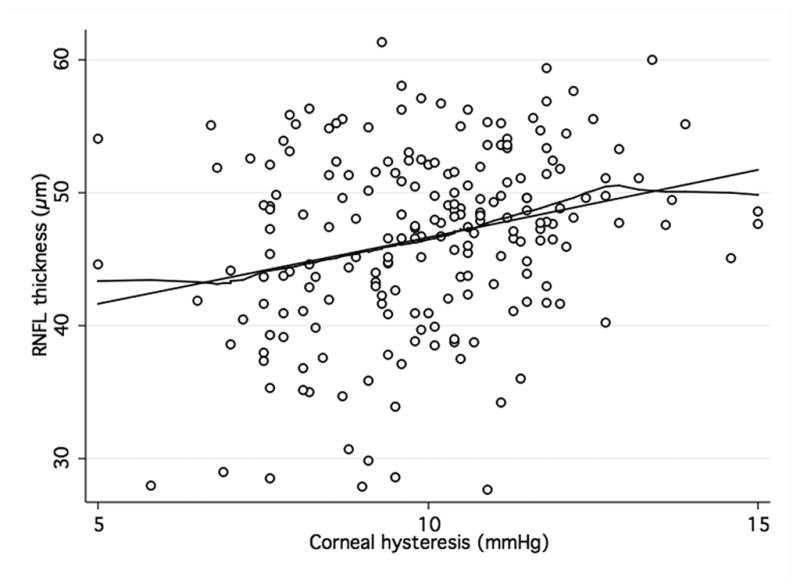
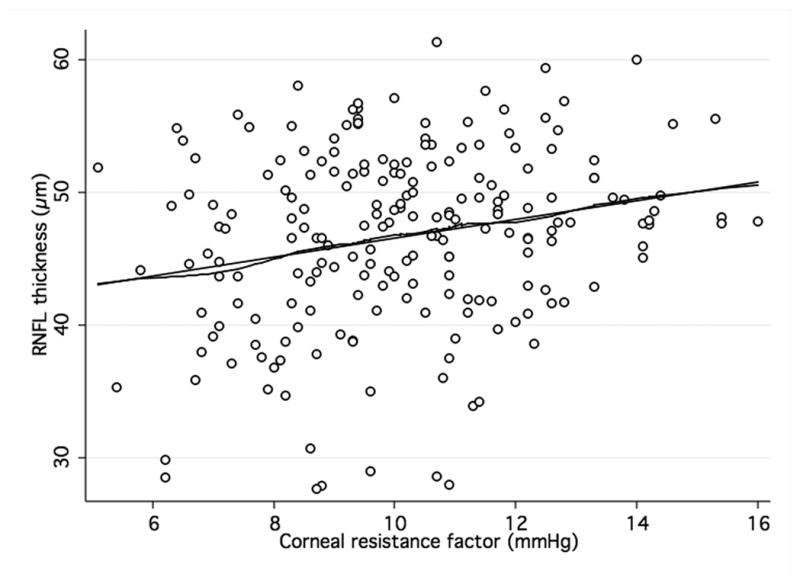
Scatterplots with locally weighted smoothing (LOWESS) of corneal hysteresis (CH) (a) and corneal resistance factor (CRF) (b), as measured by the Ocular Response Analyser, and average RNFL thickness, as measured by GDxECC.
Table 3.
SDOCT-Group. Association between corneal biomechanical parameters (corneal hysteresis and corneal resistance factor) and retinal nerve fiber layer thickness (dependent variable) in a multivariable regression model with other ocular and demographic variables.
| Average RNFL thickness | Coefficient (RSE) | P Value |
|---|---|---|
| CH (mm Hg) | 0.33 (1.0) | 0.74 |
| Age (year) | −0.33 (0.04) | 0.04 |
| CCT (μm) | −0.02 (0.04) | 0.55 |
| Axial length (mm) | −0.91 (1.39) | 0.52 |
|
| ||
| CRF (mm Hg) | 0.71 (0.82) | 0.40 |
| Age (year) | −0.31 (0.15) | 0.05 |
| CCT (μm) | −0.04 (0.04) | 0.36 |
| Axial length (mm) | −0.78 (1.37) | 0.57 |
Abbreviations: CCT = Central corneal thickness; CH = Corneal hysteresis; CRF = Corneal resistance factor; RNFL = Retinal Nerve Fiber Layer; RSE = Robust standard error
Table 4.
GDxECC-Group. Association between corneal biomechanical parameters (corneal hysteresis and corneal resistance factor) and retinal nerve fiber layer thickness (dependent variable) in a multivariable regression model with other ocular and demographic variables.
| Average RNFL thickness | Coefficient (RSE) | P Value |
|---|---|---|
| CH (mm Hg) | 0.49 (0.32) | 0.13 |
| Age (year) | 0.05 (0.04) | 0.22 |
| CCT (μm) | 0.03 (0.01) | <0.01 |
| Axial length (mm) | 0.24 (0.39) | 0.54 |
|
| ||
| CRF (mm Hg) | 0.17 (0.30) | 0.56 |
| Age (year) | −0.06 (0.04) | 0.14 |
| CCT (μm) | 0.04 (0.01) | <0.01 |
| Axial length (mm) | 0.17 (0.38) | 0.65 |
Abbreviations: CCT = Central corneal thickness; CH = Corneal hysteresis; CRF = Corneal resistance factor; RNFL = Retinal Nerve Fiber Layer; RSE = Robust standard error
DISCUSSION
This study investigates an association between corneal biomechanical properties and glaucoma severity defined by both visual field damage and RNFL thickness. Glaucoma typically manifests functional or structural signs, and there may be significant dissociations between these two measures of change.17, 18 Therefore, optic nerve structure and function should be considered complementary and it is important to evaluate both structural and functional measures as indicators of the stage of disease.
We found that CH and CRF were positively associated with more severe visual field damage in univariable analysis but only CRF remained independently associated with MD and PSD after adjustment for relevant demographic and ocular parameters. It is difficult to explain why there was an association between CRF and visual field indices, but not CH. It may be that CRF is an empirically derived measure of the overall elastic properties of the cornea, while CH is thought to predominantly represent its viscous properties. Our findings would then suggest that elastic properties of the cornea might be more closely related to glaucoma damage, although this association was weak.
These findings appear to be partially in disagreement with Anand and colleagues,12 who, using a cross-sectional design, investigated the association between ORA parameters and visual field asymmetry in 117 patients with primary open angle glaucoma. Using the AGIS score, mean CH and CRF were significantly lower in worse eyes than in better eyes (8.2 ± 1.9 vs. 8.9 ± 1.9 mmHg; P < 0.001 and 8.6 ± 2.0 vs. 8.8 ± 2.1 mmHg, P = 0.04, respectively). The mean difference, however, was small (Δ 0.7 mmHg for CH and Δ0.2 mmHg for CRF). Also, on multivariable analysis, CH but not ΔCH (CH in worse eye – CH in better eye) or CRF retained a weak association with the eye with worse AGIS scores. Moreover, their cross-sectional study, as ours, was not designed to establish causality between ORA parameters and visual field asymmetry in glaucoma. It should be noted, that their range of MD values was wider than ours (average MD of −11.2 dB in the worse eye compared to average −3.3 of in our study), which can explain the likelihood of finding a correlation if it exists. An association between presence of glaucomatous disease and corneal biomechanics is suggested in our study by the fact that glaucoma patients had lower mean CH and CRF values than glaucoma suspects (Table 1). Our findings show that glaucoma severity depends on a multitude of factors with corneal biomechanics being a relatively minor one.
Herndon and colleagues,3 have reported that CCT is a powerful clinical factor related to degree of glaucomatous damage at the initial examination. In a multivariable model, visual field MD improved by 0.34 dB (P = 0.01) for each 10μm increase of CCT. This positive correlation was also found in the present study (MD improved by 0.20 dB for each 10μm increase of CCT), although it was relatively weak (R2 = 0.06; P < 0.01). It is possible that this finding may reflect the recent integration of CCT values in the standard clinical care of glaucoma patients. If patients with lower CCT values are treated more aggressively, the strength of the correlation to visual field indices would diminish. Similar to our study which showed an association between CCT and RNFL thickness, they also included a structural parameter in their analysis and showed that for an increase of 10μm of CCT, the vertical cup-disc-ratio decreased by 0.0088 (P = 0.01). Previously, Chisholm and colleagues,8 had proposed a model for the calculation of eye-wall stress based on IOP, CCT, and axial length, and found a difference between unchanged glaucoma suspects and those later developing glaucoma. When we applied their formula to our cohort, we also found a difference between glaucoma suspects (stress value: 478.0) vs. glaucoma patients (stress value: 482.7), although this difference was not statistically significant (P=0.15). This model, however, was devised before the introduction of the ORA and did not included corneal biomechanical parameters other than CCT.
Congdon and colleagues,6 also investigated the effect of corneal biomechanical parameters on disease severity. Among 194 glaucoma patients, they found that lower corneal hysteresis and axial length, independently of CCT, were associated with progressive visual field worsening. However, similar to our study, when axial length was included in a multivariable model, the effect of CH became not significant. Of interest, the authors did not report CRF values. In our study, there was no statistically significant relationship between axial length and visual field loss in a multivariable model. It is noteworthy that our sample did not include myopia higher than 3 diopters and mean axial length was 23.9 ± 1.2 mm (range, 17.9 to 27.5 mm). Congdon and co-workers did not, however, report the distribution of axial length values in their study. It is possible that the range of axial length in our study may have been narrower than in Congdon and co-workers, which may explain the current studies’ lack of association between axial length and visual field. There is evidence that higher axial length, as seen in high myopia, is associated with histologically thinner lamina cribrosa.19
In recent years, with the introduction of highly sensitive and reproducible imaging technologies, the thickness of RNFL has been proposed as a marker for glaucoma severity and progression.13,14 In the current study, a weak correlation between CH and CRF and average RNFL thickness in the GDxECC, but not the SDOCT group, was found in univariable analysis. This correlation, however, became weaker and statistically not significant after adjusting for relevant ocular and demographic factors. These findings suggest that CH and CRF, two parameters defined by the ORA to reflect corneal biomechanical properties, have no independent association with RNFL thickness.
Wells and colleagues,7 in an experimental setting, suggested a possible association between CH and optic disc topography. Using a suction cup, they induced artificial elevation of IOP in 38 glaucoma patients and 62 healthy normals and showed that lower CH values correlated to greater optic nerve head deformation in the glaucoma group. The authors speculated that the amount of deepening of the optic cup, indicating less compliance of the lamina cribrosa, might provide further information about glaucoma risk. Similarly, Lesk and colleagues,20 found that in POAG and ocular hypertensives (OHT) patients, lower CCT was associated with increased displacement of the optic disc cup, assumed to be a surrogate for lamina cribrosa displacement.
Having defined glaucoma severity by functional and structural parameters is one strength of the current study. Another strength is the relatively large sample size compared to other published studies that have investigated the association between ORA parameters and measures of glaucoma severity. A limitation of our study is the cross-sectional design. It is therefore not possible to study the contribution of several confounders that are associated with disease severity such as untreated IOP, treatment effect, and duration of disease. Another limitation is that since visual field examinations, RNFL assessment, and ORA examinations were not always obtained in the same day, changes in the interval between the different examinations may have affected the results. However, all measurements were taken within 6 months of each other in order to minimize this possibility. Also, our analysis was based on single daytime ORA measurements and does not take nocturnal and diurnal variability into account. Such a variation, however, was reported to be minimal and should not have influenced our findings.21 Perhaps another limitation is the range of visual field damage as only ten eyes had MD values worse than −10 dB. This could have limited our ability to detect significant associations between corneal biomechanical parameters and visual field loss. It is also possible that differences in medical or surgical treatment may have affected measures of CH and CRF. However, in this “real-life” clinical trial,22 management changes of glaucoma patients were at the physician’s discretion. With patients often having multiple treatments combinations, it would be hard if not impossible to attribute any association to a single treatment modality. The issue of adherence to medication, which was not assessed in his study, further makes such an analysis inconclusive.
In conclusion, our study found only a weak relationship between corneal biomechanical parameters and measures of structural and functional damage in glaucoma. Prospective longitudinal studies are needed to investigate the relationship between corneal biomechanics and long-term risk of glaucoma progression.
Acknowledgments
Financial support: National Eye Institute grant (NEI), Bethesda, MD, EY11008 (LMZ), NEI EY08208 (FAM), EY14267 (LMZ), Velux Foundation, Zuerich, Switzerland (KM), CAPES Ministry of Education of Brazil grant BEX1327/09-7, Brasilia, Brasil, (MTL), and participant retention incentive grants in the form of glaucoma medication at no cost from Alcon Laboratories Inc, Forth Worth, TX; Allergan, Irvine, CA; Pfizer Inc, NY, NY; and Santen Inc., Osaka, Japan.
Financial disclosures: K Mansouri, none; MT Leite, none; FA Medeiros, Research and financial support from Carl Zeiss Meditec, Inc., Pfizer, Inc. Reichert, Inc., Depew, NY; A Tafreshi, none; RN Weinreb, Research and financial support from Carl Zeiss Meditec, Inc., Dublin, CA; Heidelberg Engineering, GmbH, Heidelberg, Germany; Optovue, Inc., Fremont, CA; Topcon Medical Systems, Inc., Livermore, CA; Nidek, Aichi, Japan; LM Zangwill, Research support from Heidelberg Engineering, Optovue, Topcon Medical Systems, Zeiss Meditec Inc, and Travel support: Heidelberg Engineering.
Footnotes
Contributions of Authors: Design of the study (KM, FAM); Conduct of the study (KM, MTL, FAM, AT, LMZ); Statistical expertise (KM, MTL, FAM); Writing the article (KM); Critical revision of the article and final approval (KM, MTL, FAM, AT, LMZ, RNW); Provision of materials, patients, or resources (FAM, LMZ, RNW).
Statement about Conformity with Author Information: University of California, San Diego Human Research Protections Program.
Informed consent was obtained from each participant and the University of California San Diego Human Subjects Committee approved all methodology. All methods adhered to the Declaration of Helsinki for research involving human subjects. This clinical trial is registered at www.clinicaltrials.gov (number NCT 00221897)
References
- 1.Gordon MO, Beiser JA, Brandt JD, et al. The Ocular Hypertension Treatment Study: baseline factors that predict the onset of primary open-angle glaucoma. Arch Ophthalmol. 2002;120(6):714–20. doi: 10.1001/archopht.120.6.714. discussion 829–30. [DOI] [PubMed] [Google Scholar]
- 2.Leske MC, Heijl A, Hyman L, et al. Predictors of long-term progression in the early manifest glaucoma trial. Ophthalmology. 2007;114(11):1965–72. doi: 10.1016/j.ophtha.2007.03.016. [DOI] [PubMed] [Google Scholar]
- 3.Herndon LW, Weizer JS, Stinnett SS. Central corneal thickness as a risk factor for advanced glaucoma damage. Arch Ophthalmol. 2004;122(1):17–21. doi: 10.1001/archopht.122.1.17. [DOI] [PubMed] [Google Scholar]
- 4.Medeiros FA, Weinreb RN. Evaluation of the influence of corneal biomechanical properties on intraocular pressure measurements using the ocular response analyzer. J Glaucoma. 2006;15(5):364–70. doi: 10.1097/01.ijg.0000212268.42606.97. [DOI] [PubMed] [Google Scholar]
- 5.Liu J, Roberts CJ. Influence of corneal biomechanical properties on intraocular pressure measurement: quantitative analysis. J Cataract Refract Surg. 2005;31(1):146–55. doi: 10.1016/j.jcrs.2004.09.031. [DOI] [PubMed] [Google Scholar]
- 6.Congdon NG, Broman AT, Bandeen-Roche K, et al. Central corneal thickness and corneal hysteresis associated with glaucoma damage. Am J Ophthalmol. 2006;141(5):868–75. doi: 10.1016/j.ajo.2005.12.007. [DOI] [PubMed] [Google Scholar]
- 7.Wells AP, Garway-Heath DF, Poostchi A, et al. Corneal hysteresis but not corneal thickness correlates with optic nerve surface compliance in glaucoma patients. Invest Ophthalmol Vis Sci. 2008;49(8):3262–8. doi: 10.1167/iovs.07-1556. [DOI] [PubMed] [Google Scholar]
- 8.Chisholm IA, Drance SM, Chauhan BC. The glaucoma suspect: differentiation of the future glaucomatous eye from the non-glaucomatous suspect eye. 1. Ultrasonic measurements and eye-wall stress. Graefes Arch Clin Exp Ophthalmol. 1989;227(1):17–20. doi: 10.1007/BF02169818. [DOI] [PubMed] [Google Scholar]
- 9.Luce DA. Determining in vivo biomechanical properties of the cornea with an ocular response analyzer. J Cataract Refract Surg. 2005;31(1):156–62. doi: 10.1016/j.jcrs.2004.10.044. [DOI] [PubMed] [Google Scholar]
- 10.Kirwan C, O’Keefe M, Lanigan B. Corneal hysteresis and intraocular pressure measurement in children using the reichert ocular response analyzer. Am J Ophthalmol. 2006;142(6):990–2. doi: 10.1016/j.ajo.2006.07.058. [DOI] [PubMed] [Google Scholar]
- 11.Mangouritsas G, Morphis G, Mourtzoukos S, Feretis E. Association between corneal hysteresis and central corneal thickness in glaucomatous and non-glaucomatous eyes. Acta Ophthalmol. 2009;87(8):901–5. doi: 10.1111/j.1755-3768.2008.01370.x. [DOI] [PubMed] [Google Scholar]
- 12.Anand A, De Moraes CG, Teng CC, et al. Corneal hysteresis and visual field asymmetry in open angle glaucoma. Invest Ophthalmol Vis Sci. 2010;51(12):6514–8. doi: 10.1167/iovs.10-5580. [DOI] [PubMed] [Google Scholar]
- 13.Leung CK, Cheung CY, Weinreb RN, et al. Evaluation of retinal nerve fiber layer progression in glaucoma: a study on optical coherence tomography guided progression analysis. Invest Ophthalmol Vis Sci. 2010;51(1):217–22. doi: 10.1167/iovs.09-3468. [DOI] [PubMed] [Google Scholar]
- 14.Mansouri K, Leite MT, Medeiros FA, et al. Assessment of rates of structural change in glaucoma using imaging technologies. Eye (Lond) 2011 doi: 10.1038/eye.2010.202. [DOI] [PMC free article] [PubMed] [Google Scholar]
- 15.Sample PA, Girkin CA, Zangwill LM, et al. The African Descent and Glaucoma Evaluation Study (ADAGES): design and baseline data. Arch Ophthalmol. 2009;127(9):1136–45. doi: 10.1001/archophthalmol.2009.187. [DOI] [PMC free article] [PubMed] [Google Scholar]
- 16.Medeiros FA, Bowd C, Zangwill LM, et al. Detection of glaucoma using scanning laser polarimetry with enhanced corneal compensation. Invest Ophthalmol Vis Sci. 2007;48(7):3146–53. doi: 10.1167/iovs.06-1139. [DOI] [PubMed] [Google Scholar]
- 17.Artes PH, Chauhan BC. Longitudinal changes in the visual field and optic disc in glaucoma. Prog Retin Eye Res. 2005;24(3):333–54. doi: 10.1016/j.preteyeres.2004.10.002. [DOI] [PubMed] [Google Scholar]
- 18.Strouthidis NG, Scott A, Peter NM, Garway-Heath DF. Optic disc and visual field progression in ocular hypertensive subjects: detection rates, specificity, and agreement. Invest Ophthalmol Vis Sci. 2006;47(7):2904–10. doi: 10.1167/iovs.05-1584. [DOI] [PubMed] [Google Scholar]
- 19.Jonas JB, Berenshtein E, Holbach L. Lamina cribrosa thickness and spatial relationships between intraocular space and cerebrospinal fluid space in highly myopic eyes. Invest Ophthalmol Vis Sci. 2004;45(8):2660–5. doi: 10.1167/iovs.03-1363. [DOI] [PubMed] [Google Scholar]
- 20.Lesk MR, Hafez AS, Descovich D. Relationship between central corneal thickness and changes of optic nerve head topography and blood flow after intraocular pressure reduction in open-angle glaucoma and ocular hypertension. Arch Ophthalmol. 2006;124(11):1568–72. doi: 10.1001/archopht.124.11.1568. [DOI] [PubMed] [Google Scholar]
- 21.Kotecha A, Crabb DP, Spratt A, Garway-Heath DF. The relationship between diurnal variations in intraocular pressure measurements and central corneal thickness and corneal hysteresis. Invest Ophthalmol Vis Sci. 2009;50(9):4229–36. doi: 10.1167/iovs.08-2955. [DOI] [PubMed] [Google Scholar]
- 22.De Moraes CG, Ritch R, Liebmann JM. Bridging the major prospective National Eye Institute-sponsored glaucoma clinical trials and clinical practice. J Glaucoma. 2011;20(1):1–2. doi: 10.1097/IJG.0b013e3181d1d234. [DOI] [PubMed] [Google Scholar]


