

Abstract
Purpose
Regulatory T cells (Treg) accumulate in tumor tissues and the peripheral blood of cancer patients and may persist after therapies. This cross-sectional study examines effects of adjuvant chemo-radiotherapy (CRT) on Treg numbers and function in head and neck squamous cell carcinoma (HNSCC) patients.
Experimental design
The frequency and absolute numbers of CD4+, ATP-hydrolyzing CD4+CD39+ and CD8+ T cells and expression levels of CD39, CD25, TGF-β-associated LAP and GARP on Treg were measured by flow cytometry in 40 healthy donors (NC) and 71 HNSCC patients (29 untreated with active disease (AD); 22 treated with surgery; 20 treated with CRT). All treated subjects had no evident disease (NED) at the time of phlebotomy. In an additional cohort of 40 subjects with AD (n=15), NED (n=10) and NC (n=15), in vitro sensitivity of CD4+ T cell subsets to cisplatin and activation-induced cell death (AICD) was tested in Annexin V-binding assays.
Results
CRT decreased the frequency of circulating CD4+ T cells (p<0.002) but increased that of CD4+CD39+ Treg (p≤0.001) compared to untreated or surgery-only patients. Treg frequency remained elevated for >3 years. CRT increased surface expression of LAP, GARP and CD39 on Treg. In vitro, Treg were resistant to AICD or cisplatin but conventional CD4+ T cells (Tconv) were not. CRT-induced Treg from AD or NC subjects up-regulated pro-survival proteins, while Tconv up-regulated pro-apoptotic Bax.
Conclusions
Highly suppressive, cisplatin-resistant Treg increase in frequency and persist after CRT and could be responsible for suppression of anti-tumor immune responses and recurrence in HNSCC.
Keywords: HNSCC, Treg frequency, chemoradiotherapy (CRT), Treg resistance, CD4+ T cells
Introduction
Standard of care therapy for patients with head and neck squamous cell cancer (HNSCC) includes radical surgery and various regimens of chemo-radiotherapy (CRT) (1). However, survival rates remain at less than 50% in HNSCC due to disease recurrence and the development of distant metastases (2). It has been suggested that CRT eliminates subsets of immune cells, thus reducing anti-tumor effector functions and contributing to disease recurrence (3). For this reason, current interest has been focused on the influence of CRT on the host immune system and on alterations in various hematopoietic cell populations that occur during CRT. We and others have reported that CD4+ T cells are especially sensitive to CRT, and that their absolute number decreases after treatment (3, 4). In contrast, the frequency of regulatory T cells (Treg) was reported to be increased after chemotherapy in some studies (5), and was linked to poor prognosis and shorter patient survival (6). In our earlier studies, we observed an increased frequency and elevated suppressor function of Treg in the peripheral blood of HNSCC patients and at the tumor sites. Further, the Treg frequency was found to be elevated in the blood of patients treated with adjuvant CRT (7). These findings suggesting that in contrast to conventional CD4+ T cells (Tconv), Treg appeared to be resistant to CRT provided a rationale for a more detailed examination of Treg attributes in HNSCC patients treated with adjuvant CRT.
Recently, human Treg have been reported to express surface CD39, an ectonucleotidase, which is a component of the adenosine pathway (8–10) and is considered as a reliable marker for isolation of human Treg (11). We reported that the CD4+CD39+ T cell subset consists of two ATP-hydrolysing subsets: CD25+FOXP3+ cells, which suppress cytokine expression and proliferation of autologous CD4+ Tconv and CD25negFOXP3neg cells, which are not suppressive in CFSE-based assays, but are capable of mediating suppression via the adenosine pathway (12). These two CD4+ T cell subsets share the ability to hydrolyze exogenous (e)ATP to ADP and AMP (12, 13). Effects of CRT on these Treg subsets are unknown, and we considered the possibility that their functions and interactions with each other or with CD4+ Tconv are influenced by oncological therapies.
In this cross-sectional study, we prospectively examine the frequency and functions of these two Treg subsets in cohorts of HNSCC patients who were either untreated or treated with surgery alone or CRT. The objective was to evaluate short-term and long-term effects of CRT on these Treg subsets relative to CD4+ Tconv or CD8+ Tconv and to consider the mechanisms responsible for persistently elevated frequency of Treg after CRT and its potential impact on disease recurrence.
Materials and Methods
Patients and normal donors
Peripheral venous blood samples obtained from 20 normal donors (NC) and 71 HNSCC patients were used for phenotyping studies. An additional cohort of 25 patients and 15 NC donated peripheral blood for in vitro experiments with cisplatin. All subjects signed an informed consent approved by the Institutional Review Board of the University of Pittsburgh (IRB # 991206). The first patient cohort included 23 females and 48 males with a mean age of 59.3 ± 10.1 years (range: 31–78 years). The 29 patients with active disease (AD) were untreated at the time of blood draws; 22 patients were treated with surgery alone (SRG), and 20 patients had received adjuvant CRT 14 ± 9 months (mean ± SD) prior to the phlebotomy for this study. All treated patients were NED at the time of blood draws. Chemotherapy was platinum-based and consisted of cisplatin or carboplatin. Panitunumab and paclitaxel were each added in one case, respectively. All patients received radiation therapy, which ranged from 44–70 Gy. Clinicopathologic and demographic data for the patient cohorts are listed in Table 1. The age-matched NC cohort included 9 females and 31 males with a mean age of 51 ± 6 years (range 39–69 years).
Table 1.
Clinicopathologic characteristics of patients studied for the Treg frequency.
| Control | Untreated | Treated with surgery alonea | Treated with CRT | |
|---|---|---|---|---|
| N (female/male) | 40 (9/31) | 29 (6/23) | 22 (6/16) | 20 (2/18) |
| Age (+/− SD)b range (yrs) | 51 ± 6 (39–69) | 58 ± 9 (39–74) | 60 ± 10 (38–78) | 55 ± 12 (31–76) |
| Stage (n)c | ||||
| T1 | 5 | 10 | 3 | |
| T2 | 10 | 5 | 3 | |
| T3 | 6 | 2 | 7 | |
| T4 | 8 | 5 | 7 | |
| Nodal status (n)c | ||||
| N0 | 13 | 20 | 7 | |
| N1 | 5 | 1 | 1 | |
| N2 | 11 | 1 | 12 | |
| Location (n) | ||||
| tongue | 10 | 7 | 3 | |
| oral cavity | 8 | 4 | 7 | |
| pharynx | 4 | 1 | 5 | |
| larynx | 7 | 8 | 4 | |
| other | 0 | 2 | 1 | |
| Days since treatment (range)d | 321 ± 389 8–1680 | 408 ± 279 1–975 | ||
Two patients had received adjuvant radiation without chemotherapy
Age at diagnosis.
The patients’ TNM status was based on clinical/pathological diagnoses. In the CRT cohort diagnostic biopsies were performed in 12/20 patients.
The patients who donated blood for the Treg studies were NED at the time of phlebotomy.
The cohort of 25 patients who donated blood for the in vitro sensitivity/resistance studies included 17 males and 8 females with a mean age of 60 years (range 23–82 yrs); 10 patients had AD (7/10 had primary untreated tumors and 3/10 had a recurrent disease); all 15 NED patients underwent surgery and were treated with CRT. Their therapy was terminated from 3 weeks to 12 months before phlebotomy for this study.
Collection of peripheral blood mononuclear cells
Blood samples (20 mL) were drawn into heparinized tubes, and plasma was collected after centrifugation at low speed. The cell pellets were re-suspended in 40mL PBS and centrifuged on Ficoll-Hypaque gradients (GE Healthcare Bioscience). Peripheral blood mononuclear cells (PBMC) were recovered, washed in AIM-V medium (Invitrogen), counted in a trypan blue dye, and immediately used for experiments. A fraction of harvested cells was cryopreserved for cytokine expression assays by flow cytometry.
Flow cytometry reagents
The following anti-human monoclonal antibodies (mAb) were used for staining: anti-CD19-ECD, anti-CD4-PC5, anti-CD8-PE, anti-HLA-DR-ECD (all Beckman Coulter); anti-CD73-PE, anti-Bcl-2-FITC, anti-Bcl-2-PE, anti-Bcl-xL-FITC and anti-Bax-FITC (all BD Pharmingen); anti-CD39-FITC, anti-CD38-FITC, FOXP3-FITC (Clone PCH101), LAP-PE, GARP-APC (all eBioscience), and anti-CD25-PE (Miltenyi). Isotype controls were included in all assays and served as negative controls for surface as well as intracellular staining. All Abs were pre-titrated using activated as well as non-activated PBMC to determine the optimal staining dilution for each.
Surface and intracellular staining
Freshly isolated cells to be used for flow cytometry, were incubated with mAbs specific for each surface marker in 50μL PBS for 30 min at room temperature (RT) in the dark and washed with phosphate buffered saline (PBS) before acquisition for surface marker detection. For intracellular staining of pro-survival BcL-2 and BcL-xL proteins or pro-apoptotic Bax, cells were first incubated with relevant mAbs specific for surface markers. After washing, cells were fixed with 4% (v/v) paraformaldehyde in PBS for 20 min at RT, washed once with PBS and permeabilized with PBS containing 0.5% BSA and 0.1% (v/v) saponin. Next, pre-titered antibodies specific for BcL-1, BcL-xL or Bax were added and incubated with the cells for 30 min at RT. Cells were further washed twice with PBS containing 0.5% BSA and 0.2% saponin, resuspended in FACS flow solution and analyzed by flow cytometry. Expression of intracellular FOXP3 was evaluated using a staining kit available from eBioscience as previously described (14).
Flow cytometry
Flow cytometry was performed using an EPICS XL-MCL flow cytometer equipped with Expo32 software (Beckman Coulter). The acquisition and analysis gates were restricted to the live cells based on forward and side scatter properties of the cells. At least 1 × 10⁵ events were acquired for analysis and, where applicable, gates were restricted to the CD4+, CD4+CD39+, or CD8+ T cell subsets. The cell frequency and mean fluorescence intensity (MFI) were determined. Absolute numbers of CD4+ T cells were determined using the whole blood counts; absolute numbers of Treg were calculated by multiplying the Treg frequency values by the absolute number of CD4+ T cells.
Isolation of Treg
CD4+ T cells were isolated from buffy coats of NC by negative magnetic bead separation according to the manufacturer’s protocol (AutoMACS, Miltenyi). CD4+CD39+ T cells were then isolated by magnetic immunobeads as previously described (11). Briefly, CD4+ T cells were incubated with anti-CD39 biotinylated Ab and anti-biotin magnetic beads before isolation by AutoMACS. The purity of isolated cell populations was >85%.
Ex vivo activation of T cells
PBMC obtained from NC or patients with HNSCC were incubated in anti-CD3/antiCD28 Abs-coated wells in flat-bottom 96-well plates in the presence of IL-2 (150IU/mL) for 48 h at 37° C in the atmosphere of 5% CO2 in air. In some experiments, PBMC were pre-treated with physiologic doses of cisplatin determined as described by van den Bongard, et al (15) for 4h before further incubation with activating Abs and IL-2.
Detection of Annexin V-binding (ANXV+) to activated T cells
PBMC immediately after their isolation; PBMC after ex vivo activation as described above; or PBMC pre-incubated with cisplatin ± activating Abs and IL-2 were analyzed for ANXV binding to Treg or Tconv by flow cytometry. Samples were stained with FITC-conjugated or PE-conjugated ANXV (Molecular Probes) according to instructions provided by the manufacturer. Flow cytometry was performed with gates restricted to CD3+CD4+CD25high and CD3+CD4+CD25neg T cell subsets.
In vitro sensitivity of T cell subsets to cisplatin
CD4+CD39+ and CD4+CD39neg T cell subsets were isolated from PBMC of NC using magnetic beads as described above. These T cell subsets were then incubated with cisplatin (3–5 ug/mL) in the presence of Staphylococcal Protein B (SEB, 1ug/mL, Sigma-Aldrich) or activating Abs and IL-2 in RPMI media. On day 2 and 5, cells were harvested and stained for Annexin-FITC, 7AAD (Invitrogen), and CD4-PE (Beckman-Coulter) for 20 min on ice as previously described (16).
Statistics
The data are presented as mean values ± SD. For samples with non-parametric distribution, p-values were calculated by Kruskal-Wallis and two-tailed exact Wilcoxon-Mann-Whitney tests. Correlations were calculated by the Spearman test. P values < 0.05 and R2 values > 0.5 were considered to be significant.
Results
Frequency and absolute numbers of T cell subsets
The frequency and absolute numbers of CD4+ and CD8+ T cells in the peripheral blood specimens obtained from HNSCC patients who were not yet treated (i.e., with active disease (AD) prior to surgery) as well as patients treated with surgery alone (SRG) or with CRT were compared (Figure 1). The frequency and absolute numbers of both CD4+ and CD8+ T cells were significantly decreased in the blood of patients with AD as well as those treated with surgery alone relative to NC values. In the cohort of CRT patients, percentages and absolute numbers of CD4+ T cells were dramatically decreased (p<0.002 for both; Figure 1a). However, the frequency of CD8+ T cells increased following CRT in this patient cohort relative to NC values, although the absolute number of CD8+ T cells significantly decreased (p< 0.001) as shown in Figure 1b. The data suggest that while CRT adversely affects both T cell subsets, it has especially detrimental effects on the CD4+ T cells. CD8+ T cells appear to be less sensitive to CRT or they recover faster than CD4+ T cells after CRT.
Figure 1. The frequency and absolute numbers of CD4+ and CD8+ T lymphocyte subsets in the peripheral blood of HNSCC patients.
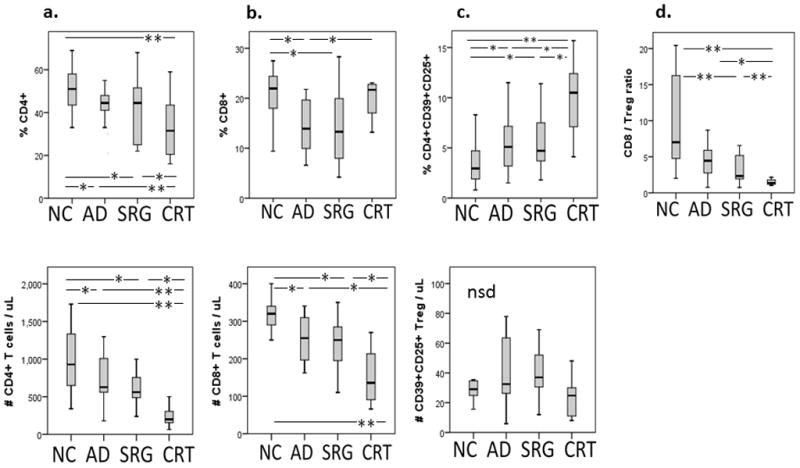
Box plots show median, 25 and 75 percentiles, and the highest and lowest values. NC = normal control (n= 40); AD = untreated active disease (n= 29); SRG = treated with surgery alone (n= 22); CRT = treated with adjuvant chemo-radiotherapy (n= 20). *p< 0.05, **p< 0.01.
Frequency and absolute numbers of CD4+CD39+ Treg
Because CD4+ T cells contain Treg, we were especially interested in therapy-induced changes in the CD4+ T-cell subset. We have previously shown that in humans, functional CD4+ Treg are CD39+CD25+, express FOXP3 and hydrolyze (e)ATP to 5′AMP (12). Within the CD4+ T-cell compartment, the frequency of these cells was found to be increased (p<0.01) in the AD and SRG patient cohorts relative to that seen in NC (Figure 1c). However, the most dramatic increase in the frequency, although not the absolute number (Figure 1c), of Treg was seen in the CRT patients (p<0.001). These results suggest that in the shrinking CD4+ T-cell compartment, CD4+CD39+CD25+ Treg are relatively resistant to CRT as compared to CD4+ Tconv. Their frequency increases while that of CD4+ T cells declines following CRT. We have also calculated the CD8+/Treg ratio for all patient cohorts, because this ratio has been often used in evaluating changes in the immune profile in situ and in the peripheral circulation of cancer patients treated with various therapies (6, 17). As shown in Figure 1d, the CD8+/Treg ratio was lower in all patient groups than in NC, but it was most prominently decreased in the CRT patient cohort, which is consistent with the significant increase in the frequency of Treg after CRT and the resistance of these cells to CRT as described above. Here, the significantly decreased CD8+/Treg ratio after therapy suggests that Treg are more resistant to CRT than CD8+ T cells. Interestingly, the frequency of CD19+ B cells was also increased after CRT (Supplemental Figure 1), an indication that B cells might also be resistant to CRT.
A decline in the size of the CD4+ T-cell compartment following oncological therapies was further evaluated, and Figure 2a shows that it is accompanied by increasing percentages of CD4+CD39+ Treg in representative patients selected from each of the cohorts. Importantly, CD4+CD39+CD25+ Treg appear as a distinct, well-defined population among CD4+ T cells, which can be easily distinguished from CD4+CD39negCD25+ Tconv by flow cytometry. For patients in the SRG and CRT cohorts, the frequency and absolute numbers of total circulating CD4+ T cells negatively correlate with the percentage of CD4+CD39+CD25+ Treg at p<0.001 and p<0.002, respectively (Figure 2b). We have previously shown that based on expression of surface markers and functional characteristics, human Treg can be divided into (i) strongly suppressive CD4+CD39+CD25+ T cells which are FOXP3+ and (ii) CD4+CD39+CD25neg T cells which do not express FOXP3 and mediate little suppression (12). Within the Treg subpopulation, a strong positive relationship exists between these two subsets in NC (12) and, as shown in Figure 2c, this relationship is not altered in untreated patients (AD) or in patients with NED who were treated with SRG or CRT. The two Treg subsets track each other and the frequency of both was found to be equally increased in all patient cohorts compared with NC (Figure 2c). As expected, the frequency of CD4+CD39+CD25+ Treg significantly correlated with that of CD4+CD25high
Figure 2. Changes in the CD4+ T-cell compartment after oncological therapies.

(a) Decreased total CD4+ T cell frequency is accompanied by increased frequency of CD4+CD39+ Treg. Density plots show data from representative HNSCC subjects selected from each study group. Gates are set on the lymphocyte window (left column), and on the CD4+ T-cell subset (right column). (b) Negative associations between percentages (left) or absolute numbers (right) of total CD4+ T cells and the percentages of CD4+CD39+CD25+ Treg in the circulation of HNSCC patients treated with SRG or CRT. (c) A positive correlation between the frequency of CD4+CD39+CD25+ Treg and CD4+CD39+CD25neg cells in the peripheral circulation. (d) A positive correlation between the frequency of CD4+CD25high and CD4+CD39+CD25+ Treg subsets in the peripheral circulation of NC as well as all HNSCC patients.
T cells in the peripheral blood of HNSCC patients, indicating that these two subsets of Treg closely overlap (Figure 2d).
Functional characteristics of Treg in patients treated with CRT
Suppressor cell assays based on proliferation inhibition require large cell numbers and, therefore, they are not useful for monitoring of patient specimens, which are often limited in volume. For this reason, we used flow cytometry-based assays to measure expression of functionally-relevant proteins, such as the latency-associated peptide (LAP) and the glycoprotein A repetitions predominant (GARP), known to be expressed on the surface of cells which produce and release TGF-β (18). Because Treg utilize TGF-β as a suppressive mechanism (19), and LAP as well as GARP are established surrogate markers for TGF-β (20, 21), we evaluated expression of LAP and GARP on the surface of CD4+CD39+ Treg, as surrogate markers for Treg suppressor activity in all patient cohorts (Figure 3a and b). We have previously reported that suppressive CD4+CD39+FOXP3+ Treg expressed LAP and GARP, while CD4+CD39+FOXP3neg T cells did not (12). The highest percentages of LAP+ or GARP+ Treg were seen in CRT-treated patients. (Figure 3c). Also, expression of these markers was highly and significantly up-regulated on Treg in the CRT patient cohort (Figure 3a and b). In addition, the mean fluorescence intensity (MFI) of CD39 was up-regulated on Treg in all the HNSCC groups relative to that in NC, and the highest MFI for CD39 was observed in Treg of patients in the CRT cohort (Figure 3d). These data suggest that Treg of the CRT-treated patients have a better ability to hydrolyze exogenous ATP to 5′-AMP than Treg of patients in the other cohorts. We have previously shown that CD39 expression levels on the cell surface positively correlate with enzymatic hydrolysis of exogenous ATP by Treg (12).
Figure 3. Analysis of functional surface markers on Treg.

Expression of TGF-β-associated LAP and GARP on the surface of CD4+CD39+FOXP3+ T cells stimulated with SEB as described in Methods. (a) Density plots are gated on CD4+CD39+ T cells of one representative subject from each study group. (b) Surface expression (MFI) of LAP and GARP in Treg of patients or NC (*p = 0.01). (c) Box plots show percentages of LAP+ or GARP+ Treg among total CD4+CD39+ Treg in NC and HNSCC patient cohorts (*p = 0.02). (d) Box plots show CD39 expression (MFI) in Treg obtained from HNSCC patients (*p = 0.04).
Persistent up-regulation of the Treg frequency in CRT-treated patients
Blood specimens were obtained from NED patients treated with CRT at various times after the end of therapy (n=20). The average time period elapsed between the end of treatment and phlebotomy for this study was 14 ± 9 months (mean ± SD). The increased Treg frequency observed in the CRT-treated patients was independent of the time of blood draws after the end of therapy (Figure 4a and b). This suggests that the increase in the Treg frequency represents a long-lasting effect in these patients. A subset of HNSCC patients (n=22) treated with surgery alone also showed an increase in the Treg frequency shortly after surgery (1–6 months). However, in patients tested 6 to 15 months after surgery, the Treg frequency was normal, suggesting that in contrast to CRT, surgery was not associated wuth persistent elevation of Treg (Figure 4). Importantly, in some of the NED patients who were treated with CRT, the frequency of Treg was elevated even after three years after end of therapy. In 3 NED patients treated with CRT, serial blood specimens were obtained at 6, 8 and 12 months after termination of therapy. The Treg frequency remained elevated, ranging between 12 and 16%, in these patients’ blood, further suggesting that a stable and persistent increase in Treg characterizes this patient cohort. Figure 4 shows that the percentages of total CD4+ T cells remained within the normal range in patients treated with surgery, while CRT-treated patients had low percentages of CD4+ T cells months after therapy.
Figure 4. Persistence of Treg in the circulation of NED patients after therapy and in vitro resistance of Treg to cisplatin.

(a) Percentages of CD4+CD39+CD25+ Treg in the peripheral circulation of HNSCC patients who are NED after CRT. The elevated Treg frequency in patients was independent of the time period elapsed between the last treatment and phlebotomy for this study. (b) In HNSCC patients treated with SRG alone, the Treg frequency was increased shortly after treatment but later appeared to normalize. (c) percentages of total CD4+ T cells were persistently decreased in CRT-treated patients. In a, b and c, the solid line represents the mean Treg (3.2%) or CD4+ T cell (42%) frequency established for NC, and the dotted lines show ± 1 SD of the mean. (d) Isolated CD4+CD39+ and CD4+CD39neg T cells obtained from 4 different NC were incubated in the presence of physiological concentrations of cisplatin for 48h. At the cisplatin concentration of 3ug/mL, the increase in frequency of ANXV+ cells was greater (p<0.03) among CD4+CD39neg Tconv than among CD4+CD39+ Treg.
Clinical significance of persistently high Treg
The cohort of 20 CRT patients was followed for 37 ± 13 months (mean ± SD from the end of treatment) to determine whether anyone experienced disease recurrence. During this period of time, 4 patients recurred and 3 others developed second primary HNSCC (35%). Two of the second primary tumors occurred at 25 months and the third at 45 months after CRT ended, and all three patients had elevated percentages of Treg (6–19%) in the peripheral circulation. Within the CRT cohort, there was no significant difference in the Treg frequency (p= 0.18) between patients who recurred or developed new primary tumors (12 ± 4%) and those who did not recur (9 ± 5%; means ± SD). In the similarly followed surgery only cohort, 4/22 patients experienced recurrence (18%), and there were no second primary cancers observed. There was also no significant difference in the Treg frequency (p>0.2) between patients who had recurrence and those who did not.
In vitro sensitivity of CD4+ T cell subsets to cisplatin or AICD
Our data suggest that the high frequency of Treg seen in the blood of HNSCC patients treated with CRT could be due to resistance of these cells induced by therapy. To test the hypothesis that the long-term Treg survival after CRT is a characteristic of these cells, sensitivity/resistance to cisplatin of CD4+CD39+ Treg freshly-isolated from the PBMC of NC and activated ex vivo (i.e., incubated either with SEB or anti-CD3/CD28 Abs and IL-2) was tested in ANXV-binding assays. CD4+CD39+ Treg and CD4+CD39neg Tconv were incubated with physiologic concentrations of cisplatin as previously described by van den Bongard, et al (15). The CD4+CD39+ Treg subset was found to be more resistant (p<0.03) to cisplatin than CD4+CD39neg Tconv (Figure 4d).
Using PBMC obtained from NC and HNSCC patients treated or not treated with CRT, we studied resistance/sensitivity of Treg to activation induced cell death (AICD) following in vitro activation of PBMC with anti-CD3/CD28 Abs and IL-2 (150 IU/mL). After 48h incubation, we used flow cytometry to measure ANXV binding to CD4+CD24high vs. CD4+CD25neg T-cell subsets and to compare their resistance/sensitivity of these cells to AICD or cisplatin. Figure 5a shows that after ex vivo activation, only CD4+CD25high Treg of patients treated with CRT were resistant to activation-induced cell death, as evidenced by the lack of ANXV binding [left panel], while activated Treg of untreated patients or of NC were highly sensitive to AICD. In contrast, no difference in ANX binding to CD4+CD25neg Tconv was seen among the three cohorts: only 20–40% of Tconv bound ANXV [right panel]. Further, as shown in Figure 5b, pre-incubation with cisplatin (4h) followed by PBMC activation for 48h induced resistance of CD4+CD25high Treg obtained from NC or untreated HNSCC patients to AICD [left panel], and this resistance was also evident in Treg of patients treated with CRT. In contrast, pre-treatment with cisplatin induced greater sensitivity to AICD in CD4+CD25neg Tconv of NC as well as HNSCC patients, as nearly all of these cells became ANXV+ as shown in Figure 5b [right panel].
Figure 5. In vitro resistance of CD4+CD25high Treg to cisplatin and up-regulated expression of the pro-survival proteins in Treg treated with cisplatin.


(a) ANXV binding to Treg (CD4+CD25high) [left] or Tconv (CD4+CD25neg) [right] in the in vitro activated PBMC obtained from NC (n=15), untreated HNSCC patients (pre; n=10) or HNSCC patients treated with CRT (post; n-15). PBMC were incubated with anti-CD3/CD28 Abs and 150IU/mL of IL-2 for 48h and studied for the evidence of AICD (ANXV binding) by flow cytometry, gating on Treg and Tconv cells. Only Treg obtained from the CRT-treated patients (post)were resistant to AICD. (b) ANXV binding to Treg (CD4+CD25high) [left] or Tconv (CD4+CD25neg) [right] in PBMC which were pre-treated in vitro with cisplatin for 4h prior to incubation of the cells in the presence of anti-CD3/CD28 Abs and IL-2 for 48h. Only Treg became resistant to AICD as determined by measuring ANXV binding. (c) Expression of Bcl-2, Bcl-xL and Bax are shown as MFI ± SD in CD4+CD25high Treg and CD4+CD25neg Tconv. PBMC were obtained from the blood of NC, untreated or CRT-treated patients and were pre-incubated or not with cisplatin and then activated as described above in (a). The solid lines (PRE to POST panels) show increased expression levels of Bcl-2 and Bcl-xL in POST Treg as compared to those in PRE Treg which were incubated with in vitro cisplatin. * p< 0.001; **p<0.005.
Differential effects of cisplatin on Treg vs. CD4+ Tconv
To investigate the mechanisms responsible for resistance of Treg in CRT-treated patients to AICD, expression of pro-survival Bcl-2/Bcl-xL and of pro-apoptotic Bax was compared in Treg vs. Tconv pre-incubated with or without cisplatin before in vitro activation (Figure 5c). Cisplatin up-regulated expression of the pro-survival proteins in Treg, while it significantly down-regulated pro-survival protein expression in Tconv (Figure 5c, right panel) Also, the pre-treatment with cisplatin decreased expression of Bax in Treg, while it dramatically up-regulated expression of this pro-apoptotic protein in Tconv. These CD4+CD25+ Treg in the blood of HNSCC patients treated with CRT (POST) up-regulated expression levels of survival proteins relative to those in PRE Treg (p<0.001) and were highly resistant to in vitro cisplatin, perhaps due to cumulative direct or indirect in vivo effects of CRT. In contrast, CD4+CD25+ Treg in the blood of NC incubated in vitro with cisplatin for 4h (Figure 4d) showed a relatively small, albeit statistically significant, increase in resistance vs. that observed in CD4+CD25neg Tconv.
Discussion
Effects of oncological therapies on lymphocyte subsets have been of considerable interest, because of the possibility that therapy-induced changes in immune-cell homeostasis might interfere with anti-tumor activity. In this respect, in vivo studies in mice indicate that radiation and chemo-radiation exert strong effects on the host immune system, including Treg (22). The limited data that are available for patients with cancer suggest that CRT reduces the number of circulating lymphocytes (23). In HNSCC patients, CD4+ T helper cells were previously reported to be particularly sensitive to CRT, as they were found to be significantly depleted relative to other T cell subsets (3, 24). Recently, attention has focused on Treg, a subset of CD4+ T cells responsible for mediating suppression of anti-tumor immune responses (25). The presence and accumulations of Treg at tumor sites and in the peripheral circulation of cancer patients, including HNSCC patients, have been widely reported (6, 7, 26). These high Treg frequencies have been negatively or positively correlated with disease outcome in various malignancies (6, 27, 28). Studies also indicate that the Treg frequency tends to increase after oncologic therapies (23), introducing a possibility that Treg are more resistant to CRT than CD4+ Tconv. This prospective cross-sectional study in a large cohort of HNSCC patients was performed to examine this possibility and to provide insights into potential mechanisms responsible for Treg resistance to oncological therapies.
Confirming our previous observations, we show that in comparison to NC, untreated HNSCC patients or those treated with surgery or surgery plus CRT have reduced percentages and absolute numbers of CD4+ T cells but increased percentages of CD4+CD39+ Treg. As the CD4+ T cell compartment shrinks in disease, the proportion but not absolute number of circulating CD4+CD39+ Treg increases. This contraction was especially magnified in the CRT patient cohort, implying that Treg, unlike CD4+ Tconv, are resistant to CRT. Treg resistance to radiation and drugs has been reported (29, 30). However, the exact mechanisms responsible for Treg resistance to CRT remain unclear. This resistance might reflect the slow proliferation rate of Treg in the periphery or existence of protective mechanisms, e.g., multi-drug transporter pumps, and the enhanced capability for DNA-repair (31). A short exposure of Treg to cisplatin prior to activation appears to protect them from AICD and is mediated by elevated expression levels of survival proteins, Bcl-2 and Bcl-xL, and lower levels of pro-apoptotic Bax than those observed in Tconv (Figure 5). Still another possibility is that toll like receptors (TLR) present on Treg (32) and signaling in response to ligands released by radiation-induced tissue damage activate the PI3K/Akt survival pathway, protecting Treg from effects of CRT. Such TLR-mediated chemoresistance has been previously described for tumor cells (33–35). Others report that platinum-based chemotherapies decrease immune suppression acting not on Treg but on DC or tumor cells, reducing expression of the T-cell inhibitory molecule PD-L2 on these cells and up-regulating recognition of tumor targets by T cells (36).
Here, we advance the hypothesis that CRT induces tissue changes which have indirect effects on Treg, favoring their survival and suppressor functions. For example, increased TGF-β levels in irradiated tissues could promote Treg differentiation (12, 22). The persistently enlarged post-CRT Treg compartment includes cells with increased immunosuppressive capabilities (e.g., up-regulated LAP, GARP and CD39). These CRT-induced Treg produce more 5′-AMP and ADO, acquire and maintain the ‘killer phenotype’ associated with expression of Fas, FasL and GrB/perforin, as previously reported by us (37) and up-regulate pro-survival proteins. We show here that activated CD4+CD39+ Treg are more resistant to cisplatin than CD4+ Tconv and that CD4+CD25high Treg obtained from HNSCC patients with NED after CRT become resistant to AICD, while CD4+CD25neg Tconv remain sensitive (Figure 5). Together, our data support the hypothesis that Treg induced in the CRT environment acquire new characteristics that make them into long-surviving and potentially more dangerous immune-regulatory cells.
In preclinical models, radiation therapy (RT) has been reported to either interfere with anti-tumor immune responses by the elimination of immune effector cells (38) or to promote these responses by enhancing the processing and presentation of tumor antigens by APC (39,40). These opposing RT-induced effects are related to alterations in tissues and cells, which appear to be dependent on the dose and type of RT (38–40). For example, the ATP concentration is increased in damaged irradiated tissues (22), providing therapy-induced Treg with an opportunity to produce 5′-AMP and ADO. These factors acting via the adenosine receptors potentially influence survival and activity of Treg. Since isolated CD4+25+ T cells contain significantly higher levels of mRNA coding for A1R, A2AR and A3R than CD4+CD25neg T cells (our unpublished data), we surmise that autocrine and paracrine signaling via these receptors has profound effects on functions and survival of CRT-induced Treg. Our experiments with CD4+CD39+ or CD4+CD25high Treg subsets suggest that environmentally-generated signals, as exemplified by TGF-β, ATP or ADO, regulate functions of CRT-induced Treg and might contribute to their resistance and survival after CRT. Thus, resistance of these Treg to cisplatin or AICD might not be their intrinsic characteristic but rather reflects an environmentally-regulated requirement for their activity to regulate immune homeostasis disturbed by therapy which alters the immune cell numbers and balance. To what extent this induced resistance to drugs such as cisplatin is related to immune escape mechanisms, which are responsible for the promotion of tumor growth in cancer patients, remains to be determined. Our data suggest that human Treg are able to utilize various survival mechanisms to protect themselves from exogenous stress signals. Treg survival appears to be critically important for the host, emphasizing the significant role these T cells play in health and disease.
The observed elevations in the Treg frequency and functions in patients with active (pre-therapy) and inactive (post-therapy) disease were independent of the time elapsed between the treatment and blood draws. In fact, the Treg frequency remained elevated for weeks and months in many, although not all, HNSCC patients who were NED after CRT. The suppressive potential of Treg is known to be related to the Treg/Tconv ratio. The functional consequence of an increase in the proportion of Treg after CRT is that this ratio changes in favor of Treg. These Treg acquire stronger suppressor function after CRT and express more TGF-β-associated LAP and GARP as well as ATP-hydrolyzing CD39 on their surface. Oure data are provocative, as they suggest that persistent elevations in the CD4+CD39+ Treg frequency induced in the blood of cancer patients by potentially curative therapies, such as surgery and adjuvant CRT, result in suppression of anti-tumor immune effector cells and thus promote disease recurrence or the development of secondary cancers. The fact that in our study, three of the CRT-treated patients with elevated Treg percentages developed second primary cancers within 2 to 4 years of therapy suggests that the imbalance in immune regulation might promote disease progression.
It has also been suggested that CRT induces a state of chronic inflammation in tissues, which has been linked to cancer development (41). The presence of iTreg in this setting could be beneficial to the host by normalizing T-cell responses and maintaining immune responses in balance. The role of Treg which accumulate after CRT in the promotion or inhibition of tumor progression is currently unclear. Prospective serial monitoring will be necessary to determine the biologic and clinical consequences of increased Treg frequency in HNSCC patients treated with CRT.
Supplementary Material
Translational Relevance.
Despite radical surgery and various regimens of chemoradiotherapy (CRT), survival rates remain lower than 50% for head and neck squamous cell cancer (HNSCC). The patients initially responsive to therapy develop recurrent disease, second primaries or metastases. Current interest has been focused on effects of CRT on the host immune system. In this cross-sectional study, absolute numbers, frequency and functions of CD4+CD39+ regulatory T cells (Treg) were monitored in patients with HNSCC and were compared in cohorts of patients who were either untreated or treated with surgery only or adjuvant CRT. The data show that in HNSCC patients, CRT increases the frequency of highly suppressive regulatory T cells (Treg) which are resistant to activation induced cell death and to cisplatin. Mechanisms responsible for this resistance include enhanced expression of pro-survival proteins BcL-2/BcL-xL in Treg. The persistence of Treg in the patients’ circulation long after CRT is finished could be responsible for post-CRT immunosuppression leading to cancer recurrence in HNSCC patients.
Acknowledgments
This study was supported in part by NIH grant PO1 CA109688 to TLW and by the Pittsburgh-Essen-Partnership Program to PJS. The services of the Immunologic Monitoring and Cellular Products Laboratory (IMCL) and the Flow Cytometry Laboratory were supported in part by the NCI CCSG 5P30 CA047904.
Footnotes
Conflict of Interest: All authors declare no conflict of interest.
Author Contributions.
Conception and design: Patrick Schuler, Theresa Whiteside
Administrative and financial support: Stephan Lang, Theresa Whiteside
Provision of study materials and patients: Jonas Johnson, Theresa Whiteside
Collection and assembly of data: Patrick Schuler, Malgorzata Harasymczuk, Zenichiro Saze, Laura Strauss
Data analysis and interpretation: Patrick Schuler, Bastian Schilling, Theresa Whiteside
Manuscript writing: Theresa Whiteside, Patrick Schuler
Final approval of manuscript: all authors
References
- 1.Brockstein BE, Vokes EE. Head and neck cancer in 2010: Maximizing survival and minimizing toxicity. Nat Rev Clin Oncol. 2011;8:72–4. doi: 10.1038/nrclinonc.2010.226. [DOI] [PubMed] [Google Scholar]
- 2.Oddone N, Morgan GJ, Palme CE, Perera L, Shannon J, Wong E, et al. Metastatic cutaneous squamous cell carcinoma of the head and neck: the immunosuppression, treatment, extranodal spread, and margin status (ITEM) prognostic score to predict outcome and the need to improve survival. Cancer. 2009;115:1883–91. doi: 10.1002/cncr.24208. [DOI] [PubMed] [Google Scholar]
- 3.Kuss I, Hathaway B, Ferris RL, Gooding W, Whiteside TL. Decreased absolute counts of T lymphocyte subsets and their relation to disease in squamous cell carcinoma of the head and neck. Clin Cancer Res. 2004;10:3755–62. doi: 10.1158/1078-0432.CCR-04-0054. [DOI] [PubMed] [Google Scholar]
- 4.Sewell HF, Halbert CF, Robins RA, Galvin A, Chan S, Blamey RW. Chemotherapy-induced differential changes in lymphocyte subsets and natural-killer-cell function in patients with advanced breast cancer. Int J Cancer. 1993;55:735–8. doi: 10.1002/ijc.2910550506. [DOI] [PubMed] [Google Scholar]
- 5.Ersvaer E, Liseth K, Skavland J, Gjertsen BT, Bruserud O. Intensive chemotherapy for acute myeloid leukemia differentially affects circulating TC1, TH1, TH17 and TREG cells. BMC Immunol. 2010;11:38. doi: 10.1186/1471-2172-11-38. [DOI] [PMC free article] [PubMed] [Google Scholar]
- 6.Sato E, Olson SH, Ahn J, Bundy B, Nishikawa H, Qian F, et al. Intraepithelial CD8+ tumor-infiltrating lymphocytes and a high CD8+/regulatory T cell ratio are associated with favorable prognosis in ovarian cancer. Proc Natl Acad Sci USA. 2005;102:18538–43. doi: 10.1073/pnas.0509182102. [DOI] [PMC free article] [PubMed] [Google Scholar]
- 7.Mandapathil M, Szczepanski MJ, Szajnik M, Ren J, Lenzner DE, Jackson EK, et al. Increased ectonucleotidase expression and activity in regulatory T cells of patients with head and neck cancer. Clin Cancer Res. 2009;15:6348–57. doi: 10.1158/1078-0432.CCR-09-1143. [DOI] [PMC free article] [PubMed] [Google Scholar]
- 8.Deaglio S, Dwyer KM, Gao W, Friedman D, Usheva A, Erat A, et al. Adenosine generation catalyzed by CD39 and CD73 expressed on regulatory T cells mediates immune suppression. J Exp Med. 2007;204:1257–65. doi: 10.1084/jem.20062512. [DOI] [PMC free article] [PubMed] [Google Scholar]
- 9.Borsellino G, Kleinewietfeld M, Di Mitri D, Sternjak A, Diamantini A, Giometto R, et al. Expression of ectonucleotidase CD39 by Foxp3+ Treg cells: hydrolysis of extracellular ATP and immune suppression. Blood. 2007;110:1225–32. doi: 10.1182/blood-2006-12-064527. [DOI] [PubMed] [Google Scholar]
- 10.Mandapathil M, Hilldorfer B, Szczepanski MJ, Czystowska M, Szajnik M, Ren J, et al. Generation and accumulation of immunosuppressive adenosine by human CD4+CD25highFOXP3+ regulatory T cells. J Biol Chem. 2010;285:7176–86. doi: 10.1074/jbc.M109.047423. [DOI] [PMC free article] [PubMed] [Google Scholar]
- 11.Schuler PJ, Harasymczuk M, Schilling B, Lang S, Whiteside TL. Separation of human CD4+CD39+ T cells by magnetic beads reveals two phenotypically and functionally different subsets. J Immunol Methods. 2011;369:59–68. doi: 10.1016/j.jim.2011.04.004. [DOI] [PMC free article] [PubMed] [Google Scholar]
- 12.Schuler PJ, Schilling B, Harasymczuk M, Hoffmann T, Johnson J, Lang S, et al. Phenotypic and functional characteristics of ATP-hydrolysing CD4(+) CD39(+) FOXP3(+) and CD4(+) CD39(+) FOXP3(neg) T-cell subsets in patients with cancer. Eur J Immunol. 2012;42:1876–85. doi: 10.1002/eji.201142347. [DOI] [PMC free article] [PubMed] [Google Scholar]
- 13.Moncrieffe H, Nistala K, Kamhieh Y, Evans J, Eddaoudi A, Eaton S, et al. High expression of the ectonucleotidase CD39 on T cells from the inflamed site identifies two distinct populations, one regulatory and one memory T cell population. J Immunol. 2010;185:134–43. doi: 10.4049/jimmunol.0803474. [DOI] [PMC free article] [PubMed] [Google Scholar]
- 14.Law JP, Hirschkorn DF, Owen RE, Biswas HH, Norris PJ, Lanteri MC. The importance of Foxp3 antibody and fixation/permeabilization buffer combinations in identifying CD4+CD25+Foxp3+ regulatory T cells. Cytometry A. 2009;75:1040–50. doi: 10.1002/cyto.a.20815. [DOI] [PMC free article] [PubMed] [Google Scholar]
- 15.van den Bongard HJ, Mathot RA, Beijnen JH, Schellens JH. Pharmacokinetically guided administration of chemotherapeutic agents. Clin Pharmacokinet. 2000;39:345–67. doi: 10.2165/00003088-200039050-00004. [DOI] [PubMed] [Google Scholar]
- 16.Strauss L, Whiteside TL, Knights A, Bergmann C, Knuth A, Zippelius A. Selective survival of naturally occurring human CD4+CD25+Foxp3+ regulatory T cells cultured with rapamycin. J Immunol. 2007;178:320–9. doi: 10.4049/jimmunol.178.1.320. [DOI] [PubMed] [Google Scholar]
- 17.Chikamatsu K, Sakakura K, Whiteside TL, Furuya N. Relationships between regulatory T cells and CD8+ effector populations in patients with squamous cell carcinoma of the head and neck. Head Neck. 2007;29:120–7. doi: 10.1002/hed.20490. [DOI] [PubMed] [Google Scholar]
- 18.Stockis J, Colau D, Coulie PG, Lucas S. Membrane protein GARP is a receptor for latent TGF-beta on the surface of activated human Treg. Eur J Immunol. 2009;39:3315–22. doi: 10.1002/eji.200939684. [DOI] [PubMed] [Google Scholar]
- 19.Zheng SG, Wang JH, Gray JD, Soucier H, Horowitz DA. Natural and induced CD4+CD25+ cells educate CD4+CD25− cells to develop suppressive activity: the role of IL-2, TGF-β, and IL-10. J Immunol. 2004;172:5213–5221. doi: 10.4049/jimmunol.172.9.5213. [DOI] [PubMed] [Google Scholar]
- 20.Tran DQ, Andersson J, Hardwick D, Brebis L, Illei GG, Shevach EM. Selective expression of latency-associated peptide (LAP) and IL-1 receptor type I/II (CD121a/CD121b) on activated human FOXP3+ regulatory T cells allows for their purification from expansion cultures. Blood. 2009;113:5125–33. doi: 10.1182/blood-2009-01-199950. [DOI] [PMC free article] [PubMed] [Google Scholar]
- 21.Sun J, Tang DN, Fu T, Sharma P. Identification of human regulatory T cells in the setting of T-cell activation and anti-CTLA-4 immunotherapy on the basis of expression of latency-associated peptide. Cancer Discov. 2012;2:122–30. doi: 10.1158/2159-8290.CD-11-0236. [DOI] [PubMed] [Google Scholar]
- 22.Schaue D, Xie MW, Ratikan JA, McBride WH. Regulatory T cells in radiotherapeutic responses. Front Oncol. 2012;2:90. doi: 10.3389/fonc.2012.00090. [DOI] [PMC free article] [PubMed] [Google Scholar]
- 23.Rech AJ, Mick R, Kaplan DE, Chang KM, Domchek SM, Vonderheide RH. Homeostasis of peripheral FoxP3(+) CD4 (+) regulatory T cells in patients with early and late stage breast cancer. Cancer Immunol Immunother. 2010;59:599–607. doi: 10.1007/s00262-009-0780-x. [DOI] [PMC free article] [PubMed] [Google Scholar]
- 24.Hathaway B, Johnson JT, Piccirillo JF, Snyderman CH, Wagner RL, Labriola S, et al. Chemoradiation for metastatic SCCA: role of comorbidity. Laryngoscope. 2001;111:1893–5. doi: 10.1097/00005537-200111000-00003. [DOI] [PubMed] [Google Scholar]
- 25.Golovina TN, Vonderheide RH. Regulatory T cells: overcoming suppression of T-cell immunity. Cancer J. 2010;16:342–7. doi: 10.1097/PPO.0b013e3181eb336d. [DOI] [PubMed] [Google Scholar]
- 26.Strauss L, Bergmann C, Gooding W, Johnson JT, Whiteside TL. The frequency and suppressor function of CD4+CD25highFoxp3+ T cells in the circulation of patients with squamous cell carcinoma of the head and neck. Clin Cancer Res. 2007;13:6301–11. doi: 10.1158/1078-0432.CCR-07-1403. [DOI] [PubMed] [Google Scholar]
- 27.Petersen RP, Campa MJ, Sperlazza J, Conlon D, Joshi MB, Harpole DH, Jr, et al. Tumor infiltrating Foxp3+ regulatory T-cells are associated with recurrence in pathologic stage I NSCLC patients. Cancer. 2006;107:2866–72. doi: 10.1002/cncr.22282. [DOI] [PubMed] [Google Scholar]
- 28.Suzuki H, Onishi H, Morisaki T, Tanaka M, Katano M. Intratumoral FOXP3(+)VEGFR2(+) regulatory T cells are predictive markers for recurrence and survival in patients with colorectal cancer. Clin Immunol. 2013;146:26–33. doi: 10.1016/j.clim.2012.10.007. [DOI] [PubMed] [Google Scholar]
- 29.Szczepanski MJ, Szajnik M, Czystowska M, Mandapathil M, Strauss L, Welsh A, et al. Increased frequency and suppression by regulatory T cells in patients with acute myelogenous leukemia. Clin Cancer Res. 2009;15:3325–32. doi: 10.1158/1078-0432.CCR-08-3010. [DOI] [PMC free article] [PubMed] [Google Scholar]
- 30.Kachikwu EL, Iwamoto KS, Liao YP, DeMarco JJ, Agazaryan N, Economou JS, et al. Radiation enhances regulatory T cell representation. Int J Radiat Oncol Biol Phys. 2011;81:1128–35. doi: 10.1016/j.ijrobp.2010.09.034. [DOI] [PMC free article] [PubMed] [Google Scholar]
- 31.Schuler PJ, Trellakis S, Greve J, Bas M, Bergmann C, Bolke E, et al. In vitro chemosensitivity of head and neck cancer cell lines. Eur J Med Res. 2010;15:337–44. doi: 10.1186/2047-783X-15-8-337. [DOI] [PMC free article] [PubMed] [Google Scholar]
- 32.Wild CA, Brandau S, Lindemann M, Lotfi R, Hoffmann TK, Lang S, et al. Toll-like Receptors in Regulatory T Cells of Patients With Head and Neck Cancer. Arch Otolaryngol Head Neck Surg. 2010;136:1253–9. doi: 10.1001/archoto.2010.195. [DOI] [PubMed] [Google Scholar]
- 33.Szajnik M, Szczepanski MJ, Czystowska M, Elishaev E, Mandapathil M, Nowak-Markwitz E, et al. TLR4 signaling induced by lipopolysaccharide or paclitaxel regulates tumor survival and chemoresistance in ovarian cancer. Oncogene. 2009;28:4353–63. doi: 10.1038/onc.2009.289. [DOI] [PMC free article] [PubMed] [Google Scholar]
- 34.Soderlund K, Perez-Tenorio G, Stal O. Activation of the phosphatidylinositol 3-kinase/Akt pathway prevents radiation-induced apoptosis in breast cancer cells. Int J Oncol. 2005;26:25–32. [PubMed] [Google Scholar]
- 35.Sun Q, Zheng Y, Liu Q, Cao X. Rapamycin reverses TLR4 signaling-triggered tumor apoptosis resistance by disrupting Akt-mediated Bcl-xL upregulation. Int Immunopharmacol. 2008;8:1854–8. doi: 10.1016/j.intimp.2008.08.009. [DOI] [PubMed] [Google Scholar]
- 36.Lesterhuis WJ, Punt CJ, Hato SV, Eleveld-Trancikova D, Jansen BJ, Nierkens S, et al. Platinum-based drugs disrupt STAT6-mediated suppression of immune responses against cancer in humans and mice. J Clin Invest. 2011;121:3100–8. doi: 10.1172/JCI43656. [DOI] [PMC free article] [PubMed] [Google Scholar]
- 37.Czystowska M, Strauss L, Bergmann C, Szajnik M, Rabinowich H, Whiteside TL. Reciprocal granzyme/perforin-mediated death of human regulatory and responder T cells is regulated by interleukin-2 (IL-2) J Mol Med (Berl) 2010;88:577–88. doi: 10.1007/s00109-010-0602-9. [DOI] [PMC free article] [PubMed] [Google Scholar]
- 38.Kaur P, Asea A. Radiation-induced effects and the immune system in cancer. Front Oncol. 2012;2:191. doi: 10.3389/fonc.2012.00191. [DOI] [PMC free article] [PubMed] [Google Scholar]
- 39.Ma Y, Kepp O, Ghiringhelli F, Apetoh L, Locher C, Tesniere A, et al. Chemotherapy and radiotherapy:cryptic anti-cancer vaccines. Semin Immunol. 2010;22:113–24. doi: 10.1016/j.smim.2010.03.001. [DOI] [PubMed] [Google Scholar]
- 40.Kwilas AR, Donahue RN, Bernstein MB, Hodge JW. In the field: exploiting the untapped potential of immunogenic modulation by radiation in combination with immunotherapy for the treatment of cancer. Front Oncol. 2012;2:104. doi: 10.3389/fonc.2012.00104. [DOI] [PMC free article] [PubMed] [Google Scholar]
- 41.Lin WW, Karin M. A cytokine-mediated link between innate immunity, inflammation, and cancer. J Clin Invest. 2007;117:1175–83. doi: 10.1172/JCI31537. [DOI] [PMC free article] [PubMed] [Google Scholar]
Associated Data
This section collects any data citations, data availability statements, or supplementary materials included in this article.