

Abstract
Y-family DNA polymerases are known to bypass DNA lesions in vitro and in vivo. Sulfolobus solfataricus DNA polymerase (Dpo4) was chosen as a model Y-family enzyme for investigating the mechanism of DNA synthesis in single crystals. Crystals of Dpo4 in complexes with DNA (the binary complex) in the presence or absence of an incoming nucleotide were analyzed by Raman microscopy. 13C, 15N labeled d*CTP, or unlabeled dCTP, were soaked into the binary crystals with G as the templating base. In the presence of the catalytic metal ions, Mg2+ or Mn2+, nucleotide incorporation was detected by the disappearance of the triphosphate band of dCTP and the retention of C* modes in the crystal following soaking out of noncovalently bound C(or *C)TP. The addition of the second coded base, thymine, was observed by adding cognate dTTP to the crystal following single d*CTP addition. Adding these two bases caused visible damage to the crystal possibly caused by protein and/or DNA conformational change within the crystal. When d*CTP is soaked into the Dpo4 crystal in the absence of Mn2+ or Mg2+, the primer extension reaction did not occur; instead a ternary protein/template/d*CTP complex was formed. In the Raman difference spectra of both binary and ternary complexes, in addition to the modes of d(*C)CTP, features appear due to ring modes from the template/primer bases being perturbed and from the DNA backbone, as well as from perturbed peptide and amino acid side chain modes. These effects are more pronounced in the ternary than in the binary complex. Using standardized Raman intensities followed as a function of time C(*C)TP population in the crystal maximized at about 20 min. These remained unchanged in the ternary complex but declined in the binary complexes as chain incorporation occurred.
Keywords: Dpo4, Raman crystallography, DNA polymerase, dCTP
DNA polymerases perform a diverse repertoire of biological functions including genomic replication, DNA damage repair, lesion bypass, and immunoglobulin diversification. So far, six families of DNA polymerases (A, B, C, D, X, and Y) have been classified and the Y-family established in 2001 is the newest.1, 2 Cellular DNA is frequently damaged by both endogenous and exogenous agents and processes. Although there are various DNA repair pathways, a large number of DNA lesions escape repair and stall replicative DNA polymerases and thus the replication machinery.3 However, the Y-family DNA polymerases can bypass DNA lesions, thereby rescuing cellular DNA replication. Notably, each living organism contains at least one Y-family DNA polymerase.2 For example, Sulfolobus solfataricus, an aerobic crenarchaeon that metabolizes sulfur and grows optimally at 80°C and pH 2-4,4 encodes one Y-family enzyme, DNA polymerase IV (Dpo4).4, 5 In addition to a typical polymerase core with a “right hand” geometry, consisting of Finger, Thumb, and Palm domains, Dpo4 also contains a fourth domain, designated as the “little finger” (LF) domain6 (Figure 1)7. In the ternary structure shown in Figure 1C, the active site of Dpo4 is relatively “loose” and solvent accessible when compared to the active site of a replicative DNA polymerase.6 Moreover, Dpo4, like all other Y-family DNA polymerases, is devoid of the proofreading exonuclease domain. Thus, Dpo4 catalyzes polymerization in damaged or undamaged DNA with low fidelity.8-16
Figure 1.

Crystal structure of the (A) apo, (B) binary and (C) ternary complex of Dpo4. These structures are presented in Wong et al. [Protein Data Bank (PDB) number 2RDJ].7 The linker, DNA and dNTP are shown in black, grey and orange, respectively.
So far, all kinetically characterized DNA polymerases catalyze nucleotide incorporation by following a minimal kinetic mechanism17 with a rate-limiting pre-catalytic conformational change.16-22 Since our recent stopped-flow fluorescence resonance energy transfer assays conclusively show that a pre-catalytic global conformational change associated with all four domains of Dpo4 is too fast to be rate-limiting, it was hypothesized that the rate-limiting conformational change corresponds to the subtle repositioning of active site residues which are critical for properly aligning two magnesium ions, the 3′-hydroxyl of the primer terminus, the α-phosphate of the incoming dNTP, and the conserved carboxylate residues within the active site.19 For a new phosphodiester bond formation during nucleotide incorporation, the primer 3′-OH makes an in-line nucleophilic attack on the α-phosphate of an incoming dNTP. Interestingly, the nucleotidyl-transfer reaction catalyzed by a truncated human DNA polymerase η (eta), another Y-family member, has recently been visualized at atomic level through time resolved X-ray crystallography.23 Previously, the large fragment of Bacillus stearothermophilus DNA polymerase I was found to catalyze several rounds of nucleotide incorporation in crystals.24 Here, single crystal Raman spectroscopy is employed to probe Dpo4-catalyzed DNA chain extension and relevant protein/DNA conformational changes within crystals.
The Raman method uses a Raman microscope that consists of an optical microscope that allows the operator to view a single crystal within a drop of holding solution mounted in a crystallization tray. A laser excitation beam travels on the optical axis of the microscope and is focused within the single crystal 25. Back scattered light from the focal volume travels back through the microscope and is carried by an optical fiber to a Raman spectrometer. The spectrometer provides a Raman spectrum from the focal volume. The basic experiment involves recording the spectrum of the Dpo4•DNA crystal, then adding the ligand/substrate to the drop that contains the crystal. The ligand soaks in the crystal and the Raman difference spectrum [Dpo4•DNA + ligand] minus [Dpo4•DNA] reveals chemical details of the reaction between the ligand and the Dpo4•DNA complex.
EXPERIMENTAL PROCEDURES
The DNA polymerase Dpo4 contains 352 amino acids and has an approximate molecular weight of 40 kDa. The enzyme was purified as described previously 15 and co-crystallized with DNA substrate prepared by annealing a 13-mer DNA primer and an 18-mer template strand shown in Scheme 1 following a published protocol.6 The DNA strands were purchased from Integrated DNA Technologies, Inc. Single crystals of the Dpo4•DNA complex were grown as described and suspended in a 5 μl hanging drop within a crystallization tray mounted on the stage of a Raman microscope.25, 26 Typically, crystals of the Dpo4•DNA complex were 500 × 150 × 150 μm and the excitation laser beam was focused through a flat 500 × 150 μm face.
Scheme 1.
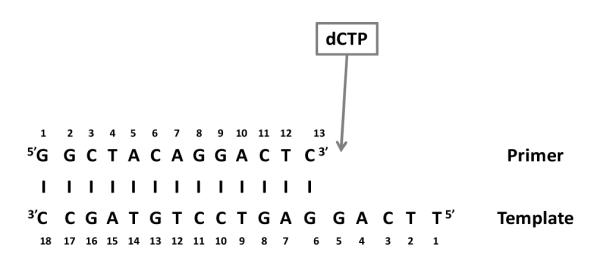
DNA template and primer sequence, the incoming dCTP will be added in order to observe the binding and/or nucleotide incorporation reaction.
2′-Deoxycytidine 5′-triphosphate (dCTP), thymidine 5′-triphosphate, and 15N and 13C labeled dCTP (d*CTP) were purchased from Sigma-Aldrich.
The Raman measurements were performed with the 647.1 nm line of a krypton laser; the laser power at the sample was 100 mW and the spectral data acquisition time was 100 seconds. Usually, a difference spectrum, the mathematical difference of two spectra, after and before ligand soaking into the crystal, was used to obtain the data.
RESULTS
1. The Raman spectrum of a Dpo4 single crystal
A Raman spectrum of the crystalline DNA-enzyme complex is shown in Figure 2, where a signal to noise ratio of about 140:1 was achieved. This was the highest spectral quality obtained because adding ligand (e.g. dCTP) to the crystals resulted in deterioration in crystal morphology as is discussed in the next section. In Figure 2, the most intense features are due to well documented protein modes, e. g. amide I and III, and the aromatic amino acid side chains of Phe and Tyr.27 However, the four bases of DNA also make a significant contribution, as does the PO2− stretch of DNA backbone groups at 1094 cm−1 and the phosphodiester backbone has a stretching mode that contributes to the intensity at 784 cm−1. These assignments are listed in Table 1 and based on references.27-32 In Figure 2, the amide I feature at 1663 cm−1, the high intensity in the 1340 cm−1 region and the peak at 939 cm−1 attest to the presence of significant α-helix structure.27, 31, 32 This is consonant with the X-ray crystal structure that has 48% α-helix secondary structure. One band at 1058 cm−1 could not be assigned with certainty. Tentatively, this may be a mode from part of the DNA phosphodiester backbone that it is distorted away from the classic A or B forms, we have published data on a RNA polymerase that show features in 1000-1100 cm−1 that are assigned to distorted regions of DNA or DNA/RNA duplexes.32
Figure 2.

Raman spectrum of a crystal of the binary complex of Dpo4 in a hanging drop containing 100 mM CaAc, 100 mM HEPES, 2.5% glycerol and 12% PEG 3350, pH 6.5.
Table 1.
Raman peak assignments for a crystal of Dpo4•DNA complex. The assignments are based on references. 27-32
| Raman peak (cm−1) | Assignment |
|---|---|
| 1663 | Amide I |
| 1617 | Tyr |
| 1607 | Phe |
| 1585 | A, G |
| 1486 | A, G |
| 1450 | δCH2 |
| 1421 | G |
| 1240-1300 | Amide III |
| 1338 | A |
| 1208 | Tyr |
| 1176 | Tyr |
| 1158 | Ile, Val |
| 1127 | Leu, Ile, Val |
| 1094 | PO2− |
| 1058 | DNA phosphodiester backbone |
| 1032 | Phe |
| 1003 | Phe |
| 961 | Lys, Leu |
| 939 | Lys, Leu, Val, α helix |
| 898 | Ala |
| 854 | Tyr |
| 831 | Tyr |
| 784 | C, T, DNA phosphodiester backbone |
| 751 | T |
| 740-680 | C-S |
| 731 | A |
| 684 | G |
| 645 | Tyr |
| 622 | Phe |
| 496 | G, T |
2. Raman intensity changes
In the Raman difference spectra discussed below, intensity changes in spectral features are monitored that have been assigned to dCTP, d*CTP, or protein and DNA modes from the Dpo4•DNA complex. There are three sources of intensity changes:
a) For dCTP (d*CTP) the intensity changes are due to population changes of the cytosine ring and the attendant triphosphate group inside the crystal.
b) Since the crystal forms a fixed set of axes, Raman dichroism can occur. This happens when groups change orientation in the crystal and thus change orientation with respect to the fixed orientation of the laser beam. For example, if purine and or pyrimidine rings change orientation during the experiment, the intensity of their Raman modes will change. It is maximal when the rings are at right angles to the incoming laser beam and minimal when the laser beam is parallel to the plane of the ring. This phenomenon is seen predominantly for base ring modes and amide I (mostly C=O) protein modes.
c) When adjacent purine and pyrimidine base modes stack or unstack this also affects their inherent Raman intensity. By analogy to absorbance spectroscopy, the changes in Raman intensity are termed Raman hypo- or hyper- chromism.27
3. Adding d*CTP to the hanging drop to form a ternary complex in the Dpo4 crystal
A ternary complex consists of a protein, a DNA substrate and an incoming dNTP at the pre-insertion stage. If the dNTP becomes covalently linked to the primer via phosphodiester bond formation the result is a post-insertion binary stage. Scheme 2, adapted from Cox et al.,33 illustrates the reaction mechanism. Ternary complexes were formed by soaking 15N and 13C labeled dCTP (d*CTP) into the crystal in the absence of Mg2+ or Mn2+ ions using the active template when it will bind in the active site without phosphodiester bond formation.
Scheme 2.

Reaction mechanism of a DNA polymerase.
Spectra at different times for “soaking in” d*CTP are shown in Figure 3A. The main d*CTP ring modes occur at 1215 and 763 cm−1 (the d*CTP Raman spectrum in aqueous solution is shown in Figure 5A) with a less intense mode at 1482 cm−1. In Figure 3A these peaks “grow in” with time, see below. An intense peak remains at 1126 cm−1 due to the d*CTP’s triphosphate, confirming that the d*CTP has not been incorporated into the primer chain. It must be kept in mind that the d*CTP peaks seen in Figure 3A could contain a contribution from non-specifically bound ligand (i.e. not H-bonded to template G in the active site, see Scheme 2) as well as d*CTP correctly bound in the active site. It is also likely that non-specifically bound d*CTP contributes to the intensity changes seen in Figure 3 by perturbing groups within the Dpo4-DNA complex.
Figure 3.

Ternary complex formation. Raman difference spectra of a crystal of Dpo4 in a hanging drop with no Mg2+ or Mn2+ ions. A) Raman spectra of the crystal at different times (10, 19 and 37 minutes) after the addition of 4 mM d*CTP to the hanging drop minus Raman spectrum before the addition of d*CTP, and B) Raman spectrum after 40 min of washing the crystal in the initial holding solution without d*CTP minus the Raman spectrum before soaking in d*CTP.
Figure 5.

The Raman spectra of deoxycytidine triphosphate. A) Raman spectrum of 100 mM 2′-deoxycytidine-13C9, 15N3, (labeled deoxycytidine) 5′-triphosphate (d*CTP) in solution, pH 7.0, in a hanging drop. B) Raman spectrum of 100 mM 2′-deoxycytidine 5′-triphosphate (dCTP) in solution, pH 7.0, in a hanging drop. Both spectra were recorded using 100 mW, 647.1 nm laser excitation, 100 s data accumulation.
In Figure 3A several peaks due to dA and dG are identified. These are likely due to the adenine (dA4) in the template next to the dG5 that H-bonds to the incoming *dCTP ring and the two guanines in the template closest to the bound d*CTP (dG5 and dG6) (Scheme 1). The formation of the Watson-Crick base pair changes the environment of the neighboring dA4, dG5 and dG6, and hence the intensity of the ring modes. Since this is a fixed population the intensity changes are probably the effect of Raman dichroism although Raman hyper- or hypo- chromism may play a role.27 Other notable bands in Figure 3A come from amide I modes at 1671 and 1653 cm−1 and amide III modes at 1295 and 1254 cm−1. Likely Raman dichroism is responsible although changes in protein secondary structure may occur on addition of d*CTP. The intensity of the amide I modes in Figure 3A at 37 min is about 8% of the amide I mode in Figure 2. This implies that the change seen in Figure 3A is equivalent to the intensity of 0.08 times the total number of amino acids, 352, namely 29 amino acids. The amide intensity change in Figure 3A is equivalent to 29 amino acids. To generate this value it means that more than 29 amino acids have moved and changed in amide I intensity in the ternary compared to the binary complex. Possibly the d*CTP in the active site is causing dynamic protein fluctuations to be damped leading to a slight narrowing of the amide I profiles and this could be another cause of the apparent increase in amide I and III mode intensities. In Figure 3A, the appearance of the band at 785 cm−1 is due to a backbone phosphodiester stretch mode of DNA, and this represents 19% of the intensity of the 785 cm−1 band in Figure 2. This indicates that the DNA backbone has undergone significant conformational change in the ternary complex. The Raman data by themselves do not usually identify the specific locations of the observed protein and DNA changes.
In Figure 4 the intensities of the Raman peaks are plotted during soak-in using the inactive template which is dideoxy at the 3′C in the presence of 50 mM Mn2+. The peak heights are standardized with the Phe peak at 1004 cm−1 in the mother spectrum prior to the subtraction. For marker bands the following features are used; for triphosphate near 1120 cm−1, C at 1241 cm−1, and DNA phosphodiester backbone at 784 cm−1. All these marker bands show similar time dependence and the changes in the intensity are ascribed predominantly to population changes. This is an initial fast phase from 0 to about 20 minutes corresponding to maximum C(*C)TP population. This is followed by a plateau with possibly a small increase in intensity from 20-100 minutes – which was the limit of the crystal stability. In Figure 3, for d*CTP, at 19 minutes soak-in the difference spectrum is dominated by d*CTP features but by 37 minutes has more contribution assigned to template nucleic acid and protein features. At 37 min. the *C peak intensities are essentially unchanged from 19 minutes. However, the increase in amide III intensity at 1254 cm−1 and in ring modes associated with the nucleic acid scaffold suggests that slow conformational changes occur after the point where maximal *C population is reached.
Figure 4.

Ternary Kinetics. 10 mM dCTP was added to a holding solution containing Dpo4•DNA crystal with an inactive template and with 50 mM MnCl2. The heights of several peaks rationed to the Phe peak are plot at different times: (solid) 783 cm−1 assigned to DNA backbone and C; (dash) 1241 cm−1 assigned to C, and (dot) 1116 cm−1 assigned to triphosphate.
When “soak-in” experiments were carried out on the Dpo4 binary complex, crystal cracking was invariably observed. One factor that may contribute to the cracking are protein and/or DNA conformational changes that, due to crystal packing forces, are not allowed the freedom to complete the changes that would be seen in solution. This would lead to unfavorable protein protein-constraints in the crystal that can be relieved by the crystal fragmenting.
The spectrum in Figure 3B is obtained under “soak-out” conditions. After “soaking in” d*CTP for 120 minutes the crystal was transferred to a holding solution that contained neither d*CTP nor Mg2+ or Mn2+. The difference spectrum was obtained after 40 minutes of “soak-out” conditions. The trace is almost a straight line showing that the d*CTP has left the crystal completely since no d*C ring modes remain. Moreover, the dA modes from the template disappear showing that the dA ring has resumed its position identical to that of the dA prior to soaking in d*CTP. Only very weak features persist. These are attributed to Tyr and Phe side chain modes, and to template dG ring closest to the d*CTP binding site that have not relaxed back completely to their pre-binding state in 40 minutes. The same conclusion can be drawn for the DNA backbone giving rise to the negative phosphodiester mode at 785 cm−1. That is the change in DNA backbone is greatly diminished after “soak-out”.
4. Extending the DNA chain by one base by soaking in dCTP in the presence of a divalent metal ion
In order to promote chain extension within the crystal, 50 mM Mn2+ ions (50 mM MnCl2)34 were added to the holding solution containing the crystal before soaking in 10 mM unlabeled dCTP. The resulting difference spectra are shown in Figure 6. At 62 minutes soak-in the spectrum seen in Figure 6A is obtained. The most intense peaks due to dC ring modes (see Figure 5B for the spectrum of aqueous unlabeled dCTP) are seen at 1529, 1293, 1255, and 785 cm−1. The medium intensity peak at 1122 cm−1 is due to dCTP’s triphosphate and is evidence that some unreacted dCTP remains in the crystal. Many bands are assigned to dA and dG ring modes and these result from dCTP perturbing the environment of the bases on the primer and template, as in the ternary complex of the previous section. Similarly, binding bring about changes in Tyr side chain environment, evidenced by the “negative” 856 cm−1 feature, and the Tyr 10 and Tyr 48 in the active site are good candidates as a source of this change. The broad feature near 1658 cm−1 is due to Dpo4’s amide I modes and shows that some perturbation to the protein α-helical secondary structure has also occurred although distinct amide III modes are not observed. The intense band at 785 cm−1 owes its intensity to a dC ring mode. Although a DNA backbone mode occurs at the same position it is unlikely that it contributes significantly since the insert band for *CTP shows weak intensity at 783 cm−1. Some of the intensity between 1030 and 1100 cm−1 is likely due to phosphodiester modes.32 For example the peak at 1094 cm−1 is due to the PO2− groups of the DNA backbone and this is evidence that the reaction is occurring since chain extension adds one additional PO2− to the chain.
Figure 6.

Effect of covalent addition of dCTP to the primer chain. 10 mM dCTP was added to a crystal of the binary complex of Dpo4 in a hanging drop containing 50 mM MnCl2. A) Raman difference spectrum at 62 min after addition of 10 mM dCTP to the crystal in the hanging drop minus Raman spectrum before soaking in dCTP, and B) Raman spectrum after 30 min of washing the crystal (after the reaction with dCTP) in the initial holding solution without dCTP minus Raman spectrum before soaking in the crystal in dCTP.
Features due to pyrophosphate could not be unambiguously detected. The Raman spectra of pyrophosphate tetrabasic (Na4P2O7) in water over a range of pHs as shown in Supplementary Figure S1. The peaks with highest intensities are in the region 1000 – 1150 cm−1 where PO2− modes from the DNA backbone occur and specific peaks due to the formation of pyrophosphate are difficult to identify. The pyrophosphate peak near 716 cm−1 (Supplementary Figure S1) was not observed, possibly due to its relatively low intensity and broad or due to the pyrophosphate product leaving the crystal.
In Figure 6A there are undoubtedly contributions from dCTPs that are not specifically bound in the active site and have not been covalently linked to the primer chain. Thus, “soaking out” was employed. After 62 min “soaking in”, we placed the crystal in holding solution that did not contain dCTP (50 mM Mn2+ metal remains). After 30 minutes of “soaking out” spectrum 6B was obtained. The intensity of the dC modes has diminished by about 65% showing that about one third of the original dCTP’s in the crystal has been incorporated in the primer chain. The triphosphate peak at 1125 cm−1 is small showing that now only a small amount of unreacted dCTP remains. Many perturbations persist but, compared to the ternary complex, changes in the protein conformation are less, the broad amide I band at 1658 cm−1 (Figure 5A) is replaced by three smaller peaks at 1681, 1667 and 1648 cm−1. These are tentatively assigned, at least in part, to the “C=O modes” from the new G-C Watson-Crick base pair that has been formed.
Figure 7 shows the intensity variation with time of the *C ring mode under conditions when the reaction is occurring: this is with the reaction template and 50 mM MnCl2. The population of *C, gauged by ring mode intensity at 1214 cm−1 rises rapidly to about 23 minutes and then decreases. The triphosphate population using the 1119 cm−1 mode as a marker also rises rapidly and peaks at 23 minutes, and declines as *CMP is incorporated in the DNA primer strand. The similar maxima in both traces in Figure 7 suggest that catalysis becomes dominant at about the point of “full soak-in”. The decrease in *C population in Figure 7 indicates that nonspecifically bound *CTP is expelled from the crystal after incorporation begins at around 23 minutes and suggest that a conformational change is occurring that leads to less favorable binding of non-specific *CTP.
Figure 7.

Binary Kinetics. 1 mM d*CTP was added to the holding solution containing a Dpo4•DNA crystal with active template and with 50 mM MnCl2 in order to start the polymerization reaction. Standardized peak heights are plotted at different times: (solid) 762cm−1 and (dash) 1214 cm−1, both assigned to labeled C (*C), and (dot) 1119 cm−1 assigned to triphosphate.
It is noteworthy that soaking in dCTP in the presence of 1 mM dCTP and 50 mM Mn2+ resulted in only specific binding. The intensities of the cytosine peaks in the difference spectrum after soaking in the crystal in a solution with 1 mM labeled dCTP after 40 min are the same as the intensities of the cytosine peaks after the soaking out experiment (Figure 6B) obtained by washing the crystal during 40 minutes in a solution without dCTP (data not shown).
There is no way of separating the effects of specific (i.e. *C Watson-Crick binding to template G) and non-active site d*CTP binding in Figure 3. However, the spectrum in Figure 6A suggest that there are fewer intensity changes for binary complex with non-covalently bound dCTPs than in Figure 3A for the ternary complex with non-specifically bound d*CTPs. This is supported by data in Figure 8A which compare covalently labeled d*CTP in a pure binary complex (Figure 6B) with that prior to soak-out where non-covalent d*CTPs are also present. Although the quality of the data is not optimal, in Figure 6B, after soak-out, compared to the ternary complex in Figure 3 only minor changes are seen in the amide I region near 1650 cm−1 and the DNA backbone marker band near 780 cm−1. In total the data suggest that in the binary complex the protein and DNA backbone changes are probably minor compared to those seen in the ternary complex.
Figure 8.

The sequential addition of cytidine and thymidine to the nascent DNA chain. 7 mM 15N, 13C labeled dCTP (d*CTP) and 2 mM were added sequentiallyto a crystal of Dpo4 in a hanging drop containing 50 mM MnCl2. A) Raman difference spectrum of the crystal after 30 minutes reaction with d*CTP minus Raman spectrum before soaking in d*CTP, and B) Raman difference spectrum showing dTTP reaction after addition of d*CTP to the primer chain. 2 mM dTTP was soaked into the crystal containing covalently bound d*C for 100 minutes. This crystal was washed for 50 minutes in holding solution containing no dTTP. Figure 7B is the difference spectrum [d*C crystal + dTTP + washing] minus [crystal before addition of d*CTP].
5. Extending the DNA chain by two bases using d*CTP and dTTP
In order to obtain a binary complex where one d*C was added to the primer, the protocol in the previous section was repeated using 13C, 15N labeled dCTP (d*CTP). The results are shown in Figure 8A. d*CTP at 7 mM with 50 mM Mn2+ was soaked in for 40 min and then soaked out for 30 min in holding solution that did not contain d*CTP. Although the data quality in Figure 8A is inferior to that in Figure 6, the spectrum of the washed out crystal resembles closely the spectrum in Figure 6B except that the main dC ring modes are downshifted e.g. the mode around 785 cm−1 is “downshifted” 22 cm−1 due to the 13C and 15N substitutions (d*C). Figure 8A confirms that for the binary complex the changes in protein and DNA conformation are small compared to those for the ternary complex since the amide I and III features and DNA backbone feature near 785 cm−1 are weak in the difference spectrum. This binary crystal was then soaked in 2 mM dTTP in the presence of 50 mM Mn2+ for 100 min. Then, following soaking in dTTP the crystal was placed in holding solution that has no dTTP for 50 min; the resulting difference spectrum is seen in Figure 8B. The multiple soak process gave crystals that had cracked and lost most of their crystalline appearance. However, a difference Raman spectrum could be obtained that showed both d*C and dT ring modes, strongly suggesting that both d*C and dT have been incorporated into the primer chain. No evidence for unreacted triphosphate is seen in Figure 8B.
It is of high interest that intense dA and dG ring modes occur in Figure 8B as does a peak from the DNA phosphodiester backbone at 784 cm−1. The high intensities suggest that upon the second soak with dTTP much larger changes are seen in the primer and/or template than those seen on the first d*CTP incorporation. This is interpreted as resulting from primer and template translocation, fully or partially, through the active site of Dpo4 in order to bring the template dA base into register with the catalytic machinery.
DISCUSSION
The Raman difference spectra allow us to observe structural and conformational changes in a crystalline Dpo4•DNA complex occurring when the DNA polymerization reaction is catalyzed by the Y-family polymerase Dpo4. The Raman peaks in the difference spectra with the highest intensity are usually due to the added nucleotide, dCTP, d*CTP or dTTP, but peaks corresponding to changes in the protein/DNA conformations or template/primer base perturbations can also be observed. For the latter larger changes are observed in ternary compared to binary complexes. The evidence that chain incorporation of dNTP is based on the fact that the C, *C or T ring modes remain in the crystal after extensively “soaking out” the non-covalently bound ligands. This is supported by the observations that there is little evidence for the reactive dNTP triphosphate group after “soak-out”. It is noteworthy that Xu et al.19 proposed that a local active site rearrangement is a rate-limiting conformational change step driving a single correct dNTP incorporation process. However, their studies were in aqueous solution and we will need to undertake future rapid mix – rapid quench experiments in solution as detailed below to examine conformational changes on the millisecond time scale.
Running the reaction in the crystal comes at a price. Significant degradation of the crystal morphology is observed. This could prevent future parallel X-ray crystallography experiments from being carried out which could use the Raman experiments as reference points for flash freezing in order to carry out time-dependent X-ray analysis32, 35-37. For future experiments the approach detailed by Nakamura et al.23 will be employed, in this study of the reaction investigating η DNA polymerase from the Y-family they co-crystallized the substrate and the enzyme in the absence of divalent metal ions, which prevents the chain incorporation reaction from occurring. They then triggered the reaction by soaking in Mg2+ and could observe high resolution maps by flash freezing at different time points during metal “soak-in”. It is possible that a major cause of the crystal cracking seen in our experiments is the conformational changes the enzyme wishes to make to achieve translation being opposed by crystal packing forces.
Clearly it would be of great interest to compare the reaction in solution with that in the crystal. Until very recently solution studies using normal (non-resonance) Raman spectroscopy were technically impossible. However, a flash-freezing protocol that can examine the reaction in aqueous solution in the millisecond time scale has been developed in our laboratory 38 and this approach will be used to follow dNTP incorporation catalyzed by Dpo4 DNA polymerase in aqueous solution.
Our Raman database on the nucleic acid polymerases is being extended. The present DNAP is the smallest, a single subunit about 40 KDa containing a DNA primer and an 18 nucleotide template. Recently, results on a 115 KDa RNA polymerase from the N4 phage virion were presented where the initiation of the RNA chain was studied.39 This in crystallo initiation reaction was about 3 times faster than the present DNA chain extension. The simultaneous soak-in of GTP and ATP was observed to plateau at 7 minutes. A small protein conformational change was seen on about the same time and this was assigned to movement of the α-helix near the active site. Functional active site formation about two Mg2+ ions was also seen in less than 10 minutes as evidenced by Asp side chains liganding to Mg2+. Triphosphate intensity reduction showed that catalysis was complete shortly after 10 minutes. Basu and Murakami40 used the Raman kinetic data to flash freeze and solve the structures of the N4 crystals at time points between the 0 to 10 minutes of soak in. The predictions from Raman crystallography were borne out, they were able to obtain high quality X-ray structures for intermediates during the formation of the covalent nucleic acid backbone bond. The trio of polymerases is completed by recent Raman studies on a RNAP from the bacteria Thermos thermophilus (Tth RNAP) (unpublished work, this laboratory). This is a 5 subunit 380 KDa ‘machine’. Time resolve in crystallo Raman data showed that the base to be incorporated, GTP, soaks in and “plateaus” after 30 minutes. This triggers a large reversible change in protein conformation probably from functionally important alpha helices that flank the active site and the crab-like “pincers” that form a channel to the active site. The protein conformational change is accompanied by a modest and reversible change in DNA backbone from the RNA/DNA hybrid between 0 and 60 minutes. The conformational changes lead to GTP incorporation between 65 and 100 minutes. Covalent bond formation occurs, apparently, shortly after the nucleic acid skeleton has translocated through the active site channel. Remarkably, the Tth RNA polymerase in the crystal appears to be primed for a second round of nucleotide triphosphate incorporation.
Thus, in all these NAPs the cognate NTP can be followed soaking into its crystal and starting or incorporating into a nucleic acid chain. The time scales range from minutes to 10s of minutes, probably 10 thousand to 100 thousand times slower than in solution. In each instance the time points of “interesting intermediates” that are candidates for X-ray analysis can be identified. In the case of RNAP from N4 this prediction has been met and their intermediates characterized by X-ray crystallography. DNAP and Tth RNAP reactions have yet to be studied by X-ray.
Supplementary Material
Acknowledgments
Funding Sources This work was supported by the National Science Foundation (Grant MCB-0960961) to Z.S and the NIH grants GM54072 and GM81420 to P.R.C.
Footnotes
Supporting Information. Figure S1. Raman spectra of pyrophosphate tetrabasic (Na4O7P2) in solution as a function of pH. This material is available free of charge via the Internet at http://pubs.acs.org
REFERENCES
- 1.Hubscher U, Maga G, Spadari S. Eukaryotic DNA polymerases. Annu. Rev. Biochem. 2002;71:133–163. doi: 10.1146/annurev.biochem.71.090501.150041. [DOI] [PubMed] [Google Scholar]
- 2.Ohmori H, Friedberg EC, Fuchs RPP, Goodman MF, Hanaoka F, Hinkle D, Kunkel TA, Lawrence CW, Livneh Z, Nohmi T, Prakash L, Prakash S, Todo T, Walker GC, Wang Z, Woodgate R. The Y-family of DNA polymerases. Mol. Cell. 2001;8:7–8. doi: 10.1016/s1097-2765(01)00278-7. [DOI] [PubMed] [Google Scholar]
- 3.Jackson SP. Detecting, signalling and repairing DNA double-strand breaks. Biochem. Soc. Trans. 2001;29:655–661. doi: 10.1042/0300-5127:0290655. [DOI] [PubMed] [Google Scholar]
- 4.She Q, Singh RK, Confalonieri F, Zivanovic Y, Allard G, Awayez MJ, Chan-Weiher CCY, Clausen IG, Curtis BA, De MA, Erauso G, Fletcher C, Gordon PMK, Heikamp-De JI, Jeffries AC, Kozera CJ, Medina N, Peng X, Thi-Ngoc HP, Redder P, Schenk ME, Theriault C, Tolstrup N, Charlebois RL, Doolittle WF, Duguet M, Gaasterland T, Garrett RA, Ragan MA, Sensen CW, Van d. O. J. The complete genome of the crenarchaeon Sulfolobus solfataricus P2. Proc. Natl. Acad. Sci. U. S. A. 2001;98:7835–7840. doi: 10.1073/pnas.141222098. [DOI] [PMC free article] [PubMed] [Google Scholar]
- 5.Prangishvili D, Klenk HP. Nucleotide sequence of the gene for a 74 kDa DNA polymerase from the archaeon Sulfolobus solfataricus. Nucleic Acids Res. 1993;21:2768. doi: 10.1093/nar/21.11.2768. [DOI] [PMC free article] [PubMed] [Google Scholar]
- 6.Ling H, Boudsocq F, Woodgate R, Yang W. Crystal structure of a Y-family DNA polymerase in action: a mechanism for error-prone and lesion-bypass replication. Cell. 2001;107:91–102. doi: 10.1016/s0092-8674(01)00515-3. [DOI] [PubMed] [Google Scholar]
- 7.Wong JH, Fiala KA, Suo Z, Ling H. Snapshots of a Y-Family DNA Polymerase in Replication: Substrate-induced Conformational Transitions and Implications for Fidelity of Dpo4. J. Mol. Biol. 2008;379:317–330. doi: 10.1016/j.jmb.2008.03.038. [DOI] [PubMed] [Google Scholar]
- 8.Masutani C, Kusumoto R, Yamada A, Dohmae N, Yokoi M, Yuasa M, Araki M, Iwai S, Takio K, Hanaoka F. The XPV (xeroderma pigmentosum variant) gene encodes human DNA polymerase eta. Nature. 1999;399:700–704. doi: 10.1038/21447. [DOI] [PubMed] [Google Scholar]
- 9.Matsuda T, Bebenek K, Masutani C, Hanaoka F, Kunkel TA. Low fidelity DNA synthesis by human DNA polymerase-eta. Nature. 2000;404:1011–1013. doi: 10.1038/35010014. [DOI] [PubMed] [Google Scholar]
- 10.Johnson RE, Washington MT, Haracska L, Prakash S, Prakash L. Eukaryotic polymerases iota and zeta act sequentially to bypass DNA lesions. Nature. 2000;406:1015–1019. doi: 10.1038/35023030. [DOI] [PubMed] [Google Scholar]
- 11.Levine RL, Miller H, Grollman A, Ohashi E, Ohmori H, Masutani C, Hanaoka F, Moriya M. Translesion DNA synthesis catalyzed by human pol eta and pol kappa across 1,N6-ethenodeoxyadenosine. J. Biol. Chem. 2001;276:18717–18721. doi: 10.1074/jbc.M102158200. [DOI] [PubMed] [Google Scholar]
- 12.Bebenek K, Tissier A, Frank EG, McDonald JP, Prasad R, Wilson SH, Woodgate R, Kunkel TA. 5′-deoxyribose phosphate lyase activity of human DNA polymerase ɭ in vitro. Science. 2001;291:2156–2159. doi: 10.1126/science.1058386. [DOI] [PubMed] [Google Scholar]
- 13.Zhang Y, Yuan F, Xin H, Wu X, Rajpal DK, Yang D, Wang Z. Human DNA polymerase kappa synthesizes DNA with extraordinarily low fidelity. Nucleic Acids Res. 2000;28:4147–4156. doi: 10.1093/nar/28.21.4147. [DOI] [PMC free article] [PubMed] [Google Scholar]
- 14.Wang Z. Translesion synthesis by the UmuC family of DNA polymerases. Mutat. Res., DNA Repair. 2001;486:59–70. doi: 10.1016/s0921-8777(01)00089-1. [DOI] [PubMed] [Google Scholar]
- 15.Fiala KA, Abdel-Gawad W, Suo Z. Pre-Steady-State Kinetic Studies of the Fidelity and Mechanism of Polymerization Catalyzed by Truncated Human DNA Polymerase lambda. Biochemistry. 2004;43:6751–6762. doi: 10.1021/bi049975c. [DOI] [PubMed] [Google Scholar]
- 16.Fiala KA, Suo Z. Mechanism of DNA Polymerization Catalyzed by Sulfolobus solfataricus P2 DNA Polymerase IV. Biochemistry. 2004;43:2116–2125. doi: 10.1021/bi035746z. [DOI] [PubMed] [Google Scholar]
- 17.Joyce CM, Benkovic SJ. DNA polymerase fidelity: Kinetics, structure, and checkpoints. Biochemistry. 2004;43:14317–14324. doi: 10.1021/bi048422z. [DOI] [PubMed] [Google Scholar]
- 18.Fiala KA, Sherrer SM, Brown JA, Suo Z. Mechanistic consequences of temperature on DNA polymerization catalyzed by a Y-family DNA polymerase. Nucleic Acids Res. 2008;36:1990–2001. doi: 10.1093/nar/gkn004. [DOI] [PMC free article] [PubMed] [Google Scholar]
- 19.Xu C, Maxwell BA, Brown JA, Zhang L, Suo Z. Global conformational dynamics of a Y-family DNA polymerase during catalysis. PLoS Biol. 2009;7:e1000225. doi: 10.1371/journal.pbio.1000225. [DOI] [PMC free article] [PubMed] [Google Scholar]
- 20.Rothwell PJ, Mitaksov V, Waksman G. Motions of the fingers subdomain of Klentaq1 are fast and not rate limiting: Implications for the molecular basis of fidelity in DNA polymerases. Mol. Cell. 2005;19:345–355. doi: 10.1016/j.molcel.2005.06.032. [DOI] [PubMed] [Google Scholar]
- 21.Allen WJ, Rothwell PJ, Waksman G. An intramolecular FRET system monitors fingers subdomain opening in Klentaq1. Protein Sci. 2008;17:401–408. doi: 10.1110/ps.073309208. [DOI] [PMC free article] [PubMed] [Google Scholar]
- 22.Joyce CM, Potapova O, DeLucia AM, Huang X, Basu VP, Grindley NDF. Fingers-Closing and Other Rapid Conformational Changes in DNA Polymerase I (Klenow Fragment) and Their Role in Nucleotide Selectivity. Biochemistry. 2008;47:6103–6116. doi: 10.1021/bi7021848. [DOI] [PubMed] [Google Scholar]
- 23.Nakamura T, Zhao Y, Yamagata Y, Hua Y.-j., Yang W. Watching DNA polymerase eta make a phosphodiester bond. Nature. 2012;487:196–201. doi: 10.1038/nature11181. [DOI] [PMC free article] [PubMed] [Google Scholar]
- 24.Kiefer JR, Mao C, Braman JC, Beese LS. Visualizing DNA replication in a catalytically active Bacillus DNA polymerase crystal. Nature. 1998;391:304–307. doi: 10.1038/34693. [DOI] [PubMed] [Google Scholar]
- 25.Carey PR. Raman crystallography and other biochemical applications of Raman microscopy. Annu. Rev. Phys. Chem. 2006;57:527–554. doi: 10.1146/annurev.physchem.57.032905.104521. [DOI] [PubMed] [Google Scholar]
- 26.Gong B, Chen J-H, Yajima R, Chen Y, Chase E, Chadalavada DM, Golden BL, Carey PR, Bevilacqua PC. Raman crystallography of RNA. Methods. 2009;49:101–111. doi: 10.1016/j.ymeth.2009.04.016. [DOI] [PMC free article] [PubMed] [Google Scholar]
- 27.Carey PR. Molecular Biology: Biochemical Applications of Raman and Resonance Raman Spectroscopies. Academic Press; New York, NY. USA: 1982. [Google Scholar]
- 28.Maiti NC, Apetri MM, Zagorski MG, Carey PR, Anderson VE. Raman Spectroscopic Characterization of Secondary Structure in Natively Unfolded Proteins: α-Synuclein. J. Am. Chem. Soc. 2004;126:2399–2408. doi: 10.1021/ja0356176. [DOI] [PubMed] [Google Scholar]
- 29.Overman SA, Thomas GJ., Jr. Raman Markers of Nonaromatic Side Chains in an α-Helix Assembly: Ala, Asp, Glu, Gly, Ile, Leu, Lys, Ser, and Val Residues of Phage fd Subunits. Biochemistry. 1999;38:4018–4027. doi: 10.1021/bi982901e. [DOI] [PubMed] [Google Scholar]
- 30.Thomas GJ, Jr., Benevides JM, Overman SA, Ueda T, Ushizawa K, Saitoh M, Tsuboi M. Polarized Raman spectra of oriented fibers of A DNA and B DNA: anisotropic and isotropic local Raman tensors of base and backbone vibrations. Biophys. J. 1995;68:1073–1088. doi: 10.1016/S0006-3495(95)80282-1. [DOI] [PMC free article] [PubMed] [Google Scholar]
- 31.Tsuboi M, Suzuki M, Overman SA, Thomas GJ., Jr. Intensity of the Polarized Raman Band at 1340-1345 cm-1 as an Indicator of Protein α-Helix Orientation: Application to Pf1 Filamentous Virus. Biochemistry. 2000;39:2677–2684. doi: 10.1021/bi9918846. [DOI] [PubMed] [Google Scholar]
- 32.Chen Y, Basu R, Gleghorn ML, Murakami KS, Carey PR. Time-Resolved Events on the Reaction Pathway of Transcript Initiation by a Single-Subunit RNA Polymerase: Raman Crystallographic Evidence. J. Am. Chem. Soc. 2011;133:12544–12555. doi: 10.1021/ja201557w. [DOI] [PMC free article] [PubMed] [Google Scholar]
- 33.Cox MM, Doudna JA, O’Donnell M. Molecular Biology. Principles and Practice. W.H. Freeman and Company; New York, NY. USA: 2012. [Google Scholar]
- 34.Vaisman A, Ling H, Woodgate R, Yang W. Fidelity of Dpo4: effect of metal ions, nucleotide selection and pyrophosphorolysis. EMBO J. 2005;24:2957–2967. doi: 10.1038/sj.emboj.7600786. [DOI] [PMC free article] [PubMed] [Google Scholar]
- 35.Helfand MS, Totir MA, Carey MP, Hujer AM, Bonomo RA, Carey PR. Following the Reactions of Mechanism Based Inhibitors with β-Lactamase by Raman Crystallography. Biochemistry. 2003;42:13386–13392. doi: 10.1021/bi035716w. [DOI] [PubMed] [Google Scholar]
- 36.Padayatti PS, Helfand MS, Totir MA, Carey MP, Hujer AM, Carey PR, Bonomo RA, Van d. A. F. Tazobactam Forms a Stoichiometric trans-Enamine Intermediate in the E166A Variant of SHV-1 β-Lactamase: 1.63 Å Crystal Structure. Biochemistry. 2004;43:843–848. doi: 10.1021/bi035985m. [DOI] [PubMed] [Google Scholar]
- 37.Basu RS, Murakami KS. Watching the bacteriophage N4 RNA polymerase transcription by time-dependent soak-trigger-freeze X-ray crystallography. J Biol Chem. 2013;288:3305–3311. doi: 10.1074/jbc.M112.387712. [DOI] [PMC free article] [PubMed] [Google Scholar]
- 38.Torkabadi HH, Che T, Shou J, Shanmugam S, Crowder MW, Bonomo RA, Pusztai-Carey M, Carey PR. Raman spectra of interchanging β-lactamase inhibitor intermediates on the millisecond time scale. J. Am. Chem. Soc. 2013;135:2895–2898. doi: 10.1021/ja311440p. [DOI] [PMC free article] [PubMed] [Google Scholar]
- 39.Chen Y, Basu, Gleorn ML, Muakami KS, Caey PR. Time-Resoled Evens on the Reaction Pathway of Transcrip Initiation by a Single -Subunit RNA Polymerase: Raman Crystallographic Evidence. J. Am. Chem. Soc. 2011;133:12544–12555. doi: 10.1021/ja201557w. [DOI] [PMC free article] [PubMed] [Google Scholar]
- 40.Basu RS, Murakami KS. Watching the Bacteriophage N4 RNA Polymerase Transcription by Time-dependent Soak-trigger-freeze X-ray Crystallography. J. Bio. Chem. 2013;288:3305–3311. doi: 10.1074/jbc.M112.387712. [DOI] [PMC free article] [PubMed] [Google Scholar]
Associated Data
This section collects any data citations, data availability statements, or supplementary materials included in this article.