Abstract
Mouse models are fundamental to the study and design of new techniques for the cancer diagnosis and treatment. The lymphatic system plays an active role in oncogenesis and metastatic disease progression. However, the in vivo identification of LNs in mice is challenging with conventional imaging modalities since the LN diameter in normal mice is 1–2 mm. Standard dissection techniques are challenging and can only provide endpoint data. Here, we describe high resolution MRI (HR-MRI) approaches for the non-invasive detection of mouse LNs in vivo. We compare in vivo non-invasive HR-MRI methods (without exogenous contrast injections) to the ex vivo dye injection methods for the identification of commonly studied LNs in both normal mice and a mouse model of pancreatic ductal adenocarcinoma (PDAC). We demonstrated the potential to use HR-MRI techniques as a non-invasive imaging assay for visualizing mouse LNs in vivo.
Keywords: mouse, lymph node, lymphatic drainage, India ink, magnetic resonance imaging
1. INSTRODUCTION
Mouse models are important for pre-clinical investigation of cancer immunology and for evaluating the efficacy of a broad range of immunotherapies (Buettner and Bode, 2012; Galon et al., 2012; Kennecke et al., 2012; Tournoy et al., 2012). The lymphatic system plays an active role in oncogenesis and metastatic disease progression; the lymphatic system often serves as a barrier to inhibit the distribution of invading tumor cells(Buettner and Bode, 2012; Galon et al., 2012; Kennecke et al., 2012; Tournoy et al., 2012). The lymph nodes (LN) can function as “filters” to remove cancer cells from the systemic circulatory system. The regional immune responses within LNs during cancer progression can be an important prognostic indicator and LN response often serves as a critical criterion for evaluating therapeutic response(Deneve et al., 2012; Lee et al., 2012),(Kimber et al., 2000; Helle et al., 2012; Noh et al., 2012). Infection and/or tumor cell migration commonly leads to increases in LN size. Mouse models have served a vital role in prior studies investigating mechanisms of tumor development and identification of improved diagnostic and therapeutic strategies. However, the LNs in mice are actually quite small and can be difficult to identify. Often distinguishing the LNs from the surrounding connective tissues can be difficult even in ex vivo settings at necropsy(Harrell et al., 2008).
Typically, colloidal India ink dyes, Evans Blue, or low molecular weight dyes with high affinity for serum albumin have been used for ex vivo mapping of the LNs in mice(Harrell et al., 2008). Near-infrared optical approaches offer the potential for in vivo imaging of superficial LNs; however, these methods provide relatively low spatial resolution and importantly cannot detect visceral LNs(Noh et al., 2012) located deep within the abdomen. Contrast-enhanced magnetic resonance imaging (MRI) has proven valuable for mouse LN mapping. However, particularly for serial measurements during longitudinal studies, the requisite injection of exogenous contrast media may be sub-optimal given the potential associated toxicities, impact upon LN function, and confounding interplay with employed therapeutic strategies(Melancon et al., 2007; Ruddell et al., 2008).
Thus, we hypothesized that high resolution MRI (HR-MRI) might be applicable for the non-invasive detection of mouse LNs in vivo. The purpose of this study was to compare in vivo non-invasive HR-MRI methods (without exogenous contrast injections) to the ex vivo dye injection methods for the identification of commonly studied LNs in both normal mice and a mouse model of pancreatic ductal adenocarcinoma (PDAC).
2. MATERIALS AND METHODS
All studies were approved by our institutional animal care and use committee and were performed in accordance with institutional guidelines.
2.1 PDAC cell line and mouse model of PDAC
The mouse Panc-02 cell line is derived from amethylcholanthrene-induced PDAC in C57BL/6 mice and was purchased from the American Type Culture Collection (ATCC; Rockville, MD, USA). Panc-02 cells were maintained in RPMI 1640 media supplemented with glutamine (2 mmol/l), pyruvate (1 mmol/l), penicillin and streptomycin (100 IU/ml), and 10% fetal bovine serum (FBS). The cells were maintained in a humidified atmosphere of 5% CO2 at 37°C. Before the implantation procedure, the viability of the cells was assessed using Trypan Blue staining (a cell viability of > 90% was required for tumor implantation). Female C57BL/6 mice (4 weeks of age, weighing between 13 and 17 g; Charles River, Wilmington, MA) were acclimated for at least 1 week prior to tumor implantation. Early-passage Panc-02 cells were harvested, and 2 × 10⁶ cells, suspended in 200 μL of phosphate buffered saline (PBS), were implanted into the left and right flanks of each mouse (n = 6). Six additional mice (n = 6) were inoculated with 0.5 ml PBS in the both left and right flanks to serve a control group. MRI examinations started 2 weeks after implantation when tumors achieved a diameter between 5 and 8 mm (longest tumor diameter measured using a caliper).
2.2 In vivo visualization of LNs using HR-MRI
Mice were anesthetized using a mixture of 2–3% isoflurane and 5 L/min oxygen via an automatic delivery system (Isoflurane Vaporizer, Vaporizer Sales and Services, Rockmart, GA, USA). The mice were repeatedly monitored during the procedure to maintain adequate anesthetic depth. During imaging procedures, each mouse was maintained in a prone position using a restraint apparatus. The MRI studies were performed using a Bruker 7.0T ClinScan high-field small animal MRI system (Bruker Biospin, Ettlingen, Germany) with a commercial mouse coil (Bruker Biospin, Ettlingen, Germany). Body temperature was continuously monitored using a thermometer and controlled using a water-bed heating system (SA Instruments, Stony Brook, NY, USA). For each animal, T1-weighted (T1W) and T2-weighted (T2W) HR-MRI images were acquired in both coronal and axial orientations. Parameters for these in vivo measurements were as follows. T2W: turbo spin echo (TSE) sequence, repetition time (TR)/echo time (TE) = 3000/44 ms; field of view (FOV) = 35 × 35 mm2; matrix = 256 × 256; turbo factor = 12; slice thickness = 0.14 mm, isotropic in-plane resolution = 0.14 mm; acquisition was synchronized to the respiratory cycle to minimize motion artifacts. T1W: segmented turbo-flash gradient-echo (TFL) sequence (TFL) with an inversion recovery preparatory pulse (IR-TFL), TR/TE = 1300/2.15 ms; FOV = 35 × 35 mm2; matrix = 256 × 256; slice thickness = 0.14 mm; isotropic in-plane resolution = 0.14 mm. Both the T1W and T2W MRI images were acquired with and without fat suppression. The sizes of the LNs were measured in one dimension (longest diameter recorded from the T2W images). The left axillary LN is located in the armpit area and the fundamental challenges of the LN MRI is that movement of the heart and respiratory cycle motion artifacts in the image. Due to poor image quality, the left left axillary LN was not included in this study.
2.3 Ex vivo lymph node isolation for size measurements and histology
Following MRI, the mouse left rear footpads were injected with 25 μl of 1% India ink (BD, Glen Rock, NJ, US) diluted in PBS using a 0.5 ml syringe with a 27 g needle. After 30 minutes, the mice were sacrificed by cervical dislocation and dissected to locate the lymphatic vessels and LNs of interest. The LNs of interest included the left popliteal, inguinal, axillary, iliac, and renal LNs (Fig. 1A). The longest length of each LN was measured using a vernier caliper. Following size measurements, each LN was isolated and fixed in 3.5% phosphate-buffered formaldehyde. 5 μm slices from the center of each LN were placed on glass slides for hematoxylin and eosin (H&E) staining. Each H&E slice was scanned at 20× magnification and these digitized images combined to produce a single image of each LN slice using the TissueFAXS system (TissueGnostics, Los Angeles, CA, USA).
Figure 1.
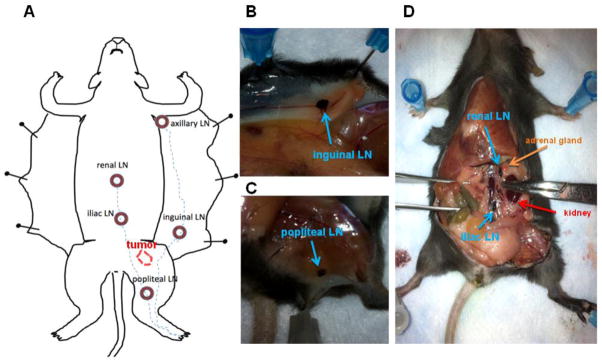
Lymphatic drainage in a normal mouse. A: Schematic illustration of lymphatic vessels and draining LNs is shown following left footpad dye injection. B, C, and D: Left hind footpad injection of 1% India ink labels the inguinal LN (B), popliteal LN (C) that drains centrally to the iliac and renal LNs (D) ex vivo.
2.4 Statistic analysis
The average size (mean) and standard deviation (SD) of each LN of interest were recorded (mean ± SD). The LN measurements performed for normal and tumor-bearing mice in vivo using T2W imaging and ex vivo using caliper assessments were compared using Student’s independent samples t-test. Pearson correlation coefficients were calculated to assess the relationship between the in vivo MRI measurements and the corresponding ex vivo caliper measurements. All of the statistical analyses were performed using GraphPad Prism 6 (GraphPad Software, CA, US) software package. P-values < 0.05 were considered to be statistically significant.
3. RESULTS
3.1 Ex vivo lymphatic drainage following left footpad injection
Figure 1A shows a schematic of dye-stained lymphatic vessels and draining LNs where the major lymphatic vessels drain into the popliteal or inguinal LNs and then into the iliac plexus, the iliac LNs, and other LNs (iliac and renal LNs), traveling up the midline prior to delivery into the subclavian vein and the blood circulation. Figure 1B and 1C show blue-stained popliteal LN and inguinal LNs that were readily distinguished from the surrounding connective tissues in each mouse. The stained popliteal LNs drain centrally to the iliac LNs and renal LNs (Figure 1D) along the midline. Each stained LN was measured with a caliper. However, because no dye uptake was observed in the axillary LNs, accurate caliper measurements were not feasible in these LNs; thus these LNs were excluded from the study.
3.2 In vivo HR-MRI visualization and size measurements of LNs
Coronal view T2W images of inguinal, popliteal, iliac, and renal LNs in a normal mouse are shown in Figs. 2A–C (same animal depicted at necropsy in Fig. 1). These LNs were generally of higher signal intensity than surrounding tissues within T2W images. The popliteal LNs, which are located within the fat pads, exhibited low signal intensity relative to surrounding fatty tissues within T1W images (Fig. 2D). Without fat suppression, there was generally a strong contrast between the popiteal LNs (low signal intensity) and surrounding tissues. A T2W image of the same popiteal LN with fat suppression applied is shown in Fig. 2E wherein the popiteal LN exhibits high signal intensity relative to the surrounding fat tissues.
Figure 2.
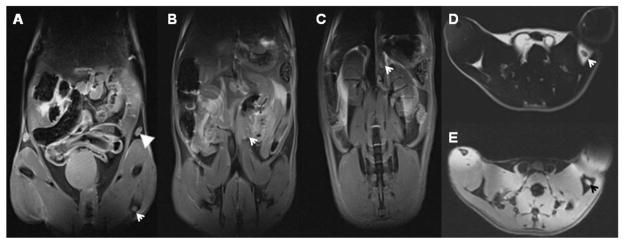
HR-MRI mapping of mouse LN in vivo: The corresponding the LNs labeled using 1% India ink (Figure 1) are showed in Figure 2. A, B, and C with a fat suppression MRI technique, the coronal views of the inguinal (A, arrowhead), popliteal (A, arrow), iliac (B, arrow), and renal (C, arrow) LNs in T2W images of the normal mouse. D (without a fat suppression, where the fat exhibits high signal intensity) and E (with a fat suppression, where the fat exhibits low signal intensity) are transverse T1W and T2W images of popliteal LN, respectively. MRI resolution is 0.14 × 0.14 × 0.14 mm3.
3.3 H&E staining
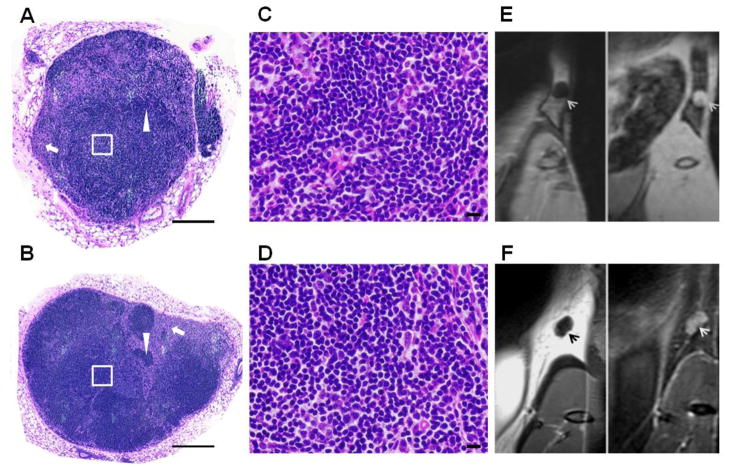
Two representative H&E-stained slices of the left inguinal LNs from normal and PDAC tumor-bearing mice are shown in Figs. 3A and 3B, respectively. Figs. 3C and 3D are high magnification images corresponding to the insets (white square) in Figs. 3A and 3B, respectively. In each of these specimens major LN structures including cortex, paracortex, and medulla can be clearly observed. Areas rich in fully formed T-cells (arrow) and B-cells (arrowhead) can also be observed in these slices. Corresponding coronal orientation T1W (LN of low signal intensity) images and fat-suppressed T2W (LN of high signal intensity) images are shown in Figs. 3E and 3F. Moreover, in the presence of immune system stimulation (presence of PDAC tumors), secondary follicles or germinal centers were observed in the LNs (Fig. 3B).
Figure 3.
H&E-stained histology. The slices of whole left inguinal LN from a normal (A) and a PDAC tumor-bearing mouse (B) were obtained using TissueFAXS system. C and D are high magnification images corresponding to the inset (White Square) in A and B, respectively. The corresponding LNs were appeared in the T1W and T2W images (E and F). Scale bars: A, B = 5 mm; C, D = 50 μm. MRI resolution is 0.14 × 0.14 × 0.14 mm3.
3.4 Lymph node size measurements
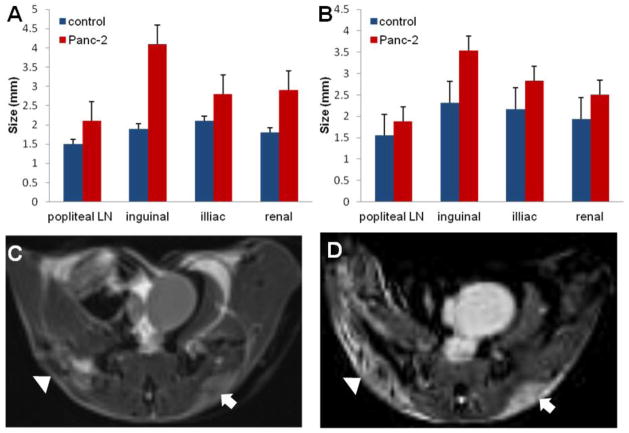
The popliteal, inguinal, iliac, and renal LNs were measured in vivo using HR-MRI (Fig. 4A) and ex vivo after ink staining using a caliper (Fig. 4B). With exception of the popliteal LN, for both MRI and ex vivo caliper approaches, there were significant differences between LN sizes measured in control and PDAC tumor-bearing mice (Table 1). The inguinal, iliac, and renal lymph nodes were significantly smaller in controls compared to PDAC tumor-bearing mice (all p-values were < 0.05, except for the popliteal LNs, where p > 0.05). Representative T1W and T2W images of a tumor in the same mouse are shown in Figs. 4C and 4D, respectively. In vivo MRI LN size measurements were highly correlated to ex vivo caliper-based LN size measurements for both controls (Fig. 5A) and PDAC tumor-bearing mice (Fig. 5B).
Figure 4.
Lymph node size measurements. The LN size measurements in vivo using HR-MRI (A) and ex vivo using a caliper (B) exhibited that the LNs in a normal mice were significantly smaller than those of the corresponding LNs in a PDAC tumor-bearing mice (all P-values were < 0.05, except in the popliteal LNs, where p>0.05). Representative T1W and T2W images of tumors in the same mouse are shown in C and D, respectively. MRI resolution is 0.14 × 0.14 × 0.14 mm3.
Table 1.
LN measurements
| LN | HR-MRI measurement in vivo | Caliper measurement ex vivo | ||||
|---|---|---|---|---|---|---|
| C-mouse | T-mouse | p value | C-mouse | T-mouse | p value | |
| Popliteal LN | 1.52 ± 0.44 | 1.8 ± 0.29 | 0.22 | 1.55 ± 0.42 | 1.88 ± 0.21 | 0.15 |
| Inguinal LN | 2.68 ± 0.52 | 3.67 ± 0.50 | 0.00 | 2.32 ± 0.71 | 3.53 ± 0.84 | 0.02 |
| Iliac LN | 2.13 ± 0.15 | 2.97 ± 0.59 | 0.00 | 2.17 ± 0.27 | 2.83 ± 0.64 | 0.04 |
| Renal LN | 2.05 ± 0.35 | 2.42 ± 0.37 | 0.01 | 1.93 ± 0.10 | 2.59 ± 0.56 | 0.04 |
LN: Lymph node, C-mouse: Control mouse, T-mouse: Tumor mouse
Figure 5.
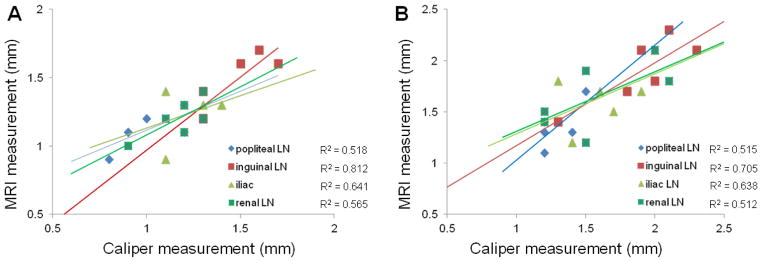
Graphs show the relationship between HR-MRI measurements in vivo and ex vivo 1% India ink measurements of LNs from normal mice (A) and panc-2 mice (B) (each n = 6), the 95% confidence interval for linear regression of size on HR-MRI. There was a strong correlation between the MRI and caliper measurements in each LN (A and B).
4. DISCUSSION
The broad availability of mouse models has significantly benefited the cancer research community. Non-invasive approaches to monitor disease progression and therapy response have rapidly developed to permit serial longitudinal measurements in individual mice thus avoiding confounding factors that can arise when attempting to compare measurements between sub-groups sacrificed at different time-points. The accurate identification of LNs in these mice may be critical for studies investigating cancer metastasis(Hompland et al., 2012; Hung et al., 2012), regional immune responses(Zheng and Shu, 2011; Nguyen-Hoai et al., 2012), and therapy response(Ruddell et al., 2008; Zheng and Shu, 2011; Buettner and Bode, 2012; Helle et al., 2012; Noh et al., 2012). Standard dissection techniques are challenging and can only provide endpoint data(Harrell et al., 2008). In this work, we demonstrated the potential to use HR-MRI techniques as a non-invasive imaging assay for visualizing mouse LNs in vivo.
In this study, non-invasive HR-MRI measurements were compared to invasive ex vivo LN size measurements in both normal mice and mice with implanted with PDAC tumors. HR-MRI LN size measurements were well correlated to reference standard LN size measurements performed at necropsy with India ink staining.
The current study had several limitations. First, measuring LN size in the mouse at one time point, additional studies may be valuable to determine the reproducibility including more mouse groups at different time points. Furthermore, it is feasible to measure the volume of a LN on MR images instead of the longest diameter measurements in vivo. However, the LN size and volume should be shape change (shrinkage) once a LN is removed from the body and is not supported by surrounding tissues. On the other hand, ex vivo measurements are not reproducible and reliable, which depend on measure approaches and individual researchers. Finally, MRI measurements of LN diameter were performed manually; several image segmentation algorithm techniques will be applied in our future studies.
Both approaches detected significantly larger LNs in tumor bearing animals compared to the LNs in normal mice. The major physical alteration induced by these tumors was the significant enlargement of the tumor-draining LNs. These enlarged LNs play active roles in tumor-induced lymph flow(Rudin et al., 2005; Lv et al., 2009). Thus, these methods may be useful not only for the identification and mapping of LNs but also for the diagnosis of tumor-associated changes in the LNs themselves. HR-MRI could serve as a tool to evaluate real-time changes in the lymphatic system associated with cancer progression.
5. CONCLUSION
In summary, HR-MRI approaches offer an effective non-invasive means for LN visualization and size measurements well suitable for longitudinal mouse model studies of cancer progression and therapeutic intervention. This non-invasive LN mapping approach should have broad applicability to mouse model studies requiring serial assessments of lymphatic system function.
Acknowledgments
We thank Jodi Nicolai for cell culture support. This wok was supported by ACS SP0011492 (ZZ), NCI CA134719, funds from the NIH Clinical and Translational Science Awards Program (Northwestern University UL1RR0254741), and National Natural Science Foundation of China (NSFC81220108011).
Footnotes
AUTHOR CONTRIBUTION
Z.Z. and A.L. designed and managed the project. D.P., Z.Z., Y.H., and G.H and A.L. optimized MRI parameters. Z.Z. and D.P. performed the MRI examinations. K.L. performed the tissue collection and pathologic analysis. Z.Z., G.H., H.Y., and K.L. performed the MRI morphology. Z.Z., G.H., H.Y., H. K., and K.L. performed the image analysis. Z.Z., K.L., A.L., H. K and Y.H. analyzed the MR images related to the pathogenic characteristics. Z.Z. performed data submission. Z.Z. and A.L. wrote the paper.
COMPETING FINANCIAL INTERESTS
The authors declare no competing financial interests.
Publisher's Disclaimer: This is a PDF file of an unedited manuscript that has been accepted for publication. As a service to our customers we are providing this early version of the manuscript. The manuscript will undergo copyediting, typesetting, and review of the resulting proof before it is published in its final citable form. Please note that during the production process errors may be discovered which could affect the content, and all legal disclaimers that apply to the journal pertain.
References
- Buettner M, Bode U. Lymph node dissection--understanding the immunological function of lymph nodes. Clin Exp Immunol. 2012;169:205–12. doi: 10.1111/j.1365-2249.2012.04602.x. [DOI] [PMC free article] [PubMed] [Google Scholar]
- Deneve JL, Hoefer RA, Jr, Harris EE, Laronga C. Accelerated partial breast irradiation: a review and description of an early north american surgical experience with the intrabeam delivery system. Cancer Control. 2012;19:295–308. doi: 10.1177/107327481201900406. [DOI] [PubMed] [Google Scholar]
- Galon J, Franck P, Marincola FM, Angell HK, Thurin M, Lugli A, Zlobec I, Berger A, Bifulco C, Botti G, Tatangelo F, Britten CM, Kreiter S, Chouchane L, Delrio P, Hartmann A, Asslaber M, Maio M, Masucci GV, Mihm M, Vidal-Vanaclocha F, Allison JP, Gnjatic S, Hakansson L, Huber C, Singh-Jasuja H, Ottensmeier C, Zwierzina H, Laghi L, Grizzi F, Ohashi PS, Shaw PA, Clarke BA, Wouters BG, Kawakami Y, Hazama S, Okuno K, Wang E, O’Donnell-Tormey J, Lagorce C, Pawelec G, Nishimura MI, Hawkins R, Lapointe R, Lundqvist A, Khleif SN, Ogino S, Gibbs P, Waring P, Sato N, Torigoe T, Itoh K, Patel PS, Shukla SN, Palmqvist R, Nagtegaal ID, Wang Y, D’Arrigo C, Kopetz S, Sinicrope FA, Trinchieri G, Gajewski TF, Ascierto PA, Fox BA. Cancer classification using the Immunoscore: a worldwide task force. J Transl Med. 2012;10:205. doi: 10.1186/1479-5876-10-205. [DOI] [PMC free article] [PubMed] [Google Scholar]
- Harrell MI, Iritani BM, Ruddell A. Lymph node mapping in the mouse. J Immunol Methods. 2008;332:170–4. doi: 10.1016/j.jim.2007.11.012. [DOI] [PMC free article] [PubMed] [Google Scholar]
- Helle M, Cassette E, Bezdetnaya L, Pons T, Leroux A, Plenat F, Guillemin F, Dubertret B, Marchal F. Visualisation of Sentinel Lymph Node with Indium-Based near Infrared Emitting Quantum Dots in a Murine Metastatic Breast Cancer Model. PLoS One. 2012;7:e44433. doi: 10.1371/journal.pone.0044433. [DOI] [PMC free article] [PubMed] [Google Scholar]
- Hompland T, Ellingsen C, Ovrebo KM, Rofstad EK. Interstitial fluid pressure and associated lymph node metastasis revealed in tumors by dynamic contrast-enhanced MRI. Cancer Res. 2012;72:4899–908. doi: 10.1158/0008-5472.CAN-12-0903. [DOI] [PubMed] [Google Scholar]
- Hung SW, Chiu CF, Chen TA, Chu CL, Huang CC, Shyur LF, Liang CM, Liang SM. Recombinant viral protein VP1 suppresses HER-2 expression and migration/metastasis of breast cancer. Breast Cancer Res Treat. 2012;15:15. doi: 10.1007/s10549-012-2238-7. [DOI] [PubMed] [Google Scholar]
- Kennecke HF, Speers CH, Ennis CA, Gelmon K, Olivotto IA, Hayes M. Impact of routine pathology review on treatment for node-negative breast cancer. J Clin Oncol. 2012;30:2227–31. doi: 10.1200/JCO.2011.38.9247. [DOI] [PubMed] [Google Scholar]
- Kimber I, Cumberbatch M, Dearman RJ, Bhushan M, Griffiths CE. Cytokines and chemokines in the initiation and regulation of epidermal Langerhans cell mobilization. Br J Dermatol. 2000;142:401–12. doi: 10.1046/j.1365-2133.2000.03349.x. [DOI] [PubMed] [Google Scholar]
- Lee SY, Qian CN, Ooi AS, Chen P, Wong BH, Myint SS, Wong JC, Hwang JS, Khee Chee S. Changes in specialized blood vessels in lymph nodes and their role in cancer metastasis. J Transl Med. 2012;10:206. doi: 10.1186/1479-5876-10-206. [DOI] [PMC free article] [PubMed] [Google Scholar]
- Lv L, Yan GY, Zhao YL, He XJ, Jiang X, Zhuo YQ, Wang YL, Wang L, Cen XB. Investigation of the dermal sensitizing potential of traditional medical extracts in local lymph node assays. Exp Biol Med (Maywood) 2009;234:306–13. doi: 10.3181/0809-RM-281. [DOI] [PubMed] [Google Scholar]
- Melancon MP, Wang Y, Wen X, Bankson JA, Stephens LC, Jasser S, Gelovani JG, Myers JN, Li C. Development of a macromolecular dual-modality MR-optical imaging for sentinel lymph node mapping. Invest Radiol. 2007;42:569–78. doi: 10.1097/RLI.0b013e31804f5a79. [DOI] [PMC free article] [PubMed] [Google Scholar]
- Nguyen-Hoai T, Baldenhofer G, Ahmed MS, Pham-Duc M, Gries M, Lipp M, Dorken B, Pezzutto A, Westermann J. CCL19 (ELC) improves TH1-polarized immune responses and protective immunity in a murine Her2/neu DNA vaccination model. J Gene Med. 2012;14:128–37. doi: 10.1002/jgm.1651. [DOI] [PubMed] [Google Scholar]
- Noh YW, Kong SH, Choi DY, Park HS, Yang HK, Lee HJ, Kim HC, Kang KW, Sung MH, Lim YT. Near-infrared emitting polymer nanogels for efficient sentinel lymph node mapping. ACS Nano. 2012;6:7820–31. doi: 10.1021/nn301949y. [DOI] [PubMed] [Google Scholar]
- Ruddell A, Harrell MI, Minoshima S, Maravilla KR, Iritani BM, White SW, Partridge SC. Dynamic contrast-enhanced magnetic resonance imaging of tumor-induced lymph flow. Neoplasia. 2008;10:706–13. doi: 10.1593/neo.08342. 1 p following 713. [DOI] [PMC free article] [PubMed] [Google Scholar]
- Rudin M, McSheehy PM, Allegrini PR, Rausch M, Baumann D, Becquet M, Brecht K, Brueggen J, Ferretti S, Schaeffer F, Schnell C, Wood J. PTK787/ZK222584, a tyrosine kinase inhibitor of vascular endothelial growth factor receptor, reduces uptake of the contrast agent GdDOTA by murine orthotopic B16/BL6 melanoma tumours and inhibits their growth in vivo. NMR Biomed. 2005;18:308–21. doi: 10.1002/nbm.961. [DOI] [PubMed] [Google Scholar]
- Tournoy KG, Keller SM, Annema JT. Mediastinal staging of lung cancer: novel concepts. Lancet Oncol. 2012;13:e221–9. doi: 10.1016/S1470-2045(11)70407-7. [DOI] [PubMed] [Google Scholar]
- Zheng R, Shu S. Immune response to cancer and its regulation in regional lymph nodes. J Surg Oncol. 2011;103:550–4. doi: 10.1002/jso.21692. [DOI] [PubMed] [Google Scholar]


