

Abstract
There is increasing recognition that the host response to critical illness includes derangement of multiple amino acid pathways, including amino acids (AAs) central to metabolism and immune, endothelial and neurological function. To characterise concentration changes of these plasma amino acid we report the development and validation of a method for the quantification of AAs in small volumes of plasma (50 μL) using HPLC with simultaneous UV and fluorescence (FL) detection. Protein precipitation and pre-column derivatization with 6-aminoquinolyl-N-hydroxysuccinimidyl carbamate (AQC) is followed by reversed phase HPLC separation. Calibration curves were built with norleucine as an internal standard. Thirty three (including the 20 proteinogenic) AAs, were selected as standards and their corresponding concentrations in the plasma of healthy human controls and patients with severe falciparum malaria were quantified. This method enables the detection of perturbations in arginine metabolism, aromatic amino acid pathways, methionine transsulfuration and transmethylation pathways and other metabolic pathways.
Keywords: Amino acids, malaria, critical illness, HPLC
1. Introduction
Analysis of plasma amino acids is important in understanding mechanisms of disease in critical illness. Severe malaria, severe sepsis and other critical illnesses are characterised by the derangement of multiple enzymatic pathways and altered concentrations of multiple amino acids and their metabolites, many of which are at the limits of detection or quantification in mild illness or in healthy individuals. This complexity requires careful optimisation of separation methods to avoid overlapping peaks using HPLC. Small volumes of plasma, available from children and critically unwell patients, also require a highly sensitive method for quantitative analysis. Altered amino acid synthesis, catabolism and recycling have been observed with impaired endothelial, immune and neurological function in critical illness. Changes in plasma AAs include those involved in the arginine-NO pathway (arginine, citrulline, ornithine, glutamine) [1-6], indoleamine 2,3-dioxygenase pathway (kynurenine and tryptophan) [7-9] and phenylalanine hydroxylase-dependent catabolism (phenylalanine and tyrosine)[5].
Currently a range of analytical platforms, equipped with diverse modes of separation and detection, are used for the analysis of AAs in assorted matrices. Liquid chromatography with tandem mass spectrometry (LC-MS/MS) has been widely applied for qualitative and quantitative analysis of AAs due to the advantage of high specificity compared with the classical optical detection method i.e. UV and FL. However the high cost of equipment, limited availability of isotope-labelled standards, issue of ion suppression, complication of data interpretation and variable reproducibility are problems associated with LC-MS/MS in the delivery of an accurate and broad spectral (over 30 individual compounds) analysis of AAs. HPLC methods using pre-column derivatization with AQC and reversed phase column separation, followed by UV and FL detection, have been well established to provide simple, accurate, reliable and low cost solutions to AAs quantification [10-13].
We report here a protocol for an extensive quantitative analysis of AAs in plasma from patients with critical illness. Thirty three (including the 20 proteinogenic) AAs can be reliably and simultaneously quantitated using this method, with their quantification ranges optimised to span the spectrum of concentrations seen from healthy humans to fatal severe falciparum malaria. In particular, this is the first report of simultaneous determination of arginine, cystathionine, citrulline, kynurenine, tryptophan, phenylalanine and tyrosine; which have been linked to pathogenesis of severe malaria, sepsis and other acute inflammatory diseases
2. Materials and methods
2.1. Materials
All AAs and sodium acetate trihydrate were purchased from Sigma-Aldrich-Fluka. HPLC grade acetonitrile was obtained from Burdick and Jackson (Muskego, MI, USA), absolute ethanol was a Scharlau product, glacial acetic acid and 32% HCl were purchased from Merck. Deionised water (18 MΩ resistivity) was used to prepare all aqueous solutions and the mobile phases. A derivatization reagent, AccQ-Fluor™ reagent kit was supplied by Waters (Milford, MA, USA).
2.2. Plasma samples
Venous blood from healthy volunteers or malaria patients was collected into lithium heparin tubes (Vacutainer, Becton Dickinson, Franklin Lakes, New Jersey), centrifuged (492 × g for 8min) within 30 min of collection and the plasma was aspirated and frozen at −80 °C until analysis [1]. A pool of plasma from healthy Australian blood donors (n = 2) was used as quality control (QC) plasma. QC plasma was spiked with kynurenine to increase the endogenous level above the limit of quantification of the method. The use of the QC plasma was approved by the Ethics Committees of the Australian Red Cross and Menzies School of Health Research.
2.3. Sample preparation
Plasma samples or standards were centrifuged at 10,000 × g for 1 min before 50uL of each supernatant was mixed with 50 μL of 90 μM norleucine in a 1.7 mL plastic Eppendorf tube and vortexed briefly. 200 μL of ice-cold ethanol was then added and vortexed to mix. The mixture was centrifuged 10,000 × g for 2 min. 15 μL of the supernatant was added to 65 μL of borate buffer (AccQ-Fluor™ kit) in a 250 μL HPLC vial insert, and then reacted with 20 μL AccQ-Fluor™ reagent by immediate vortexing for 10 s.
2.4. Chromatography
The HPLC system consisted of a Shimadzu LC-10ADVP pump (flow rate: 0.65 mL min−1), a SIL-10ADVP autosampler (inject volume: 10 μL), a CTO-10AS VP column oven, a SPD-10AVP UV-vis detector and a RF-10AXL FL detector. The detectors were connected in series. Derivitized extracts were separated on two C18 Gemini-NX analytical columns (150 mm×4.6 mm, 3 μm) connected in series and protected by a C18 security guard cartridge (4.0mm×3.0 mm). Analytical columns and guard cartridges were purchased from Phenomenex (Lane Cove, NSW, Australia).
Two 1 M stock solutions of sodium acetate buffers were prepared at different pH using glacial acetic acid: stock A, pH 4.90 and stock B, pH 5.85. One litre of mobile phase A consisted of 50 mL buffer stock A and 20 g ethanol, made to volume with water. Mobile phase D was a 1:50 dilution of buffer stock B. Mobile phases B and C were acetonitrile and water respectively. Gradient conditions are shown in Table 1.
Table 1.
Gradient program for the separation of free amino acids in plasma.
| Time (min) | Conc. of channel (%) | Oven Temp (°C) | |||
|---|---|---|---|---|---|
|
| |||||
| A | B | C | D | ||
| 0.0 | 97.8 | 2.2 | 0.0 | 0.0 | 42 |
| 2.0 – 29.0 | 96.1 | 3.9 | 0.0 | 0.0 | |
| 38.0 – 45.0 | 90.0 | 10.0 | 0.0 | 0.0 | 38 at 42.1 min |
| 48.0 | 80.0 | 10.0 | 0.0 | 10.0 | |
| 57.0 | 43.5 | 16.5 | 0.0 | 40.0 | |
| 60.0 | 32.9 | 17.1 | 0.0 | 50.0 | |
| 65.0 – 95.0 | 32.0 | 18.0 | 0.0 | 50.0 | |
| 95.10 – 98.0 | 0.0 | 20.0 | 80.0 | 0.0 | 42 at 97.1 min |
| 98.1 – 113.0 | 0.0 | 80.0 | 20 | 0.0 | |
Concentrations for Hyp, Asp, Asn, Glu, Gln, Gly, Ser, Tau, 3-MH and Cit were determined from the fluorescence trace (Ex. 250 nm, Em. 395 nm) and by UV absorbance (250 nm) for the remaining AAs. Standard abbreviations for amino acids were used (Table 2).
Table 2.
Validation data for 33 amino acids.
| Amino acid | Abbr. | Linear range (μM) | LOD (μM) | LOQ (μM) | r2 | Mean recovery (%) | Mean Accuracy (%) | Precision (%) | ||
|---|---|---|---|---|---|---|---|---|---|---|
|
| ||||||||||
| QC mean (μM) | Intraday (n = 6) | Interday (n = 3) | ||||||||
| (E)-4-Hydroxy-L-prolinea | Hyp | 8.08 - 258.67 | 1.97 | 5.98 | 0.9996 | 102.1637 | 103.3 | 9.7 | 0.8 | 1.6 |
| L-Aspartatea | Asp | 6.91 – 221.17 | 1.21 | 3.68 | 0.9999 | 101.5535 | 103.1 | 6.7 | 1.8 | 6.7 |
| L-Asparaginea | Asn | 7.76 – 248.37 | 3.44 | 10.42 | 0.9997 | 101.689 | 102.2 | 42.6 | 0.5 | 2.2 |
| L-Serinea | Ser | 12.32 - 394.33 | 7.31 | 22.15 | 0.9994 | 105.417 | 110.5 | 111.5 | 0.6 | 2.6 |
| L-Glutamatea | Glu | 9.75 – 394.33 | 4.97 | 15.05 | 0.9996 | 109.3543 | 111.7 | 90.3 | 1.4 | 24.4 |
| L-Glutaminea | Gln | 38.90 – 311.19 | 1.62 | 4.91 | 0.9999 | 96.5276 | 97.7 | 402.5 | 0.6 | 2.8 |
| L-Glycinea | Gly | 15.12 - 241.91 | 3.58 | 10.85 | 0.9998 | 97.7022 | 99.9 | 225.5 | 0.7 | 2.5 |
| L-Histidine | His | 12.02 – 384.64 | 3.89 | 11.78 | 0.9996 | 97.4088 | 97.8 | 79.7 | 1.4 | 3.8 |
| Sarcosine | Sar | 1.35 - 43.10 | 0.17 | 0.52 | 0.9999 | 91.773 | 92.7 | BLQb | n/a | n/a |
| 1-Methyl-Histidine | 1-MH | 3.84 - 61.47 | 1.24 | 3.75 | 0.9974 | 101.5058 | 94.6 | 3.8 | 6.6 | 5.0 |
| L-Taurinea | Tau | 13.27 - 424.64 | 8.06 | 24.42 | 0.9994 | 98.1937 | 100.3 | 83.1 | 1.6 | 3.1 |
| 3-Methyl-Histidinea | 3-MH | 2.17 – 41.61 | 0.72 | 2.17 | 0.9995 | 91.4249 | 91.7 | 3.8 | 4.3 | 7.1 |
| L-Citrullinea | Cit | 7.25 - 231.96 | 4.66 | 14.11 | 0.9993 | 94.5726 | 96.7 | 27.2 | 2.1 | 4.9 |
| L-Arginine | Arg | 12.01 – 384.24 | 3.71 | 11.24 | 0.9998 | 101.8934 | 102.2 | 69.7 | 1.1 | 3.4 |
| L-Threonine | Thr | 13.73 – 439.29 | 5.46 | 16.55 | 0.9997 | 102.1721 | 103.1 | 102.2 | 1.3 | 2.1 |
| L-Alanine | Ala | 27.84 – 890.78 | 2.13 | 6.45 | 0.9999 | 101.0688 | 102.4 | 344.9 | 0.9 | 1.6 |
| Homoarginine | Har | 1.20 - 38.45 | 0.19 | 0.58 | 0.9999 | 94.6608 | 96.2 | 1.8 | 0.0 | 0.0 |
| L-Proline | Pro | 12.29 – 403.02 | 4.35 | 13.20 | 0.9998 | 103.3242 | 102.2 | 163.5 | 0.8 | 2.0 |
| Ethanolamine | EA | 3.52 – 112.64 | 1.07 | 3.23 | 0.9999 | 98.109 | 99.1 | 8.1 | 5.9 | 6.3 |
| L-Cystathionine | Cysta | 0.92 - 29.51 | 0.31 | 0.94 | 0.9998 | 94.5376 | 95.3 | BLQ | n/a | n/a |
| β-Aminoisobutyric acid | βAIBA | 2.56 - 51.21 | 0.84 | 2.56 | 0.9989 | 88.172 | 94.0 | BLQ | n/a | n/a |
| DL-α-Amino-n-butyric acid | αABA | 5.09 - 162.95 | 1.47 | 4.45 | 0.9999 | 100.697 | 101.0 | 18.9 | 0.6 | 0.8 |
| L-Cystine | (Cys)2 | 6.20 – 198.42 | 1.53 | 4.64 | 0.9998 | 88.476 | 87.6 | 21.0 | 2.0 | 23.6 |
| L-Tyrosine | Tyr | 13.09- 418.93 | 4.15 | 12.56 | 0.9998 | 102.6048 | 102.4 | 72.2 | 0.7 | 1.7 |
| L-Valine | Val | 16.30 - 521.72 | 5.41 | 16.40 | 0.9998 | 103.314 | 102.8 | 178.8 | 0.8 | 1.9 |
| L-Methionine | Met | 11.46 - 366.76 | 3.72 | 11.28 | 0.9998 | 102.918 | 102.0 | 21.7 | 2.3 | 2.7 |
| L-Ornithine | Orn | 12.34 – 394.78 | 3.09 | 9.37 | 0.9999 | 101.8056 | 101.4 | 44.1 | 0.5 | 1.6 |
| L-Lysine | Lys | 14.59 – 466.78 | 3.12 | 9.46 | 0.9999 | 103.1238 | 101.4 | 182.0 | 0.7 | 1.8 |
| L-Isoleucine | Ile | 11.51 - 368.35 | 3.56 | 10.80 | 0.9998 | 104.6493 | 102.9 | 51.1 | 0.9 | 3.0 |
| L-Leucine | Leu | 11.55 – 369.57 | 3.08 | 9.34 | 0.9999 | 102.5066 | 102.2 | 101.7 | 1.0 | 1.6 |
| L-Kynurenine | Kyn | 1.84 - 39.96 | 0.61 | 1.84 | 0.9996 | 99.4976 | 94.4 | 2.0 | 4.3 | 3.1 |
| L-Phenylalanine | Phe | 15.80 – 505.60 | 5.65 | 17.12 | 0.9995 | 100.2892 | 101.2 | 53.7 | 0.9 | 1.9 |
| L-Tryptophan | Try | 5.88 - 188.05 | 1.29 | 3.92 | 0.9998 | 104.1418 | 102.2 | 52.7 | 1.6 | 0.6 |
Calculated using FL detection.
Below limit of quantification.
2.5. Calibration and validation
Stock solutions of both AA standards mixture and norleucine (internal standard) were prepared in 0.1 M HCl, aliquoted and stored at −80 oC. The norleucine working solution (90 μM) was a 3:100 dilution of norleucine stock solution (3 mM in 0.1 M HCl) with 0.04 M HCl. In the stock solutions of AA standards mixtures, a range of initial concentrations were selected to encompass physiological and disease-associated concentration ranges. Six calibration standards were made by diluting the stock solutions with water. The working range of each individual amino acid is shown in Table 2. A calibration curve (with six levels) for each analyte, using peak area/amount ratios of the analytes to internal standard was constructed from integrated chromatograms.
In order to determine the accuracy of the method, the pooled QC plasma was spiked with standards at three different concentrations and repeated in triplicate. Recovery was determined by comparing the peak areas of analytes between the un-extracted standards and the pooled QC plasma spiked with standards, at three different concentrations, through the extraction process [14]. The limit of detection (LOD) and the limit of quantification (LOQ) were calculated as 3.3α/S and 10α/S, respectively, where α is the standard deviation of y-intercept and S is the slope of regression line [15]. The intra-assay precision of the method was determined by running six QC samples consecutively and calculating the concentration of the analytes of interest. Inter-assay precision was calculated by running QC samples over three different days.
3. Results and discussion
3.1. Chromatography
This method provided detection of 33 AA derivatives using a combination of UV and FL detection. The concentrations of Glu, Gln and Gly were determined by FL chromatography due to the large interfering peak of 6-aminoquinoline (AMQ) in the UV chromatogram (Fig. 1). Hyp, Asp, Asn, Ser, Tau, 3-MH and Cit were also calculated by FL chromatography as the peak responses were higher with FL detection than with UV detection. The concentrations of the remaining AAs were calculated from the UV trace as their separation from other AQC-reacting molecules, of unknown identity in plasma samples, was superior to that with the FL trace. Some derivatized AAs of interest, such as Cysta, Kyn and Try were poorly visible, or undetectable using FL detection at λex/λem = 250/395 nm. UV detection was essential for these AAs and allowed an extra means of identification if co-eluting peaks occurred in plasma.
Fig. 1.
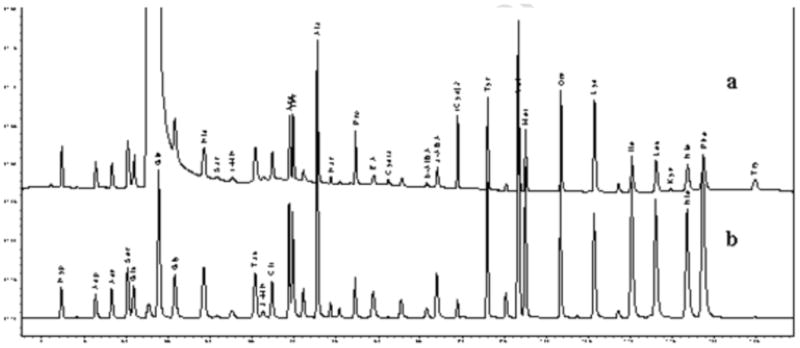
Chromatogram of standards mixture: (a) the UV channel; (b) the FL channel.
3.2. Method validation
The results of linearity of calibration curves with correlation coefficients are shown in Table 2. For most of the analytes, the r2 was higher than 0.999 except 1-MH (0.997). LOD values obtained in this work indicated that the current method is sensitive enough to detect the targeted analytes in the QC. Three AAs, Sar, Cysta and βAIBA in the QC sample were below the LOQ of the method. The average recovery values of AAs ranged between 93.8 and 107.3%. The accuracy ranged between 91.7 – 103.3% for most of the AAs analysed. However, the accuracy value of (Cys)2 was only 87.6%. A similar pattern was also found in interday precision valuation, i.e., high RSD with (Cys)2 (23.6 %) with all others <7.1%, except for Glu (24.4%). Poor interday precision of Glu has been reported previously [16]. Glutamine concentrations in plasma and solution can be unstable and glutamine deamidates under adverse conditions [17, 18]. In terms of intraday repeatability, no RSD exceeded 6.7 %. In addition to the validation results, the plasma amino acid concentrations measured in the healthy adults (Table 2) all fell within published reference ranges [19-21].
3.3. Strengths and limitations of the assay
This method was developed for the simultaneous determination of 33 derivatized AAs and compounds in critical illness. This method has been used to quantitate AAs in plasma samples from patients with severe malaria and severe sepsis [3, 8, 9]. Among these AAs, Arg, Cysta, Kyn, Try, Phe and Tyr have been linked to pathogenesis of severe malaria and sepsis [1, 3, 4, 8, 9]. Representative amino acid profiles of a SM patient and a health QC volunteer are shown in Fig. 2 and demonstrate the ability to separate the multiple peaks of amino acids and their metabolites seen in critical illness. Most of the AAs can be measured with baseline chromatographic separation. Only 50 μL of plasma volume is required without compromising sensitivity, making the assay suitable in patient populations in which only small blood volumes are available for testing, including children and critical illness.
Fig. 2.
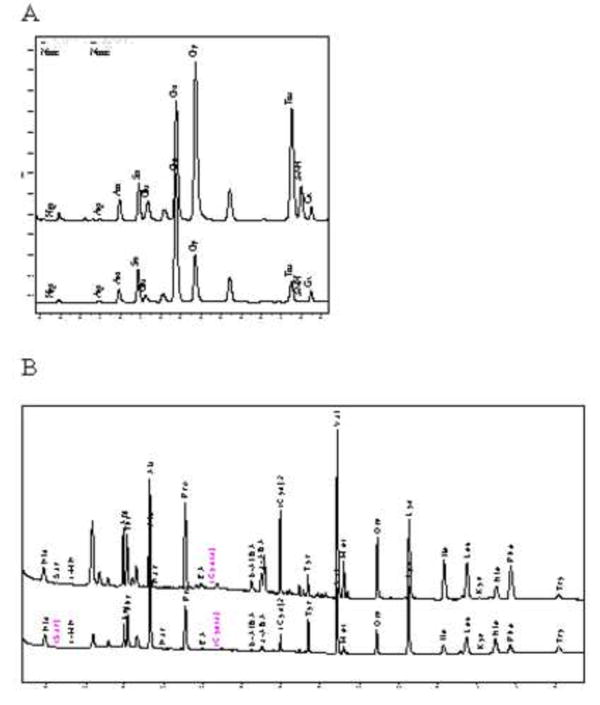
Comparison of Amino acids profiles (1: FL; 2: UV) from A: a plasma sample from a patient with severe falciparum malaria, B: Quality Control plasma pooled from healthy Australian blood donors.
A disadvantage of this method is the long running time, due to the limitations inherent in HPLC systems and the complexity of biological samples and disease states. Cystine and homocystine failed to pass validation. These thiol dimers need to be reduced and analysed separately to achieve quantitative results [22]. It is also worthy of note that although 33 AAs were included in this method, there are still other clinically important AAs such as asymmetric dimethylarginine (ADMA) and symmetric dimethylarginine (SDMA) cannot be monitored by this method. Instead, a separated method has been developed as reported [23].
Importantly, as this method achieves accurate and precise results from small volumes of plasma it is particularly useful for research into critical illness.
Highlights.
A sensitive and reliable method for quantitation of 33 Amino acids was developed and validated.
This method was applied to small plasma volumes from patients with critical illness.
Simultaneous determination of Arg, Cit, Kyn, Try and Phe which have been linked to pathogenesis of severe malaria and sepsis.
Acknowledgments
The authors thank Barbara MacHunter and Jessica Loughland for the assistance in sample preparation.
Funding: The study was funded by the National Health and Medical Research Council of Australia (NHMRC Program Grants 290208, 496600 and Practitioner Fellowship 490307) and National Institutes of Health (AI041764). The funders had no role in the study design, or in the collection, analysis and interpretation of data; in the writing of the report and in the decision to submit the article for publication.
Abbreviations
- FL
fluorescence
Footnotes
Conflict of interest statement: The authors do not have a commercial or other association that might pose a conflict of interest.
Publisher's Disclaimer: This is a PDF file of an unedited manuscript that has been accepted for publication. As a service to our customers we are providing this early version of the manuscript. The manuscript will undergo copyediting, typesetting, and review of the resulting proof before it is published in its final citable form. Please note that during the production process errors may be discovered which could affect the content, and all legal disclaimers that apply to the journal pertain.
References
- 1.Davis JS, Anstey NM. Critical Care Medicine. 2011;39:380. doi: 10.1097/CCM.0b013e3181ffd9f7. [DOI] [PubMed] [Google Scholar]
- 2.Davis J, Yeo T, Thomas J, McMillan M, Darcy C, McNeil Y, Cheng A, Celermajer D, Stephens D, Anstey N. Critical Care. 2009;13:R155. doi: 10.1186/cc8055. [DOI] [PMC free article] [PubMed] [Google Scholar]
- 3.Yeo TW, Lampah DA, Gitawati R, Tjitra E, Kenangalem E, McNeil YR, Darcy CJ, Granger DL, Weinberg JB, Lopansri BK, Price RN, Duffull SB, Celermajer DS, Anstey NM. Journal of Infectious Diseases. 2008;198:602. doi: 10.1086/590209. [DOI] [PMC free article] [PubMed] [Google Scholar]
- 4.Yeo TW, Lampah DA, Gitawati R, Tjitra E, Kenangalem E, McNeil YR, Darcy CJ, Granger DL, Weinberg JB, Lopansri BK, Price RN, Duffull SB, Celermajer DS, Anstey NM. The Journal of Experimental Medicine. 2007;204:2693. doi: 10.1084/jem.20070819. [DOI] [PMC free article] [PubMed] [Google Scholar]
- 5.Lopansri BK, Anstey NM, Stoddard GJ, Mwaikambo ED, Boutlis CS, Tjitra E, Maniboey H, Hobbs MR, Levesque MC, Weinberg JB, Granger DL. Infect Immun. 2006;74:3355. doi: 10.1128/IAI.02106-05. [DOI] [PMC free article] [PubMed] [Google Scholar]
- 6.Lopansri BK, Anstey NM, Weinberg JB, Stoddard GJ, Hobbs MR, Levesque MC, Mwaikambo ED, Granger DL. Lancet. 2003;361:676. doi: 10.1016/S0140-6736(03)12564-0. [DOI] [PubMed] [Google Scholar]
- 7.Medana IM, Day NP, Salahifar-Sabet H, Stocker R, Smythe G, Bwanaisa L, Njobvu A, Kayira K, Turner GD, Taylor TE, Hunt NH. J Infect Dis. 2003;188:844. doi: 10.1086/377583. [DOI] [PubMed] [Google Scholar]
- 8.Davis JS, Darcy CJ, Yeo TW, Jones C, McNeil YR, Stephens DP, Celermajer DS, Anstey NM. PLoS ONE. 2011;6:e17260. doi: 10.1371/journal.pone.0017260. [DOI] [PMC free article] [PubMed] [Google Scholar]
- 9.Davis JS, Woodberry T, McNeil YR, Stephens DP, Yeo TW, Anstey NM. PLoS One. 2011;6:e21185. doi: 10.1371/journal.pone.0021185. [DOI] [PMC free article] [PubMed] [Google Scholar]
- 10.Pappa-Louisi A, Nikitas P, Agrafiotou P, Papageorgiou A. Analytica Chimica Acta. 2007;593:92. doi: 10.1016/j.aca.2007.04.044. [DOI] [PubMed] [Google Scholar]
- 11.Hernandez-Orte P, Ibarz MJ, Cacho J, Ferreira V. Chromatographia. 2003;58:29. [Google Scholar]
- 12.Bernal JL, Nozal MJ, Toribio L, Diego JC, Ruiz A. Journal of Separation Science. 2005;28:1039. doi: 10.1002/jssc.200500008. [DOI] [PubMed] [Google Scholar]
- 13.Dostalek P, Kabelova I, Dvorakova M, Cizkova H, Melzoch K. J Food Compos Anal. 2008;21:736. [Google Scholar]
- 14.Guidance for Industry, Bioanalytical Method Validation, US Department of Health and HumanServices/Food and Drug Administration/Center for Drug Evaluation and Research, 2001.
- 15.International Conference of Harmonisation (ICH) Harmonised Triparties Guidline-Validation of Analytical Procedures: Methodology Q2B; 1996. [Google Scholar]
- 16.Li J, Piao C, Jin H, Wongpanit K, Manabe N. Anglais. 2009;22:1703. [Google Scholar]
- 17.Eckstein JA, Ammerman GM, Reveles JM, Ackermann BL. Journal of Neuroscience Methods. 2008;171:190. doi: 10.1016/j.jneumeth.2008.02.019. [DOI] [PubMed] [Google Scholar]
- 18.Davis JS, Darcy CJ, Piera K, McNeil YR, Woodberry T, Anstey NM, Anstey NM. BMC Clin Pathol. 2009;9 doi: 10.1186/1472-6890-9-10. [DOI] [PMC free article] [PubMed] [Google Scholar]
- 19.Filho JCD, Bergström J, Stehle P, Fürst P. Clinical nutrition (Edinburgh, Scotland) 1997;16:299. doi: 10.1016/s0261-5614(97)80015-5. [DOI] [PubMed] [Google Scholar]
- 20.Klassen P, Fürst P, Schulz C, Mazariegos M, Solomons NW. American Journal of Clinical Nutrition. 2001;73:647. doi: 10.1093/ajcn/73.3.647. [DOI] [PubMed] [Google Scholar]
- 21.NØRrelund H, Wiggers H, Halbirk M, Frystyk J, Flyvbjerg A, BØTker HE, Schmitz O, JØRgensen JOL, Christiansen JS, MØLler N. Journal of Internal Medicine. 2006;260:11. doi: 10.1111/j.1365-2796.2006.01663.x. [DOI] [PubMed] [Google Scholar]
- 22.Sawula W, Banecka-Majkutewicz Z, Kadzinski L, Jakobkiewicz-Banecka J, Wegrzyn G, Nyka W, Banecki B. Acta Biochim Pol. 2008;55:119. [PubMed] [Google Scholar]
- 23.Jones CE, Darcy CJ, Woodberry T, Anstey NM, McNeil YR. Journal of Chromatography B. 2010;878:8. doi: 10.1016/j.jchromb.2009.10.035. [DOI] [PubMed] [Google Scholar]