Abstract
Objective
Abdominal visceral adiposity is related to risks for insulin resistance and metabolic perturbations. Magnetic resonance imaging (MRI) and computed tomography are advanced instruments that quantify abdominal adiposity; yet field use is constrained by their bulkiness and costliness. The purpose of this study is to develop prediction equations for total abdominal, subcutaneous, and visceral adiposity via anthropometrics, stereovision body imaging (SBI), and MRI.
Design and Methods
Participants (67 men and 55 women) were measured for anthropometrics, and abdominal adiposity volumes evaluated by MRI umbilicus scans. Body circumferences and central obesity were obtained via SBI. Prediction models were developed via multiple linear regression analysis, utilizing body measurements and demographics as independent predictors, and abdominal adiposity as a dependent variable. Cross-validation was performed by the data-splitting method.
Results
The final total abdominal adiposity prediction equation was –470.28+7.10waist circumference–91.01gender+5.74sagittal diameter (R²=89.9%); subcutaneous adiposity was –172.37+8.57waist circumference–62.65gender–450.16stereovision waist-to-hip ratio (R²=90.4%); and visceral adiposity was –96.76+11.48central obesity depth–5.09 central obesity width+204.74stereovision waist-to-hip ratio–18.59gender (R²=71.7%). R² significantly improved for predicting visceral fat when SBI variables were included, but not for total abdominal or subcutaneous adiposity.
Conclusions
SBI is effective for predicting visceral adiposity and the prediction equations derived from SBI measurements can assess obesity.
INTRODUCTION
Obesity is a significant health problem associated with diseases such as diabetes (1), coronary heart disease (2), and nonalcoholic fatty liver (3). In the United States approximately 34.2% of the population is overweight (BMI ≥ 25.0 to 29.9 kg/m2), and 33.8% and 5.7% exhibit obesity (BMI ≥ 30.0 to 39.9 kg/m2) or extreme obesity (BMI ≥ 40 kg/m2), respectively (4).
The most common method to classify the degree of weight status is body mass index (BMI) due to its simplicity. Since values ≥30.0 kg/m2 are linked to greater mortality and morbidity in populations, this method is ideal for epidemiological and preliminary screening in clinical and field settings. However, BMI does not distinguish between those with high muscle mass versus high fat, or the distribution of fat in different regions of the body. The distribution of fat is important as excess subcutaneous fat (underneath the skin) is related to insulin resistance (5) and cardiovascular disease risks (6). In contrast, an abundance of visceral fat (between/around the organs) is associated with diabetes (7), hypertension (8), and metabolic risk factors (9).
Traditional anthropometric measurements ascertained by manual methods are the most commonly utilized for obesity assessment because they are practical, cost-efficient, and the least difficult to obtain. Measurements that reflect central obesity may include waist circumference (10), waist-to-hip ratio (11), skinfold thicknesses (10), and sagittal diameter (12).
Investigations of anthropometric measurements and risk for obesity-related diseases have shown that waist circumference and waist-to-hip ratio are positively related to coronary heart disease in women (11); and that greater waist circumference and thickness of abdominal skin folds are associated with increased risk for metabolic syndrome (13). Also, sagittal diameter appears to be more related to cardiovascular risk factors than waist circumference or waist-to-hip ratio (14).
Manual body measurements are readily accessible, but their accuracy may be subject to low inter-rater reliability, inadequacy of training, and variances in the type of methods utilized (15). For example, Wang et al. (2003) reported 14 different descriptions in three different manuals used as reference guides for measurements of waist circumference (16). In addition, awkwardness is created by the close proximity between researcher and subject. Thus, traditional anthropometric parameters are an imprecise means for accurate measurement of abdominal adiposity. It is clear that devices that incorporate advanced techniques such as magnetic resonance imaging (MRI) or computed tomography (CT) may provide more precise assessment (9). Yet, the large size and high expense associated with these instruments limit their use in field settings. Furthermore, the utilization of dual energy x-ray absorptiometry (DXA) and CT may be precluded by the risk of radiation exposure.
A further step in the assessment of obesity can be the application of mathematical prediction equation models. Traditionally, these models have been developed by combining manual anthropometric measurements (weight, height, BMI, waist-to-hip ratio, sagittal diameter, body circumferences, skinfold thicknesses) and demographic characteristics (age, gender, ethnicity) (17,18). However, the final prediction model is only as precise as the accuracy of the measurements inputted.
This research will test the efficacy of using a method of photogrammetry to be incorporated into prediction models for assessing central obesity. To date, three-dimensional (3-D) body scanners have been utilized for obtaining body images and measurements (19). These scanners are reliable instruments that can replace manual methods to accurately measure body circumferences (20,21). This technique has been proven useful for tailoring clothing for textile manufacturing purposes, as well as for the assessment of obesity (19). The present study will utilize a stereovision body imaging (SBI) system to acquire fast, noncontact 3-D whole body images and measurements in order to develop mathematical models for prediction of total, subcutaneous, and visceral abdominal adiposity. Parameters measured by SBI also will include unique measurements of central obesity, such as central obesity depth and central obesity width. Three variations of measurements will be tested: traditional anthropometrics, stereovision body imaging, and a combination of the two. Accuracy between the prediction models will be compared to determine the best methods for prediction of central obesity.
METHOD AND PROCEDURES
Study Design
The convenience sample consisted of 122 adults who were instructed to fast for 4 hours and avoid heavy exercise, alcohol or caffeine for 10 hours prior to the visit. Subjects made two visits to the: 1) university laboratory and 2) MRI research center.
At visit 1, demographic and health history questionnaires were completed and subjects were assessed for traditional anthropometrics measurements, including weight, height, body circumferences, and sagittal diameter. Body scans were performed via SBI to assess body size, shape, circumferences, composition, and central obesity. At visit 2, MRI scans were obtained for assessment of central adiposity measurements. To minimize errors, all measurements were completed at the laboratory within 3 hours and MRI assessment was made within 5 days.
Subjects
Hispanic and Non-Hispanic White men (n=67) and women (n=55) were recruited for the study via posted notices and word-of-mouth. Participants were aged 18 to 65 years old, with BMI ranging from 18.5 to 39.9 kg/m2. Subjects were excluded from the study for any serious illness that could interfere with their ability to participate. Additionally, individuals who had exposure to metallic fragments or implants were eliminated due to the risks involved with utilizing MRI. Women who were or could be pregnant, or were lactating also were excluded due to university regulations. The study was approved by the University of Texas at Austin Institutional Review Board and informed consent was obtained.
Anthropometrics
Standard protocols for the anthropometric measurements established by the National Institutes of Health guidelines (NIH guidelines) were performed by trained nutrition experts. Subjects were measured for height in centimeters to the nearest 0.1 centimeter without shoes and socks by a stadiometer (Health o meter, South Shelton, CT), and weight in kilograms by an electronic scale (Tanita, Arlington, IL) to the nearest 0.01 kilogram. Body circumferences, including arm, waist, hip, and thigh circumferences, were assessed via a MyoTape body tape measure (AccuFitness, Greenwood Village, CO). Sagittal diameter was measured horizontally from the umbilicus to the back via an abdominal caliper (Lafayette Instrument, Lafayette, IN). BMI was calculated by weight (kg) divided by height (m2). Waist-to-hip ratio was computed by waist circumferences (cm) divided by hip circumferences (cm) and measurement for waist-toheight ratio was obtained by waist circumferences (cm) divided by height (cm).
Stereovision Body Imaging System
Participants wore light-colored undergarments to facilitate accurate measurement of body size and shape with a swimming cap to conceal hair, and a blindfold to protect the eyes from the lights of the projectors. Subjects were instructed to place both arms at their sides with elbows bent, making a fist with both hands, with arms placed about 10 cm away from the body. Legs were spread approximately shoulder-width apart. Each subject remained motionless and was asked to hold their breath for 1 second during the 200-millisecond body scan. A total of ten body scans were obtained in order to acquire the mean value.
The stereovision body imaging system was fabricated with four pairs of monochromatic CMOS cameras (Videre Design, Menlo Park, CA), with a resolution of 1280 × 960, and four ultrashort throw NEC 575VT LCD projectors (NEC Corporation, Tokyo, Japan) (Xu, 2009). Projectors were required to generate artificial texture on the scanned surface since human skin is not rich in texture. Four pairs of cameras simultaneously captured the body image when the body was illuminated by the projectors. The SBI is a novel device that calculates specific body measurements, including volumes, length, breadth, and central obesity parameters, via a rapid and non-invasive method. It can be assembled in a relatively small space and provides visual representation of body size and shape that can be rotated 360° in all directions. Advantages of this system over CT or MRI are: a) portability, which allows it to be used in field setting; b) cost, which is much lower than other equipment available; and c) lack of radiation.
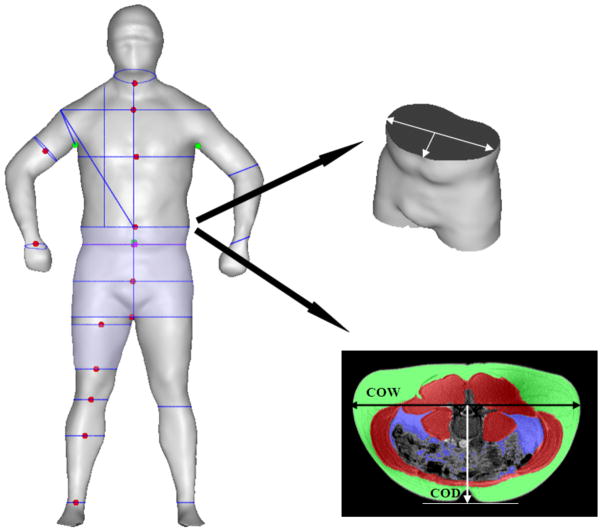
SBI measurements included shoulder, chest, abdomen, hip, crotch, upper thigh, lower thigh, knee, and calf circumferences, as well as central obesity depth and central obesity width. Central obesity width was defined as the largest width on the coronal plane, at the level of the umbilicus. Central obesity depth is the length between the mid-point of the central obesity width and umbilicus. These two measurements lie perpendicularly on the same plane (Figure 1). Measurements for ratios computed were SBI waist-to-hip (waist circumference divided by hip circumference), waist-to-thigh (waist circumference divided by thigh circumference), and waist-to-height (waist circumference divided by height).
Figure 1.
Central obesity depth (COD) and central obesity width (COW) at the umbilicus level with minimal subcutaneous at the nearest site
Magnetic Resonance Imaging
Participants were scanned for MRI via a 3.0 T General Electric scanner (GE Healthcare, Milwaukee, WI). When each subject was positioned on the center of the magnet, a 4-second 3-plane localizer scan was conducted, allowing visualization of anatomical landmarks. A slice of T1 axial images were obtained, centered at the navel, with TR 140, TE 2.1, flip angle 80, slice thickness 8.0 mm, gap 5.0 mm, FOV 40 × 40, matrix size 512 × 192, and bandwidth 62.5 kHz. MRI slices were analyzed by MRI software, SliceOmatic 4.3 (Tomovision, Montreal, CAN). Subcutaneous and visceral adiposity volumes were obtained from the umbilical slice, based on a volume of 3D pixels meeting the adipose shading threshold within the region of interest. The total abdominal volume was computed by summing the calculation for subcutaneous and visceral adiposity volumes.
Statistical Analysis
All statistical analysis and data management were performed using Predictive Analytics Software Statistics 18.0 (IBM SPSS, Chicago, IL). Subjective characteristics were computed as a measure of descriptive statistics and described in terms of a mean, standard error of the mean (SEM), and minimum and maximum values of demographic variables and body measurements. P-values (p) less than 0.05 were adopted for the significance level.
All of the traditional anthropometrics measurements were assessed twice and coefficients of variation of each value were obtained to examine the intra-observer reproducibility of the measurements. Coefficient of variation also was implemented to evaluate the reproducibility of SBI over 10 body scans. Total abdominal, subcutaneous and visceral adiposity volumes were quantified from MRI umbilicus scans by two trained observers to acquire a coefficient of variation to confirm the reliability of the central obesity values. Reproducibility of the traditional anthropometrics, SBI and MRI measurements were assessed from a subset of 50 participants. The value of coefficient of variation was calculated as the standard deviation of the observations divided by the mean of the observations and these values were multiplied by 100 to be expressed as a percentage.
Subjects were assigned randomly into two groups: primary (70%, n = 85) and validation (30%, n = 37). The primary group was used to create prediction equations for estimation of central adiposity initially. Then the prediction equations were fit into the data derived from the validation group to assess the validity of the equations.
Pearson’s correlation coefficients (r) were used to examine relationships between MRI measurements of total abdominal, subcutaneous and visceral fat volumes with a) demographic parameters, b) anthropometric measurements assessed by traditional manual methods, and c) body measurements measured by SBI. A total of nine measurements (gender, waist circumference, waist-to-hip ratio, sagittal diameter, SBI waist circumference, SBI hip circumferences, SBI waist-to-hip ratio, central obesity depth, central obesity width) that exhibited high correlations with abdominal adiposity were selected to be included for the prediction of abdominal adiposity.
Parameters from three methods were applied to develop prediction equations for total abdominal, subcutaneous, and visceral adiposity. These included: 1) traditional anthropometric body measurements (waist circumference, waist-to-hip ratio, sagittal diameter) and demographics (gender) as independent variables; 2) SBI parameters (SBI waist circumference, SBI hip circumferences, SBI waist-to-hip ratio, central obesity depth, and central obesity width) and demographics (gender) as independent variables; and 3) a combination of traditional anthropometrics, SBI measurements, and demographic parameters as independent variables. Gender was dummy coded as women = 0 or men = 1, and ethnicity, as Caucasian = 0 or non-White Hispanic = 1.
Prediction models were developed by conducting stepwise multiple linear regression analysis. Three different methods for independent predictors were applied with dependent variables of abdominal adiposity. Equations that contained the strongest predictor variables were selected as the optimal means for predicting total abdominal, subcutaneous and visceral fat. Independent variables that exhibited a variance inflation factor of higher than 10 in the results were removed to eliminate the impact of collinearity among the variables in a regression model. The remaining independent variables were included in the resultant stepwise multiple linear regression analysis.
The final prediction models were applied to the validation group as a means of cross-validation. R2 described the percentages explained for the dependent variable for prediction equations; these are composed of a combination of independent variables to describe how well the model fits the data. The value of R2 (%), mean error (observed value – predicted value) and 95% confident intervals were examined to assess the validity of the prediction equations in the validation group.
RESULTS
Descriptive Statistics
Characteristics of the participants in the primary and validation groups did not significantly differ (Table 1). In addition to descriptors presented in Table 1, the mean ± SEM for the primary and validation groups were 0.88 ± 0.01 and 0.87 ± 0.01 for waist-to-hip ratio, 0.85 ± 0.01 and 0.84 ± 0.02 for stereovision waist to hip ratio, 0.56 ± 0.01 and 0.56 ± 0.01 for waist-to-height ratio, 0.54 ± 0.01 and 0.55 ± 0.01 for stereovision waist-to-height ratio and 1.44 ± 0.02 and 1.39 ± 0.41 for stereovision waist and thigh ratio. Among the 122 participants, 54.9% (n = 67/122) were men and 45.1% (n = 55/122) women; 65.6% (n = 80/122), Caucasian and 34.4% (n = 42/122), non-White Hispanic. Also, 33.6% (n = 40/122) had healthy weights, 32.8% (n = 41/122) were overweight, or 33.6% (n = 40/122) exhibited class I and II obesity.
Table 1.
Characteristics of subjects
| Measurement Method | Group
|
||||
|---|---|---|---|---|---|
| Primary (n=85) | Validation (n=37) | ||||
| Mean ± SEMa | Range | Mean ± SEMa | Range | p valueb | |
| Traditional Anthropometric | |||||
| Height (cm) | 170.38 ± 0.96 | 148.59 – 189.23 | 170.04 ± 1.69 | 147.32 – 189.48 | 0.85 |
| Weight (kg) | 80.86 ± 1.96 | 49.80 – 129.64 | 83.71 ± 2.89 | 47.36 – 128.05 | 0.42 |
| BMI (kg/m2) | 27.81 ± 0.6 | 18.85 – 40.33 | 28.90 ± 0.85 | 18.20 – 40.07 | 0.31 |
| Waist circumference (cm) | 91.92 ± 1.52 | 67.11 – 127.47 | 92.96 ± 2.27 | 65.40 – 115.00 | 0.71 |
| Hip circumference (cm) | 106.78 ± 1.28 | 80.50 – 132.08 | 108.62 ± 1.78 | 86.00 – 134.00 | 0.42 |
| Sagittal diameter (cm) | 23.64 ± 0.56 | 15.80 – 37.00 | 23.62 ± 0.73 | 15.40 – 33.00 | 0.99 |
| Stereovision Body Imaging | |||||
| Stereovision waist (cm) | 99.41 ± 1.78 | 75.00 – 133.08 | 101.05 ± 2.37 | 76.43 – 124.48 | 0.60 |
| Stereovision hip (cm) | 107.79 ± 1.20 | 91.71 – 136.93 | 110.97 ± 1.83 | 86.89 – 134.33 | 0.15 |
| Stereovision thigh (cm) | 64.60 ± 1.06 | 47.41 – 109.10 | 67.87 ± 1.97 | 55.18 – 122.95 | 0.11 |
| Central obesity depth (cm) | 15.39 ± 0.41 | 8.91 – 22.79 | 16.05 ± 3.77 | 8.83 – 22.08 | 0.38 |
| Central obesity width (cm) | 34.91 ± 0.58 | 21.25 – 46.41 | 35.97 ± 0.81 | 25.52 – 47.94 | 0.31 |
| Magnetic Resonance Imaging | |||||
| Abdominal adiposity (cm2) | 284.35 ± 16.49 | 64.23 – 652.63 | 267.56 ± 22.73 | 20.64 – 510.43 | 0.57 |
| Subcutaneous adiposity (cm2) | 218.72 ± 14.05 | 13.70 – 514.84 | 201.98 ± 18.23 | 18.09 – 412.03 | 0.50 |
| Visceral adiposity (cm2) | 65.63 ± 42.14 | 7.28 – 187.17 | 65.58 ± 7.00 | 2.55 – 188.91 | 0.99 |
Standard error of mean
Significant level by independent samples t-test
Reproducibility of Anthropometric, MRI, and SBI Measurements
All of the coefficients of variation values for traditional anthropometric measurements including weight, height, sagittal diameter, and circumferences of arm, waist, hip, and thigh were less than 1%, which ensured that the anthropometric variables were highly replicable.
The reliability of the repeated measurements evaluated by coefficients of variation for SBI also exhibited strong agreements for abdominal adiposity volumes over 10 repeated body scans. Values of coefficients of variation for circumferences of waist, hip, thigh, central obesity depth and width were 0.6, 0.4, 0.6, 2.4, and 0.9%, respectively.
Two trained observers displayed strong agreement in quantifying abdominal adiposity via MRI umbilicus scans. Values of coefficients of variation regarding MRI were 0.7, 0.8, and 0.9% for total abdominal, subcutaneous and visceral adiposity, respectively.
Correlations between Central Adiposities and Potential Variables
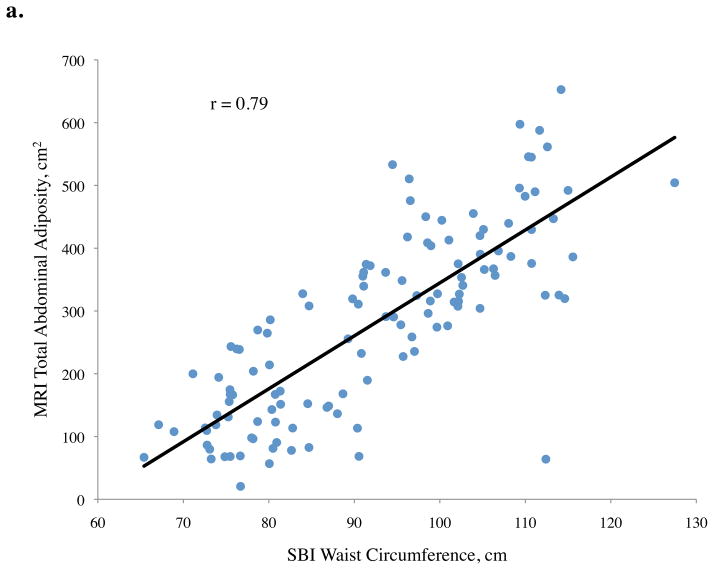
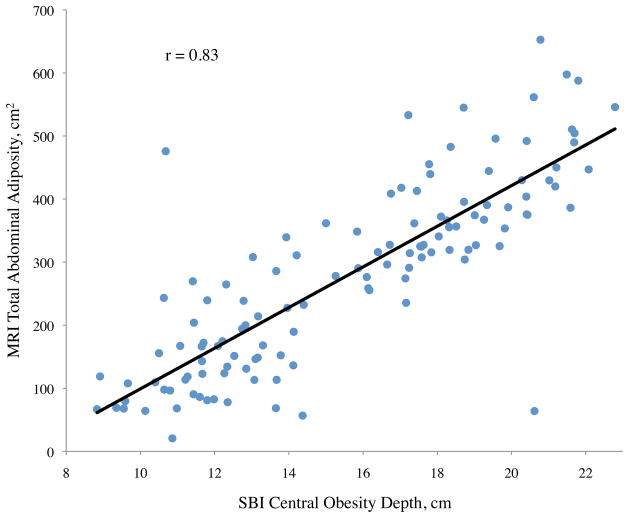
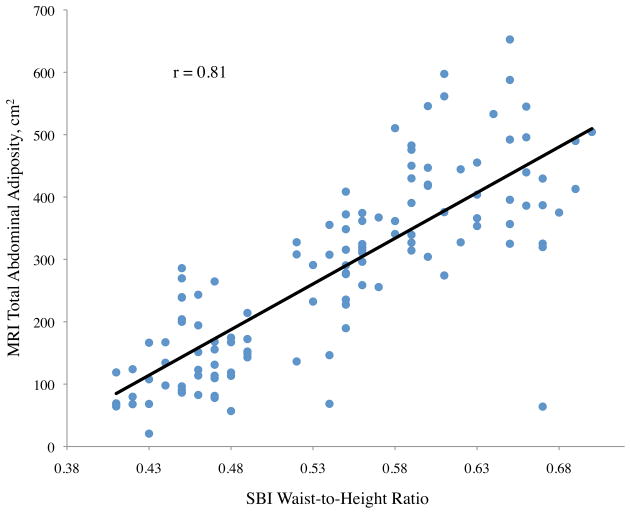
Pearson correlation coefficients (r) between abdominal adiposity volumes and demographics, traditional anthropometrics, and stereovision body imaging measurements are shown in Table 2. The correlations between total abdominal adiposity and all independent variables were statistically significant, except for gender (p = 0.10), ethnicity (p = 0.10), and height (p = 0.73). Total abdominal adiposity was highly related to BMI, waist circumference, hip circumference, waist-to-height ratio, and sagittal diameter. Relationships between total abdominal adiposity and SBI waist circumference, central obesity depth, and SBI waist-to-height ratio are depicted in Figure 2a.
Table 2.
Pearson correlation coefficients between total, subcutaneous, and visceral abdominal adiposity volumes, versus demographics, traditional anthropometrics and stereovision body imaging parameters
| Parameters | Abdominal Adiposity Volume a
|
||
|---|---|---|---|
| Total | Subcutaneous | Visceral | |
| Demographic | |||
| Age | 0.29** | 0.17 | 0.50** |
| Gender | − 0.15 | − 0.23** | 0.16 |
| Ethnicity | 0.15 | 0.16 | 0.05 |
| Traditional Anthropometric | |||
| Height (cm) | − 0.03 | − 0.05 | 0.05 |
| Weight (kg) | 0.75** | 0.73** | 0.47** |
| Body mass index (kg/m2) | 0.85** | 0.84** | 0.51* |
| Waist circumference (cm) | 0.85** | 0.81** | 0.60** |
| Hip circumference (cm) | 0.83** | 0.83** | 0.45** |
| Waist-to-hip ratio | 0.59** | 0.50** | 0.60** |
| Waist-to-height ratio | 0.88** | 0.84** | 0.60** |
| Sagittal diameter (cm) | 0.84** | 0.78** | 0.63** |
| Stereovision Body Imaging | |||
| Stereovision waist (cm) | 0.79** | 0.72** | 0.67** |
| Stereovision hip (cm) | 0.81** | 0.84** | 0.36** |
| Stereovision thigh (cm) | 0.54** | 0.61** | 0.09 |
| Stereovision waist-to-hip ratio | 0.36** | 0.22* | 0.62** |
| Stereovision waist-to-thigh ratio | 0.23* | 0.09 | 0.55** |
| Stereovision waist-to-height ratio | 0.81** | 0.74** | 0.65** |
| Central obesity depth (cm) | 0.83** | 0.75** | 0.71** |
| Central obesity width (cm) | 0.82** | 0.81** | 0.47** |
Determined by magnetic resonance imaging
Correlation is significant at 0.01 level (2-tailed)
Correlation is significant at 0.05 level (2-tailed)
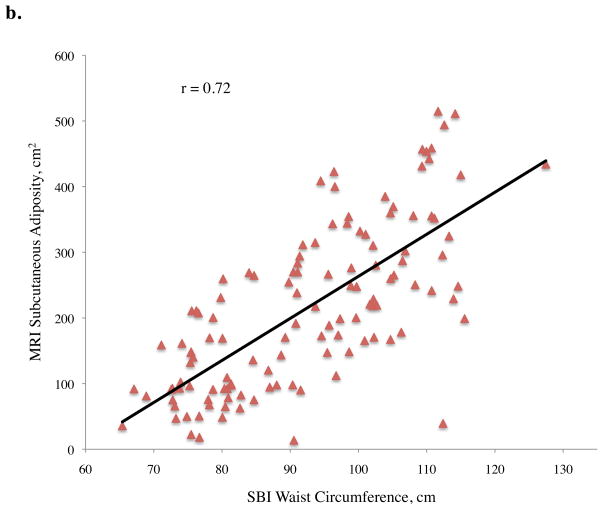
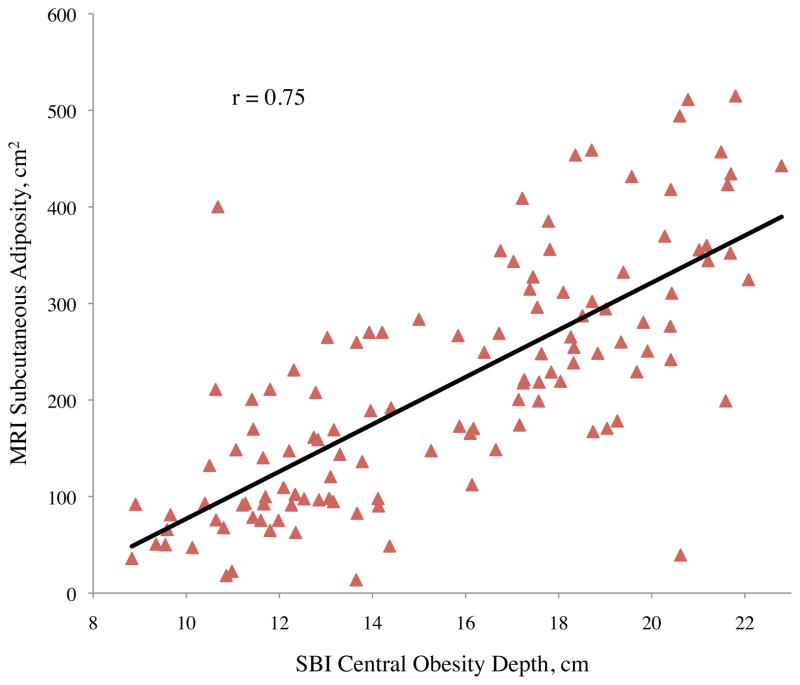
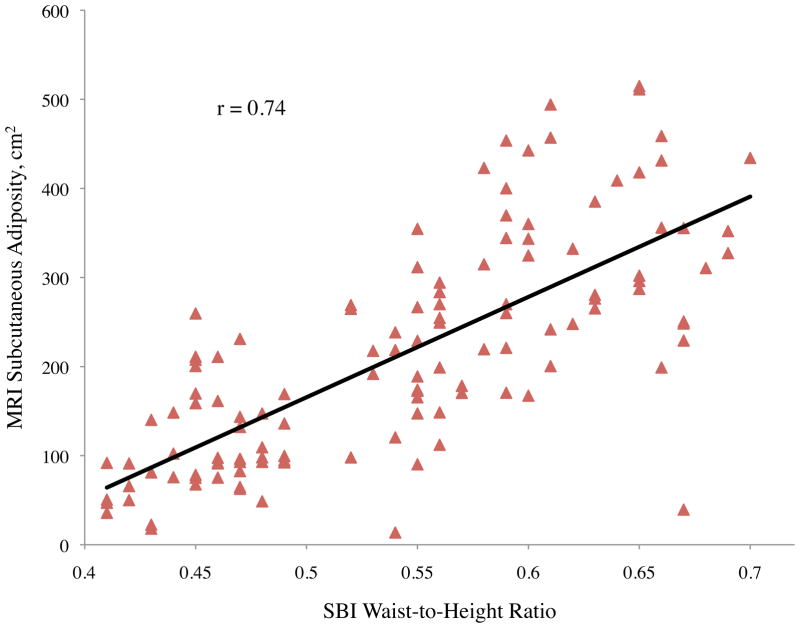
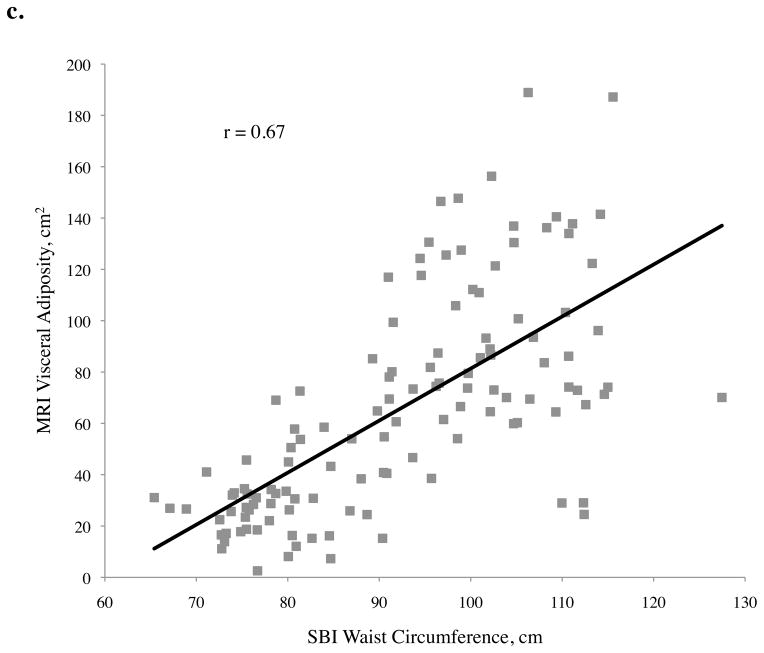
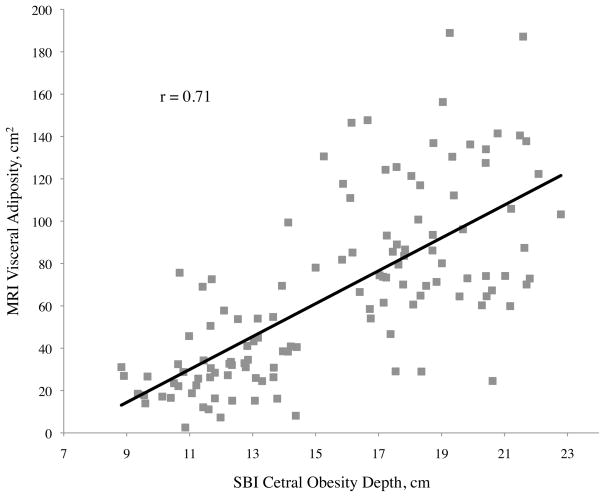
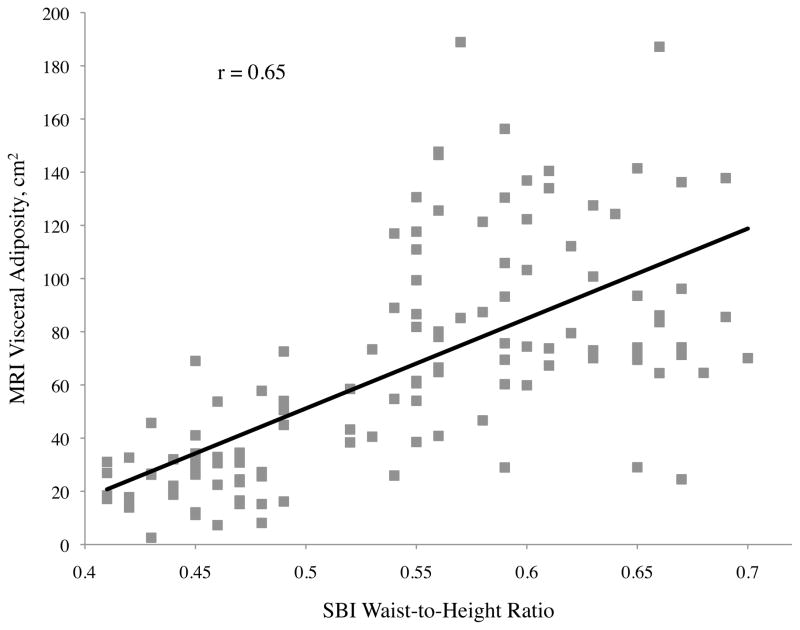
Figure 2.
Abdominal adiposity volume determined by magnetic resonance imaging (MRI) according to body measurements determined by stereovision body imaging (SBI)
a. Total, b. subcutaneous, and c. visceral abdominal adiposity volume determined by MRI according to SBI waist circumference, central obesity depth, and waist-to-height ratio
All variables measured were significantly related to subcutaneous adiposity except ethnicity (p = 0.08), height (p = 0.55), and stereovision waist-to-thigh ratio (p = 0.34), with age approaching significance (p = 0.06) (Table 2). Linear relationships between subcutaneous adiposity and SBI waist circumference, central obesity depth, and waist-to-height ratio are illustrated in Figure 2b. Subcutaneous adiposity and BMI, waist-to-height ratio, and SBI hip circumference also were significantly related.
For visceral adiposity, all of the correlation coefficients with variables measured were also significant, with the exception of gender (p = 0.08), ethnicity (p = 0.55), height (p = 0.59), and SBI thigh circumference (p = 0.33) (Table 2). The highest correlations of visceral adiposity were found with central obesity depth (r = 0.71), SBI waist circumference (r = 0.67), and SBI waist-to-height ratio (r = 0.65). Of these, central obesity depth provided the best correlation to visceral adiposity. Scatter plots of abdominal adiposity volumes according to these measurements are shown in Figure 2c.
Mathematical Model for Predicting Total Abdominal Adiposity
The best prediction equation for total abdominal adiposity was obtained by traditional anthropometric methods: total abdominal adiposity volume (cm2) = − 470.28 + 7.10 waist circumference (cm) − 91.01 gender (women=0, men=1) + 5.74 sagittal diameter (cm) (Table 3). Equations obtained by traditional anthropometric methods resulted in the same ultimate model as the combination method due to the fact that the SBI parameters were not ideal predictors for predicting total abdominal adiposity. Thus, the final model for total abdominal adiposity did not include SBI body measurements. The optimal equation for total abdominal adiposity exhibited the highest R2 (89.9%) and lowest standard error of the estimate (SEE) (49.18) among ten mathematical models (Table 3) developed by three different methods; traditional anthropometrics, stereovision body imagining, and a combination. The R2 for this model was not significantly different from the R2 for the equation created by the stereovision imaging method (R2 = 84.2%).
Table 3.
Regression coefficients for prediction of total abdominal adiposity by using traditional anthropometric, stereovision body imaging, and combination measurement methods
| Measurement Method | Eq a | Independent Variables
|
R2 (%) | ME (CI) b | ||||||
|---|---|---|---|---|---|---|---|---|---|---|
| Intercept | Waist a | Gender | SD a | COD a | sHip a | sWaist a | ||||
| Traditional c,d | 1 | − 509.05 | − 8.38 | – | – | – | – | 80.1 | − 21.09 (−79.56, 37.37) | |
| 2 | − 492.20 | 8.78 | − 94.04 | – | – | – | – | 89.2 | − 33.40 (− 91.64, 24.84) | |
| 3 e | − 470.28 | 7.10 | − 91.01 | 5.74 | – | – | – | 89.9 | − 32.04 (− 90.70, 26.61) | |
| Stereovision Body Imaging f | 4 | − 237.02 | – | – | – | 33.88 | – | – | 72.2 | − 39.32 (− 99.96, 21.31) |
| 5 | − 708.42 | – | – | – | 19.99 | 6.36 | – | 81.8 | − 50.28 (− 112.88, 12.32) | |
| 6 | − 612.78 | – | − 36.73 | – | 22.63 | 5.29 | – | 82.9 | − 53.33 (− 116.07, 9.41) | |
| 7 e | − 645.08 | – | − 61.37 | – | 12.97 | 3.79 | 3.89 | 84.2 | − 49.36 (− 111.03, 12.30) | |
| Combination g | 8 | − 509.05 | − 8.38 | – | – | – | – | 80.1 | − 21.09 (− 79.56, 37.37) | |
| 9 | − 492.20 | 8.78 | − 94.04 | – | – | – | – | 89.2 | − 33.40 (− 91.64, 24.84) | |
| 10 e | − 470.28 | 7.10 | − 91.01 | 5.74 | – | – | – | 89.9 | − 32.04 (− 90.70, 26.61) | |
Eq, equation; Waist, waist circumference; SD, sagittal diameter; COD, central obesity depth; sHip, stereovision body imaging hip circumference; sWaist, stereovision body imaging waist circumference;
Mean error = observed – predicted (confidence interval)
Manual
Independent variables include gender, waist circumference, waist-to-hip ratio, sagittal diameter
Recommended model by stepwise multiple regression analysis
Independent variables include gender, stereovision body imaging waist circumference, stereovision body imaging hip circumferences, stereovision body imaging waist-to-hip ratio, central obesity depth, central obesity width
Independent variables include gender, waist circumference, waist-to-hip ratio, sagittal diameter, stereovision body imaging waist circumference, stereovision body imaging hip circumferences, stereovision body imaging waist-to-hip ratio, central obesity depth, central obesity width
Mathematical Model for Predicting Subcutaneous Adiposity
The final equation for subcutaneous adiposity was selected from models developed by the combination method: subcutaneous adiposity volume (cm2) = − 172.37 + 8.57 waist circumference (cm) − 62.65 gender (women=0, men=1) − 450.16 stereovision waist-to-hip ratio (Table 4). From a total of 14 models (Table 4), this model contained the highest R2 of 90.4%, with the lowest SEE of 40.85. The model developed by the stereovision imaging method had a lower R2 of 79.3%, with the highest SEE of 59.65: subcutaneous adiposity volume (cm2) = − 827.48 + 7.43 stereovision hip circumference (cm) + 7.02 central obesity width (cm). Thus, the optimal model for subcutaneous adiposity was a combination of demographic (gender), anthropometric (waist circumference), and SBI (SBI waist-to-height ratio) measurements.
Table 4.
Regression coefficients for prediction of subcutaneous adiposity by using traditional anthropometric, stereovision body imaging, and combination measurement methods
| Measurement Method | Eq a | Independent Variables
|
R2 (%) | ME (CI) b | ||||||
|---|---|---|---|---|---|---|---|---|---|---|
| Intercept | Waist a | Gender | WHR a | sHip a | COW a | sWHR a | ||||
| Traditional c,d | 1 | − 425.91 | 6.81 | – | – | – | – | – | 72.8 | − 20.22 (− 67.38, 26.93) |
| 2 | − 408.19 | 7.23 | − 98.81 | – | – | – | – | 86.8 | − 33.20 (− 80.70, 14.30) | |
| 3 e | − 204.92 | 8.82 | − 86.07 | − 409.19 | – | – | – | 88.6 | − 35.86 (− 83.92, 12.21) | |
| Stereovision Body Imaging f | 4 | − 877.72 | – | – | – | 10.17 | – | – | 76.5 | − 49.07 (− 100.10, 1.97) |
| 5 e | − 827.48 | – | – | – | 7.43 | 7.02 | – | 79.3 | − 47.76 (− 99.18, 3.66) | |
| Combination g | 6 | − 877.72 | – | – | – | 10.17 | – | – | 76.5 | − 49.07 (− 100.10, 1.97) |
| 7 | − 769.53 | 3.37 | – | – | 6.21 | – | – | 82.7 | − 38.15 (− 87.87, 11.58) | |
| 8 | − 566.98 | 5.59 | − 76.30 | – | 2.80 | – | – | 88.1 | − 38.36 (− 86.96, 10.24) | |
| 9 | − 96.94 | 9.21 | − 64.91 | – | − 0.83 | – | − 504.72 | 90.5 | − 33.88 (− 81.38, 13.61) | |
| 10e | − 172.37 | 8.57 | − 62.65 | – | – | – | − 450.16 | 90.4 | − 35.17 (− 83.00, 12.66) | |
Eq, equation; Waist, waist circumference; WHR, waist-to-hip ratio; sHip, stereovision body imaging hip circumference; COW, central obesity width; sWHR, stereovision body imaging waist-to-hip ratio
Mean error = observed – predicted (confidence interval)
Manual
Independent variables include gender, waist circumference, waist-to-hip ratio, sagittal diameter
Recommended model by stepwise multiple regression analysis
Independent variables include gender, stereovision body imaging waist circumference, stereovision body imaging hip circumferences, stereovision body imaging waist-to-hip ratio, central obesity depth, central obesity width
Independent variables include gender, waist circumference, waist-to-hip ratio, sagittal diameter, stereovision body imaging waist circumference, stereovision body imaging hip circumferences, stereovision body imaging waist-to-hip ratio, central obesity depth, central obesity width
Mathematical Model for Predicting Visceral Adiposity
The final multiple regression model for the prediction of visceral adiposity was best described by the utilization of stereovision and combination methods, which resulted in an identical model: visceral adiposity volume (cm2) = − 96.76 + 11.48 central obesity depth (cm) − 5.09 central obesity width (cm) + 204.74 stereovision waist-to-hip ratio − 18.59 gender (women=0, men=1) (Table 5). The most important influences for prediction of visceral adiposity were central obesity depth, central obesity width, stereovision waist-to-hip ratio, and gender. The addition of traditional anthropometric measurements did not improve the variance, thus the model was identical. Note that with the exception of gender, all variables included in the model were derived from the SBI system. Among 11 possible models (Table 5), the R2 for the final model (R2 = 71.7%) was significantly higher than the model derived from traditional anthropometric measurements (R2 = 54.2%) and the SEE was only 22.97: visceral adiposity volume (cm2) = − 214.28 + 306.03 waist-to-hip ratio + 5.78 sagittal diameter − 1.34 waist circumference (cm) (SEE = 29.04).
Table 5.
Regression coefficients for prediction of visceral adiposity by using traditional anthropometric, stereovision body imaging, and combination measurement methods
| Measurement Method | Eqa | Independent Variables
|
R2 (%) | ME (CI) b | |||||||
|---|---|---|---|---|---|---|---|---|---|---|---|
| Intercept | WHRa | SD a | Waist a | COD a | COW a | sWHR a | Gender | ||||
| Traditional c,d | 1 | − 245.98 | 352.89 | – | – | – | – | – | – | 44.4 | 2.93 (− 13.04, 18.89) |
| 2 | − 192.17 | 211.14 | 3.02 | – | – | – | – | – | 51.1 | 1.77 (− 14.35, 17.90) | |
| 3 e | − 214.28 | 306.03 | 5.78 | − 1.34 | – | – | – | – | 54.2 | 3.29 (− 12.98, 19.56) | |
| Stereovision Body Imaging f | 4 | − 57.33 | – | – | 7.99 | – | – | – | 52.3 | − 5.36 (− 22.14, 11.43) | |
| 5 | 41.65 | – | – | 15.62 | − 6.20 | – | – | 66 | − 3.91 (− 21.63, 13.80) | ||
| 6 | − 55.72 | – | – | 12.23 | − 4.84 | 119.89 | – | 68.9 | − 1.84 (−19.89, 16.22) | ||
| 7 e | − 96.76 | – | – | 11.48 | − 5.09 | 204.74 | − 18.59 | 71.7 | − 2.00 (− 20.36, 16.37) | ||
| Combination g | 8 | − 57.33 | – | – | 7.99 | – | – | 52.3 | − 5.36 (− 22.14, 11.43) | ||
| 9 | 41.65 | – | – | 15.62 | − 6.20 | – | 66 | − 3.91 (− 21.63, 13.80) | |||
| 10 | − 55.72 | – | – | 12.23 | − 4.84 | 119.89 | 68.9 | − 1.84 (−19.89, 16.22) | |||
| 11e | − 96.76 | – | – | 11.48 | − 5.09 | 204.74 | 71.7 | − 2.00 (− 20.36, 16.37) | |||
Eq, equation; WHR, waist-to-hip ratio; SD, sagittal diameter; Waist, waist circumference; COD, central obesity depth; COW, central obesity width; sWHR, stereovision body imaging waist-to-hip ratio
Mean error = observed – predicted (confidence interval)
Manual
Independent variables include gender, waist circumference, waist-to-hip ratio, sagittal diameter
Recommended model by stepwise multiple regression analysis
Independent variables include gender, stereovision body imaging waist circumference, stereovision body imaging hip circumferences, stereovision body imaging waist-to-hip ratio, central obesity depth, central obesity width
Independent variables include gender, waist circumference, waist-to-hip ratio, sagittal diameter, stereovision body imaging waist circumference, stereovision body imaging hip circumferences, stereovision body imaging waist-to-hip ratio, central obesity depth, central obesity width
The prediction equations were then applied to the validation group data and 95% confidence intervals were computed in order to check the cross-validity of the developed mathematical equations (Tables 3, 4, 5). All of the 95% confidence intervals included zero, which implies that the predicted abdominal adiposity (total, visceral, and subcutaneous abdominal adiposity) did not differ from the measured values of the abdominal adiposity at the level of 0.05. In addition, the mean error (ME) in Tables 3, 4 and 5 exhibit the differences between the observed values of abdominal adiposity measured by MRI and predicted values obtained by the mathematical equations.
The final prediction equation models for total abdominal, subcutaneous, and visceral adiposity are summarized in Table 6. All of the predictive models provided large effect sizes (larger than 0.35) due to the high R2 values. Consequently, the observed power of abdominal adiposity equations among the given sample size ranged from 0.94 to 1. The optimal equation for predicting total abdominal adiposity was derived via traditional anthropometrics; whereas, subcutaneous and visceral adiposity were obtained by combination and stereovision imaging measurement methods, respectively.
Table 6.
Final prediction equations for total abdominal, subcutaneous and visceral adiposity volumes using demographic, traditional anthropometric, stereovision body imaging, and magnetic resonance imaging measurements
| Adiposity Volume a | Measurement Method | Predictive Models | R2 (%) |
|---|---|---|---|
| Total abdominal | Traditional b,c,d | − 470.28 + 7.10 Waist e − 91.01 Gender + 5.74 SD e | 89.9 |
| Stereovision f | − 645.08 + 12.97 COD e + 3.79 sHip e − 61.37 Gender + 3.89 sWaist e | 84.2 | |
| Combination g | − 470.28 + 7.10 Waist e − 91.01 Gender + 5.74 SD e | 89.9 | |
| Subcutaneous | Traditional b,c | − 204.92 + 8.82 Waist e − 86.07 Gender − 409.19 WHR e | 88.6 |
| Stereovision f | − 827.48 + 7.43 sHip e + 7.02 COW e | 79.3 | |
| Combination d,g | − 172.37 + 8.57 Waist e − 62.65 Gender − 450.16 sWHR e | 90.4 | |
| Visceral | Traditional b,c | − 214.28 + 306.03 WHR e + 5.78 SD e − 1.34 Waist | 54.2 |
| Stereovision d,f | − 96.76 + 11.48 COD e − 5.09 COW e + 204.74 sWHR e − 18.59 Gender | 71.7 | |
| Combination g | − 96.76 + 11.48 COD e − 5.09 COW e + 204.74 sWHR e − 18.59 Gender | 71.7 |
Dependent variable measured by magnetic resonance imaging
Manual
Independent variables include gender, waist circumference, waist-to-hip ratio, sagittal diameter
Optimal model for predicting central obesity by stepwise multiple regression analysis
Waist, waist circumference; SD, sagittal diameter; COD, central obesity depth; sHip, stereovision body imaging hip circumference; sWaist, stereovision body imaging waist circumference; WHR, waist-to-hip ratio; COW, central obesity width; sWHR, stereovision body imaging waist-to-hip ratio
Independent variables include gender, stereovision body imaging waist circumference, stereovision body imaging hip circumferences, stereovision body imaging waist-to-hip ratio, central obesity depth, central obesity width
Independent variables include gender, waist circumference, waist-to-hip ratio, sagittal diameter, stereovision body imaging waist circumference, stereovision body imaging hip circumferences, stereovision body imaging waist-to-hip ratio, central obesity depth, central obesity width
DISCUSSION
The current research is the first to develop mathematical equations for predicting abdominal adiposity by utilizing combined parameters derived from demographics, traditional anthropometric measurements, and measurements obtained by SBI. The results suggest that the body measurements derived from SBI improve the prediction of visceral adiposity volume. The R2 in this study for prediction of visceral adiposity (71.7%) is lower than that found for both total abdomen (89.9%) and subcutaneous (90.4%) adiposity. Clearly, visceral adiposity is more difficult to measure without advanced instruments such as MRI or CT that are stationary and expensive. In this study, predictive equations for total abdominal, subcutaneous, and visceral adiposity were created using measurements obtained from traditional anthropometrics, SBI parameters, and combinations. The most optimal result for the prediction of total abdominal adiposity was produced by traditional manual anthropometrics; for subcutaneous adiposity, a combination method was better. But for visceral adiposity, the method of stereovision body imaging yielded the best results. These results were presumably due to the incorporation of new parameters of central obesity measured via the SBI system. Central obesity depth showed the highest correlation with visceral adiposity, as compared to other body measurements (demographics, traditional anthropometrics, and SBI variables). Moreover, measurements by SBI alone were not improved by adding traditional manual parameters since the SBI measurements were more strongly associated with visceral adiposity. In addition, central obesity depth, central obesity width, SBI waist-to-hip ratio and gender appeared to contribute significantly to predict visceral adiposity.
Studies have shown that visceral adiposity is related to diseases such as metabolic syndrome (9,22), insulin resistance (23), and cardiovascular disease (24). While subcutaneous adiposity is a better indicator of metabolic syndrome in a specific population (25), visceral adiposity may have greater implications in terms of clinical health than subcutaneous adiposity (9,23,26).
A study by Goel (2008) developed prediction equations for total abdominal, subcutaneous, and visceral adiposity that included traditional anthropometric measurements as independent variables and abdominal adiposities, as measured by MRI, as a dependent variable (18). These prediction models explained 65%, 67.1% and 52.1% of the variances for total abdominal, subcutaneous, visceral adiposity volume, respectively. These values were somewhat lower than those obtained in the present research (89.9%, 90.4%, and 71.7%) for total abdominal, subcutaneous, and visceral adiposity volume.
Brundavani et al. (2006) also utilized MRI for the assessment of central obesity and developed prediction equations for visceral adiposity for men and women (27). The final prediction equations for men included weight, waist circumference and BMI as independent variables, and weight and waist circumference for women. The R2 for visceral adiposity was higher for men (74%) than for women (63%) in the prediction equation. These values are similar to the results of the present study, in that the R2 for men and women combined was 71.7%, and gender was included as a fourth independent variable in the prediction equation for visceral adiposity. Moreover, gender was included in the prediction equations by Goel et al. (2008) (18). Collectively, these results imply that gender is a significant factor in order to predict visceral adiposity, as differences exist in fat distribution and accumulation between men and women. Previous studies reported that women have more subcutaneous adiposity compared to men (28); whereas, men have more visceral adiposity as opposed to women (29).
Similarly, Janssen et al. (2002) developed prediction equations via multiple regression analysis (30). BMI and waist circumference were included as independent variables and MRI measured subcutaneous and visceral adiposity as dependent variables. Their model described 57% of visceral adiposity for men and 76% for women when BMI was added to the model as a first variable, and waist circumferences as a second variable. Waist circumference explained 49% of subcutaneous adiposity and 55% of visceral adiposity for men, and 52% of subcutaneous adiposity and 76% of visceral adiposity for women. The BMI explained 72% of subcutaneous adiposity and 46% of visceral adiposity for men and 53% of subcutaneous adiposity and 60% of visceral adiposity for women. These results suggest that BMI had a greater influence than waist circumference in describing the variance for subcutaneous adiposity; whereas, waist circumference was superior to BMI in the prediction of visceral adiposity volume.
Waist circumference was observed to be the most optimal variable for predicting subcutaneous adiposity in the equation model. In contrast to the study conducted by Janssen et al. (2002), BMI was not included as a predictor variable in either the subcutaneous or visceral adiposity models (30). In addition, body measurements such as central obesity depth and central obesity width, rather than waist circumference, were more precise components for predicting visceral adiposity. These results imply that variables derived from stereovision imaging were stronger predictors than waist circumference or BMI for predicting visceral adiposity.
The above studies utilized MRI for assessment of central obesity; other studies examined the use of CT to quantify abdominal adiposity (17,31). Stanforth et al. (2004) compared prediction equations for visceral adiposity by using two different methods for men and women (17). A CT technique incorporated subcutaneous adiposity, sagittal diameter, age, and ethnicity as independent variables. The traditional anthropometric method utilized BMI, waist-to-hip ratio, waist circumference, age and ethnicity as independent variables. The R2 for the CT method was 84% for men and 75% for women, with a R2 of 78% for men and 73% for women for anthropometrics. These R2 values are higher than the prediction value of the current study (71.7%), which includes both men and women. Since Wajchenberg et al. (2002) denoted that MRI showed lower reproducibility for measuring total and visceral adiposity, as opposed to CT (32), this suggests that CT may be slightly more precise. But the usage of CT is limited by radiation exposure and lack of portability.
Other prediction equations for visceral adiposity measured by CT were created in a Japanese adult population (n=112) (31). The model that incorporated gender, age, waist-to-hip ratio, and internal fat mass (determined by DXA) as independent variables reported a R2 of 74.5%. In addition, a prediction equation for visceral adiposity with the components of gender, age, waist-to-hip ratio, and internal fat mass (measured by BIA) resulted in a similar R2 of 77.3%. These two models utilizing DXA and BIA measures as independent variables produced slightly higher variances than from the measurements by the stereovision imaging system (71.7%).
CT and MRI derived measurements of subcutaneous and visceral adiposity were compared in previous studies (33,34). Total and subcutaneous adiposity were overestimated when using CT compared to MRI, but not for visceral adiposity (33). Whereas, Seidell et al. have shown that subcutaneous adipose volume measured by CT and MRI did not differ statistically, but volume did significantly differ for visceral adiposity (34). Collectively, these studies suggest that the prediction equation for abdominal adiposity developed by CT-measured and MRImeasured may exhibit a disparity due to the error variances in the measurements of abdominal adiposity volumes.
A variety of 3-D body scanners have been validated for accuracy in measurement of waist and hip circumferences against manual tape measurements. Pepper et al. (2010) reported that correlations between waist and hip circumferences measured by 3-D laser body scanner and by tape were 0.998 and 0.989, respectively (35). Previously, Wells et al. (2007) found similar results via a 3-D photonic scanner (Textile and Clothing Technology Corporation, [TC]2), with correlation efficients of 0.96 for waist circumference and 0.97 for hip circumference (20). Similarly, Zwane et al. (2010) observed hip circumference obtained from a 3-D photonic scanner ([TC]2) and tape measurement were not statistically in the range of European size of 34 to 44 (21). In spite of the accuracy of the body measurements derived from body scanners, these body measurements have not been utilized to predict the quantity of abdominal adiposity.
Postmenopausal women have a higher amount of visceral adiposity, as opposed to premenopausal women, which indicates that menopausal status or age could be a potential variable for predicting abdominal adiposity (36). However, age was excluded initially in the data analysis when other independent variables exhibited higher correlations with central obesity. The ineffectual correlation between age and abdominal adiposity compared to other variables could be explained by a lack of the power to detect the significance since the age distribution among participants was evenly distributed and only 5.7% of the participants consisted of women over 50 years old. In addition, information on menopausal status was not available for this data set. Future research incorporating a higher percentage of elderly women could determine if the age of a woman or menopausal status has an impact on prediction of abdominal adiposity.
Thigh circumference has been suggested to be a significant variable for prediction of central obesity because this measure is inversely related to blood glucose, a parameter of risk for type 2 diabetes (37). Wells et al. (2008) demonstrated that waist adjusted for thigh girth ratio measured by photonic scanner linearly increased across BMI categories (38). However, in the prediction equation in the present study, both SBI thigh circumference and waist-to-thigh ratio were excluded due to non-significance.
Waist-to-height ratio (WHtR) also provides a mean for detecting abdominal obesity and related health risks. Ashwell et al. (2011) reported that WHtR was a better predictor than waist circumference or BMI, in terms of monitoring cardiometabolic risk (39). Parikh et al. (2007) confirmed that WHtR serves as an index of central obesity and it was more effective in defining metabolic syndrome than waist circumference (40).
In this study, traditional and stereovision waist-to-height ratio exhibited high correlations with total abdominal, subcutaneous, and visceral adiposity. However, the former were excluded in the prediction model because other independent variables had stronger correlations with abdominal adiposity volumes. In addition, multicollinearity existed between independent variables that influenced the waist-to-height ratio, resulting in an exclusion from the prediction model. For example, in the creation of the visceral adiposity prediction model, waist-to-height ratio had a high correlation with central obesity depth (r=0.89, p<0.001). Yet, a substantial amount of visceral adiposity is explained by central obesity depth; thus, the waist-to-height ratio, which explains a similar portion of visceral adiposity, was excluded in the model. Then other variables were examined by the process of stepwise multiple regression analysis in order to ascertain whether they should be included in the model. For the total abdominal and subcutaneous models, waist-to-height ratio was excluded again, despite having the highest correlation with the adiposity volumes, because of the removal test in the stepwise multiple regression analysis. In this test, the least useful independent variable is removed from the equation when each variable is included in the equation.
The current research observed that body ratios (including waist-to-height ratio and waist-to-thigh ratio) were not significant in the prediction of visceral adiposity, except for waist-to-hip ratio. The waist-to-hip ratio obtained via SBI was the third strongest predictor in the equation for subcutaneous and visceral adiposity. However, central obesity depth and central obesity width as measured by SBI were superior predictors for visceral adiposity, as compared to SBI waist-to-hip ratio.
In summary, the prediction equations for abdominal adiposity volumes were compared using traditional anthropometrics, SBI or a combination of both. For total and subcutaneous adiposity, traditional methods were just as effective as for SBI. However, for visceral adiposity, the most critical measure for assessing health risk, SBI provided a more optimal prediction model. Since the SBI system is inexpensive and non-invasive, it has potential for assessment of visceral adiposity in a field setting where CT or DXA are not available.
This research was supported by grant NIH R21 DK081206-02S1 from the National Institutes of Health. Jane J Lee implemented the study, conducted data analysis, and composed the manuscript. Jeanne H Freeland-Graves served as the primary project supervisor and a corresponding author. M Reese Pepper implemented the study and collected the research data. Ming Yao and Bugao Xu provided the 3-dimensional stereovision imaging system and provided technical support for the 3-dimensional measurements of central obesity. All of the authors participated in data analysis and preparation of the manuscript.
Acknowledgments
Supported by: NIH 3 R21 DK081206-02S1
Footnotes
Disclosure: The authors declared no conflict of Interest.
References
- 1.Kahn SE, Hull RL, Utzschneider KM. Mechanisms linking obesity to insulin resistance and type 2 diabetes. Nature. 2006;444:840–846. doi: 10.1038/nature05482. [DOI] [PubMed] [Google Scholar]
- 2.Nguyen NT, Nguyen XM, Wooldridge JB, Slone JA, Lane JS. Association of obesity with risk of coronary heart disease: Findings from the National Health and Nutrition Examination Survey, 1999–2006. Surg Obes Relat Dis. 2010;6:465–469. doi: 10.1016/j.soard.2010.02.038. [DOI] [PubMed] [Google Scholar]
- 3.Fabbrini E, Sullivan S, Klein S. Obesity and nonalcoholic fatty liver disease: biochemical, metabolic, and clinical implications. Hepatology. 2010;51:679–689. doi: 10.1002/hep.23280. [DOI] [PMC free article] [PubMed] [Google Scholar]
- 4.Flegal KM, Carroll MD, Ogden CL, Curtin LR. Prevalence and trends in obesity among US adults, 1999–2008. JAMA. 2010;303:235–241. doi: 10.1001/jama.2009.2014. [DOI] [PubMed] [Google Scholar]
- 5.Smith SR, Lovejoy JC, Greenway F, et al. Contributions of total body fat, abdominal subcutaneous adipose tissue compartments, and visceral adipose tissue to the metabolic complications of obesity. Metabolism. 2001;50:425–435. doi: 10.1053/meta.2001.21693. [DOI] [PubMed] [Google Scholar]
- 6.Sardinha LB, Teixeira PJ, Guedes DP, et al. Subcutaneous central fat is associated with cardiovascular risk factors in men independent of total fatness and fitness. Metabolism. 2000;49:1379–1385. doi: 10.1053/meta.2000.17716. [DOI] [PubMed] [Google Scholar]
- 7.Kanaya AM, Harris T, Goodpaster BH, Tylavsky F, Cummings SR. Adipocytokines attenuate the association between visceral adiposity and diabetes in older adults. Diabetes Care. 2004;27:1375–1380. doi: 10.2337/diacare.27.6.1375. [DOI] [PubMed] [Google Scholar]
- 8.Hayashi T, Boyko EJ, Leonetti DL, et al. Visceral adiposity is an independent predictor of incident hypertension in Japanese Americans. Ann Intern Med. 2004;140:992–1000. doi: 10.7326/0003-4819-140-12-200406150-00008. [DOI] [PubMed] [Google Scholar]
- 9.Fox CS, Massaro JM, Hoffmann U, et al. Abdominal visceral and subcutaneous adipose tissue compartments: association with metabolic risk factors in the Framingham Heart Study. Circulation. 2007;116:39–48. doi: 10.1161/CIRCULATIONAHA.106.675355. [DOI] [PubMed] [Google Scholar]
- 10.Bradlee ML, Singer MR, Qureshi MM, Moore LL. Food group intake and central obesity among children and adolescents in the Third National Health and Nutrition Examination Survey (NHANES III) Public Health Nutr. 2009;22:1–9. doi: 10.1017/S1368980009991546. [DOI] [PubMed] [Google Scholar]
- 11.Rexrode KM, Carey VJ, Hennekens CH, et al. Abdominal adiposity and coronary heart disease in women. JAMA. 1998;280:1843–1848. doi: 10.1001/jama.280.21.1843. [DOI] [PubMed] [Google Scholar]
- 12.Theorell-Haglow J, Berne C, Janson C, Sahlin C, Lindberg E. Associations between short sleep duration and central obesity in women. Sleep. 2010;33:593–598. [PMC free article] [PubMed] [Google Scholar]
- 13.Vasan SK, Thomas N, Christopher S, Geethanjali FS, Paul TV, Sanjeevi CB. Anthropometric measurements for the prediction of the metabolic syndrome: a cross-sectional study on adolescents and young adults from southern india. Heart Asia. 2011;3:2–7. doi: 10.1136/ha.2009.001735. [DOI] [PMC free article] [PubMed] [Google Scholar]
- 14.Ohrvall M, Berglund L, Vessby B. Sagittal abdominal diameter compared with other anthropometric measurements in relation to cardiovascular risk. Int J Obes Relat Metab Disord. 2000;24:497–501. doi: 10.1038/sj.ijo.0801186. [DOI] [PubMed] [Google Scholar]
- 15.Sebo P, Beer-Borst S, Haller DM, Bovier PA. Reliability of doctors’ anthropometric measurements to detect obesity. Prev Med. 2008;47:389–393. doi: 10.1016/j.ypmed.2008.06.012. [DOI] [PubMed] [Google Scholar]
- 16.Wang J, Thornton JC, Bari S, et al. Comparisons of waist circumferences measured at 4 sites. Am J Clin Nutr. 2003;77:379–384. doi: 10.1093/ajcn/77.2.379. [DOI] [PubMed] [Google Scholar]
- 17.Stanforth PR, Jackson AS, Green JS, et al. Generalized abdominal visceral fat prediction models for black and white adults aged 17–65 y: the HERITAGE Family Study. Int J Obes Relat Metab Disord. 2004;28:925–32. doi: 10.1038/sj.ijo.0802563. [DOI] [PubMed] [Google Scholar]
- 18.Goel K, Gupta N, Misra A, et al. Predictive equations for body fat and abdominal fat with DXA and MRI as reference in Asian Indians. Obesity. 2008;16:451–456. doi: 10.1038/oby.2007.55. [DOI] [PubMed] [Google Scholar]
- 19.Xu B, Yu W, Yao X, Pepper RM, Freeland-Graves JH. A three-dimensional surface imaging system for assessing human obesity. Opt Eng. 2009;48:107204–107211. doi: 10.1117/1.3250191. [DOI] [PMC free article] [PubMed] [Google Scholar]
- 20.Wells JCK, Treleaven P, Cole TJ. BMI compared with 3D body shape: The UK National Sizing Survey. Am J Clin Nutr. 2007;85:419–425. doi: 10.1093/ajcn/85.2.419. [DOI] [PubMed] [Google Scholar]
- 21.Zwane PE, Sithole M, Hunter L. A preliminary comparative analysis of 3D body scanner, manually taken girth body measurements and size chart measurements. Int J Consum Stud. 2010;34:265–271. [Google Scholar]
- 22.Despres JP, Lemieux I. Abdominal obesity and the metabolic syndrome. Nature. 2006;444:881–887. doi: 10.1038/nature05488. [DOI] [PubMed] [Google Scholar]
- 23.Preis SR, Massaro JM, Robins SJ, et al. Abdominal subcutaneous and visceral adipose tissue and insulin resistance in the Framingham heart study. Obesity. 2010;18:2191–2198. doi: 10.1038/oby.2010.59. [DOI] [PMC free article] [PubMed] [Google Scholar]
- 24.Sironi AM, Petz R, De Marchi D, et al. Impact of increased visceral and cardiac fat on cardiometabolic risk and disease. Diabet Med. 2011;29:622–627. doi: 10.1111/j.1464-5491.2011.03503.x. [DOI] [PubMed] [Google Scholar]
- 25.Misra A, Vikram NK. Clinical and pathophysiological consequences of abdominal adiposity and adipose tissue depots. Nutrition. 2003;19:457–466. doi: 10.1016/s0899-9007(02)01003-1. [DOI] [PubMed] [Google Scholar]
- 26.Després JP, Lemieux I, Bergeron J, et al. Abdominal obesity and the metabolic syndrome: contribution to global cardiometabolic risk. Arterioscler Thromb Vasc Biol. 2008;28:1039–1049. doi: 10.1161/ATVBAHA.107.159228. [DOI] [PubMed] [Google Scholar]
- 27.Brundavani V, Murthy SR, Kurpad AV. Estimation of deep-abdominal-adipose-tissue (DAAT) accumulation from simple anthropometric measurements in Indian men and women. Eur J Clin Nutr. 2006;60:658–666. doi: 10.1038/sj.ejcn.1602366. [DOI] [PubMed] [Google Scholar]
- 28.Camhi SM, Bray GA, Bouchard C, et al. The relationship of waist circumference and BMI to visceral, subcutaneous, and total body fat: sex and race differences. Obesity. 2011;19:402–408. doi: 10.1038/oby.2010.248. [DOI] [PMC free article] [PubMed] [Google Scholar]
- 29.Demerath EW, Sun SS, Rogers N, et al. Anatomical patterning of visceral adipose tissue: race, sex, and age variation. Obesity. 2007;15:2984–2993. doi: 10.1038/oby.2007.356. [DOI] [PMC free article] [PubMed] [Google Scholar]
- 30.Janssen I, Heymsfield SB, Allison DB, Kotler DP, Ross R. Body mass index and waist circumference independently contribute to the prediction of nonabdominal, abdominal subcutaneous, and visceral fat. Am J Clin Nutr. 2002;75:683–688. doi: 10.1093/ajcn/75.4.683. [DOI] [PubMed] [Google Scholar]
- 31.Demura S, Sato S. Prediction of visceral fat area in Japanese adults: proposal of prediction method application in a field setting. Eur J Clin Nutr. 2007;61:727–735. doi: 10.1038/sj.ejcn.1602576. [DOI] [PubMed] [Google Scholar]
- 32.Ross R, Léger L, Guardo R, de Guise J, Pike BG. Adipose tissue volume measured by magnetic resonance imaging and computerized tomography in rats. J Appl Physiol. 1991;70:2165–2172. doi: 10.1152/jappl.1991.70.5.2164. [DOI] [PubMed] [Google Scholar]
- 33.Wajchenberg BL. Subcutaneous and visceral adipose tissue: their relation to the metabolic syndrome. Endocr Rev. 2000;21:697–738. doi: 10.1210/edrv.21.6.0415. [DOI] [PubMed] [Google Scholar]
- 34.Seidell JC, Bakker CJ, Van der Kooy K. Imaging techniques for measuring adiposetissue distribution–a comparison between computed tomography and 1. 5-T magnetic resonance. Am J Clin Nutr. 1990;51:953–957. doi: 10.1093/ajcn/51.6.953. [DOI] [PubMed] [Google Scholar]
- 35.Pepper MR, Freeland-Graves JH, Yu W, et al. Validation of a 3- dimensional laser body scanner for assessment of waist and hip circumference. J Am Coll Nutr. 2010;3:179–188. doi: 10.1080/07315724.2010.10719832. [DOI] [PubMed] [Google Scholar]
- 36.Toth MJ, Tchernof A, Sites CK, Poehlman ET. Effect of menopausal status on body composition and abdominal fat distribution. Int J Obes Relat Metab Disord. 2000;24:226–231. doi: 10.1038/sj.ijo.0801118. [DOI] [PubMed] [Google Scholar]
- 37.Snijder MB, Dekker JM, Visser M, et al. Associations of hip and thigh circumferences independent of waist circumference with the incidence of type 2 diabetes: the Hoorn Study. Am J Clin Nutr. 2003;77:1192–1197. doi: 10.1093/ajcn/77.5.1192. [DOI] [PubMed] [Google Scholar]
- 38.Wells JC, Cole TJ, Treleaven P. Age-variability in body shape associated with excess weight: the UK National Sizing Survey. Obesity. 2008;16:435–441. doi: 10.1038/oby.2007.62. [DOI] [PubMed] [Google Scholar]
- 39.Ashwell M, Gunn P, Gibson S. Waist-to-height ratio is a better screening tool than waist circumference and BMI for adult cardiometabolic risk factors: systematic review and meta-analysis. Obes Rev. 2012;13:275–86. doi: 10.1111/j.1467-789X.2011.00952.x. [DOI] [PubMed] [Google Scholar]
- 40.Parikh RM, Menon PS, Shah NS, Shah N. Index of central obesity - A novel parameter. Med Hypotheses. 2007;68:1272–1275. doi: 10.1016/j.mehy.2006.10.038. [DOI] [PubMed] [Google Scholar]


