

Abstract
Accurate, sensitive, multiplexed detection of biomarker proteins holds significant promise for personalized cancer diagnostics. Here we describe the incorporation of a novel on-line chamber to capture cancer biomarker proteins on magnetic beads derivatized with 300,000 enzyme labels and 40,000 antibodies into a modular microfluidic immunoarray. Capture and detection chambers are produced from PDMS on machined molds and do not require lithography. Protein analytes are captured from serum or other biological samples in the stirred capture chamber on the beads held in place magnetically. The beads are subsequently washed free of sample components, and wash solutions sent to waste. Removal of the magnet and valve switching sends the magnetic bead-protein bioconjugates into a detection chamber where they are captured on 8 antibody-decorated gold nanoparticle-film sensors and detected amperometrically. Most steps in the immunoassay including protein capture, washing and measurement are incorporated into the device. In simultaneous assays, the microfluidic system gave ultralow detection limits of 5 fg mL−1 for interleukin-6 (IL-6) and 7 fg mL−1 for IL-8 in serum. Accuracy was demonstrated by measuring IL-6 and IL-8 in conditioned media from oral cancer cell lines and showing good correlations with standard ELISAs. The on-line capture chamber facilitates rapid, sensitive, repetitive protein separation and measurement in 30 min in a semi-automated system adaptable to multiplexed protein detection.
1. Introduction
Molecule-based early cancer diagnoses promise to improve treatment outcomes and patient survival rates (Etzioni et al., 2003; Rusling et al., 2010). Current cancer diagnostics often rely on biopsies, observing symptoms or lesions, or in vivo imaging. These approaches depend on finding a tumor, making early detection difficult and possibly compromising therapy outcomes. Screening for cancer without detecting tumors can be based on assays of body fluids for cancer biomarker proteins to provide an instantaneous record of a patient’s disease status (Hanash et al., 2008; Kulasingam and Diamandis, 2008; Lilja et al., 2008; Rusling et al., 2010). For translation to the clinic, measurement devices for biomarker proteins should be accurate, sensitive, cheap and preferably capable of point-of-care (POC) use. For reliable diagnoses of cancers, it will be essential to measure panels of biomarker proteins rather than single proteins for the best prediction efficiency (Gubala et al., 2012; Rusling et al., 2010).
Existing methods for measuring protein biomarkers including enzyme linked immunosorbent assay (ELISA) (Kingsmore, 2006), magnetic bead-based assays (Beveridge et al., 2011; Rusling et al., 2010) and liquid chromatography-mass spectrometry (LC-MS) (Hawkridge and Muddiman, 2009) are currently too expensive, time consuming, and technically complex for multiplexed POC protein determinations in clinical samples. Arrays based on optical (Chin et al., 2011; Lee et al., 2008), electrochemical (Chikkaveeraiah et al., 2011; Rusling, 2012; Rusling, 2013; Wang, 2007; Wei et al., 2009;) or nanotransistor (Patolsky et al., 2006) detection have been developed to overcome some of these limitations (Chin et al., 2012; Gubala et al., 2012). In reality, selected detection approaches can already achieve the high sensitivity and accuracy necessary for clinical applications, but complexity, cost and to a lesser extent multiplexing issues hold back clinical applications.
Microfluidics can improve immunoassay speed, cost and multiplexing (Chin et al., 2012; Gervais et al., 2011; Manz et al., 1992; Pan et al., 2010; Wang et al., 2010; Whitesides, 2006). For example, an integrated microfluidic system recently reported for clinical diagnosis of HIV and syphilis detects antibodies to the disease vectors at clinical levels (Chin et al., 2011). This chip used optical detection to analyze 1 μL of whole blood within 20 min in clinics in the developing world. However, improvements in integrated microfluidic systems still need to address multiplexing and other complexity issues.
We have developed modular microfluidic systems to facilitate fast multiplexed detection of proteins in biomedical samples (Chikkaveeraiah et al., 2011; Krause, et al., 2013; Malhotra et al., 2012). These devices feature a sensor array coated with gold nanoparticle (AuNP)-antibody conjugates in a poly(dimethylsiloxane) (PDMS) microchannel interfaced to a syringe pump and sample injector. Paramagnetic beads loaded with multiple detection antibodies and horseradish peroxidase (HRP) enzyme labels are used to capture protein analytes from sample solutions in small vials to provide detection of biomarker proteins in serum down into the low fg mL−1 range (Malhotra et al., 2012). Accuracy and diagnostic utility of these microfluidic arrays was demonstrated by measuring four biomarker proteins in oral cancer patient serum samples.
While useful for diagnostics, the above system would benefit from simpler operation for clinical and POC screening. Herein we report incorporation of a new on-line protein capture chamber into a modular microfluidic system. We used magnetic beads coated with ~40,000 antibodies and ~300,000 HRP labels, and validated the new system for simultaneous immunoassays of two proteins. The capture chamber features an oval PDMS channel equipped with a tiny stir bar sandwiched between two transparent poly(methyl methacrylate) (PMMA) plates (Fig. 1 and S1). The bioconjugated magnetic beads and protein samples are incubated in the chamber for on-line protein capture. After washing the beads and sending the wash to waste, the protein-magnetic beads are directed into the microfluidic detection chamber housing the 8-sensor AuNP array. This new design allows semi-automated ultrasensitive assays to be completed in the microfluidic device within 30 min. Nanostructured sensors combined with massively labeled magnetic detection beads provided simultaneous assays with detection limits (DLs) of 5 fg mL−1 for IL-6 and 7 fg mL−1 for IL-8 in serum, similar to DLs for off-line manual protein capture. Accuracy was demonstrated by measuring these proteins in conditioned media for oral cancer cell lines, with good correlations with standard ELISA.
Fig. 1.

Photographs of microfluidic system for on-line protein capture and detection using magnetic beads. (A) Capture chamber in which target proteins are captured on-line from the sample by heavily labeled HRP-antibody-magnetic beads to form protein-bead bioconjugates. These are washed, and then flowed into the detection chamber (B) in the modular microfluidic system (C). The magnet (D) traps bioconjugate beads in the channel during injection of sample and washing, and is removed for transfer of beads to the detection chamber.
2. Experimental Section
2.1 Chemicals and Materials
Biotinylated horseradish peroxidase (HRP, MW 44,000, 250–330 unit mg−1), β-glutathione reduced (GSH, 99%), gold (III) chloride trihydrate (HAuCl4·3H2O, 99.9%), sodium borohydride (99%), poly(diallyldimethylammonium chloride) (PDDA, MW 100,00–200,000, 20%), bovine serum albumin (BSA), 1-(3-(Dimethylamino)propyl)-3-ethylcarbodiimide hydrochloride (EDC) and N-hydroxysulfosuccinimide (NHSS) were from Sigma. Hydrogen peroxide (H2O2, 30%) was from Fisher. The poly(dimethoxy)silane (PDMS) kit was from Dow Corning. Buffer pH 7.4 phosphate saline (PBS) was 0.01 M in phosphate, 0.14 M NaCl, 2.7 mM KCl. Tween-20 and hydroquinone (HQ, ≥ 99%) were from Sigma-Aldrich. Streptavidin-coupled superparamagnetic beads (1 μm, Dynabeads) were from Invitrogen. Monoclonal Human IL-6 Antibody (Ab1, clone no. 6708), human IL-6 biotinylated polyclonal antibody (Ab2, goat IgG), monoclonal human CXCL8/IL-8 antibody (Ab1, clone no. 6217), human CXCL8/IL-8 biotinylated polyclonal Antibody (Ab2, goat IgG), protein standards, and ELISA kits were from R&D systems. Screen-printed carbon arrays with 8 700 μm dia. sensors were from Kanichi Research (UK). Conditioned media from known oral cancer and control cell lines (Jeon et al., 2004; Sriuranpong et al., 2003) were supplied by the National Institute of Dental and Craniofacial Research (NIDCR), NIH, Bethesda, MD.
2.2 Instrumentation
Amperometric measurements were done at ambient temperature with a CHI 1040 electrochemical workstation. The modular microfluidic immunoarray system incorporates an on-line protein capture chamber (Fig. 1) upstream of an 8-sensor detection device that we reported previously (Chikkaveeraiah et al., 2011). Additional experimental details are presented in the supporting information (SI) file.
The capture chamber features an internal layer of flexible PDMS prepared on a machined template to have an oval hole sandwiched in between two flat, machined PMMA plates (Fig. S1, SI). When bolted tightly together, this assembly forms an oval cylindrical channel 1.5 mm wide, 1.8 mm thick and 100 ± 2 μL in volume housing a tiny magnetic stir bar. Flow out of this channel can be directed to waste or to the detection chamber by a switch valve system. The detection chamber is a PMMA-supported PDMS slab, with rectangular channel 1.5 mm wide, 2.8 cm long, 1.8 mm thick and 63 ± 2 μL volume placed on top of 8-electrode gold nanoparticle-antibody coated screen-printed carbon array (Chikkaveeraiah et al., 2011). The top PMMA plate features ports to connect 0.2 mm i.d. PEEK tubing at inlet and outlet. The detection chamber has a 0.6 mm dia. hole for inserting a Ag/AgCl reference wire and 0.2 mm dia. hole for a Pt wire counter electrode that both run in the top PMMA plate along the entire length of the detection channel (Fig. 1). A syringe pump (Harvard, no. 70 4504) was connected to 2 switch valves via sample injector (Rheodyne, 9725i) using 0.2 mm i.d. tubing. These 2 valves enable changing the direction of flow from reaction chamber to waste or to the detection chamber.
2.3 Preparation of Ab2 -magnetic particle -HRP (Ab2-MP-HRP) and sensors
Biotinylated secondary antibodies (Ab2) and biotinylated HRP labels were attached onto the 1 μm diameter streptavidin-coated superparamagnetic beads (MPs) as previously described (Malhotra et al., 2012). From enzyme activity assays (Chikkaveeraiah et al., 2011; Putter, 1983) the number of HRP labels per MP was 321,000 (± 23,000). The average number of Ab2 per MP was 38,000 (± 7,000) from the bicinchoninic acid assay (BCA) kit (Chikkaveeraiah et al., 2011; Smith et al., 1985; Wiechelman et al., 1988).
Monolayer films of 5 nm glutathione-decorated gold nanoparticles (GSH-AuNPs) (Mani et al., 2009) were deposited on the sensors on an underlayer of adsorbed PDDA as previously reported (Malhotra et al., 2012). Primary antibodies (Ab1) were attached onto the GSH-AuNPs on the array via EDC-NHSS amidization overnight. The electrode array was washed and incubated with 2% BSA in PBS for 1 hr to block non-specific binding (NSB). A fresh AuNP-antibody array is inserted into the detection module for each assay.
2.4 On-line protein analyte capture and detection
The general strategy is illustrated in Fig. 2. Both capture and detection chamber were first subjected to a flow of PBS-Tween 20 detergent solution to minimize NSB. 40 μL of Ab2-MP-HRP (1 mg mL−1 MPs) was added to 120 μL of 20 mM PBS, pH 7.4. This dispersion was then loaded into the 100 μL sample loop and injected at 100 μL min−1 into the capture chamber. 5 μL of protein analyte was diluted in calf serum and then loaded into the sample loop and injected into the chamber. A magnet bar (N55 neodymium magnet) was placed on top of the chamber before sample was injected to trap Ab2-MP-HRP. After the capture chamber was filled with sample, flow was stopped and incubation was allowed for 30 min using the tiny stir bar for mixing. The magnetic stir bar keeps the beds in motion to minimize trapping on PDMS and PMMA plates during incubation. The resulting protein-Ab2-MP-HRP conjugates were then washed with PBS-Tween 20. Flow was then stopped and protein-Ab2-MP-HRP conjugates in the reaction chamber were re-dispersed in the PBS-Tween 20 by removing the magnet. The valve was switched, and protein-Ab2-MP-HRP was then pumped into the detection chamber. After the protein-Ab2-MP-HRP conjugates filled the detection chamber as evidenced by the red-brown color of MPs, flow was stopped and incubation was allowed for 15 min for capture of the beads by antibodies on the sensors. The array was then washed sequentially with PBS-Tween20 and 1 mM HQ in PBS. Amperometric detection was done at −0.2 V vs Ag/AgCl by injecting a mixture of 1 mM HQ and 100 μM H2O2 at 100 μL min−1 into the detection chamber via the sample loop.
Fig. 2.
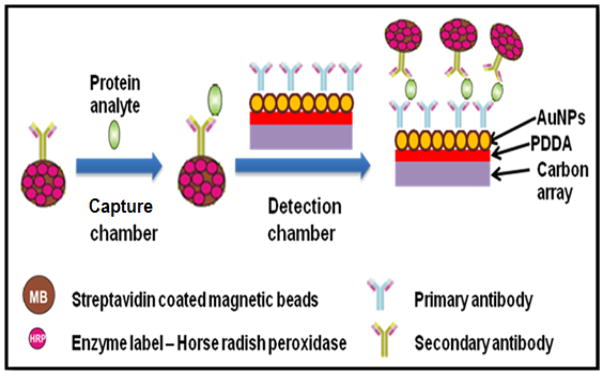
Conceptual strategy for ultrasensitive amperometric detection by microfluidic immunoarray. Protein analytes are captured on-line on Ab2-MP-HRP bioconjugates in capture chamber. The protein-Ab2-MP-HRP is then magnetically separated and washed in the chamber before being transported into the detection chamber.
During incubation in the detection chamber, the direction of flow from capture chamber can be sent to waste, so that the next sample can be loaded for capture with Ab2-MP-HRP. Thus, both protein capture on sample 2 and detection on sample 1 can be done simultaneously to shorten assay time. Ideally, after the measurement of the first sample, the analysis time is ~30 min.
For multiplexed detection, a mixture of 20 μL of Ab2-MP-HRP bioconjugate for each analyte reconstituted with 120 μL of PBS was loaded into the 100 μL sample loop and injected into the reaction chamber, followed by injection of a mixture of IL-6 and IL-8 diluted in calf serum for standard calibrations. The procedure above was then used for simultaneous detection of IL-6 and IL-8. All assay parameters were optimized for high sensitivity and high signal-to-noise ratio. Control experiments employed the full immunoassay procedure without antigen (IL-6 and IL-8), and the response reflects the sum of residual non-specific binding and direct reduction of hydrogen peroxide.
3. Results
3.1 Array Characterization
The detection module of the system incorporates screen-printed carbon arrays coated with 5 nm GSH-AuNPs on ultrathin underlayers of poly(diallyldimethylamine) (PDDA) into a 63 μL microfluidic channel (Chikkaveeraiah et al., 2011). Tapping-mode AFM images of the uncoated carbon arrays revealed a rough surface featuring hills and valleys with mean surface roughness 17 ± 0.8 nm (Fig. S2A, SI). AFM images of arrays coated with PDDA/GSH-AuNPs revealed nearly complete coverage with AuNPs resulting in decreased mean surface roughness of 14.5 ± 1.2 nm (Fig. S2B, SI). After attachment of Ab1 onto the GSH-AuNP arrays, AFM showed broad globular features characteristic of immobilized antibodies on AuNP underlayer (Mani et al., 2009) (Fig. S2C, SI), with mean surface roughness of 12.4 ± 0.9 nm. The electrochemical surface area after coating with AuNPs was estimated to be 2.5 (±0.3) × 10−3 cm2 using cyclic voltammetry of 1 mM ferrocyanide and the Randles-Sevcik equation for the 8 electrodes (Chikkaveeraiah et al., 2011).
3.2 Immunoarray Calibration
We chose IL-6 and IL-8 as test analyte proteins because they are established biomarkers for oral, breast, prostate, and colorectal cancer (Xie, 2001). IL-6 is a 20 kDa cytokine implicated in inflammation, acute phase reaction, growth regulation and differentiation of cells (Deckert and Legay, 2000). Average concentration of IL-6 in serum of a healthy individual is < 6 pg mL−1 while in patients with oral cancer it ranges from 20 to over 1000 pg mL−1 (Riedel et al., 2005). IL-8 is an 8 kDa cytokine involved in inflammatory response, with serum levels in healthy individuals at ≤ 13 pg mL−1 compared to 20 – 1000 pg mL−1 or more in cancer patients (Gokhale et al., 2005).
The microfluidic on-line capture system was first optimized for individual solutions of pure IL-6 and IL-8 in undiluted calf serum which contains an abundance of other proteins and has been shown to be a good surrogate for human serum in immunoarrays. (Yu et al., 2006). The total protein content of calf serum is 5.5–8.0% (Sigma Aldrich) while that of human serum is 4.0–9.0%. A key to achieving the best sensitivity and DLs is minimizing non-specific binding (NSB). For this purpose, the antibody coated array was incubated with 2% BSA for 1 hr prior to insertion in the detection chamber and all washing steps include 0.05% Tween-20. Since NSB can also occur during incubation at the capture chamber, MPs/proteins are introduced into chamber in PBS containing Tween 20 (T-20) detergent to minimize NSB, then washed again with T-20 solution to remove any unbound protein before dispensing captured proteins into the detection chamber. Optimization of surface concentrations of Ab1 on the sensors and secondary antibody (Ab2) on the MP are also critical. Best performance was obtained using 100 μg mL−1 Ab1 for attachment to sensors, and 20 μg mL−1 Ab2 for attachment to MPs.
MPs with attached HRP labels and antibodies for IL-6 or IL-8 were reconstituted in PBS, loaded into the sample loop, and injected into the capture chamber. Their positions are easily followed by their red-brown color. With the beads held in the capture chamber by a magnet, standards containing IL-6 or IL-8 in undiluted calf serum were injected, and flow was stopped when the sample completely filled the capture chamber. After incubation to capture the analyte proteins on the beads and subsequent washing, the magnet is removed and flow is switched so that the protein-bioconjugate beads are transported to the detection chamber. Again flow is stopped when the beads fill the detection chamber, and the beads are captured by the second set of antibodies on the sensors. Following protein capture and washing with PBS-Tween 20, a mixture of hydrogen peroxide to activate HRP and hydroquinone as mediator is then injected via the sample loop to develop the amperometric peaks (Fig. 3A and C). A fresh 8-electrode array was inserted into the detection chamber for each sample, and this can be done while protein capture of the sample is occurring. Using this protocol, peak currents increased linearly from 3 to 5,000 fg mL−1 for IL-6 and 5.8 to 3,750 fg mL−1 for IL-8. Lower concentrations represent DLs, measured as three times the average standard deviation plus the zero protein control. Peaks with no analyte protein (controls) are caused by a combination of direct reduction of hydrogen peroxide and NSB of the labeled magnetic particles on the array. Excellent array-to-array reproducibility is illustrated by the small error bars. In these individual protein assays, the sensitivities were 5.3 μA mL [fg protein] −1 cm−2 for IL-6 and 5.7 μA mL [fg protein] −1 cm−2 for IL-8 in undiluted calf serum.
Fig. 3.

Amperometric responses for individual standard solutions of IL-6 and IL-8 in undiluted calf serum at −0.2 V vs. Ag/AgCl developed by injecting a mixture of 1 mM HQ and 0.1 mM H2O2 for (A) IL-6 and (C) IL-8, also showing calibration plots for (B) IL-6 and (D) IL-8 standards. Error bars represent standard deviations (n=8) for the eight electrodes of a single immunoarray.
NSB background can only result from residual NSB from the MPs having no captured analyte. The extent of NSB was compared to that of off-line capture in a small test tube using analyte-free controls. There were no observable differences in peaks produced by on-line and offline protocols (Fig. S3, SI), showing that NSB is minimized to about the same extent by the on-line and off-line capture methods. This observation demonstrates that thorough washing and incubation in the presence of PBS-Tween 20 in the capture and detection chamber is sufficient to minimize NSB. Reproducibility was also tested for 0 and 5 pg mL−1 IL-6 and IL-8 by running the immunoassays on different days with different arrays. Relative standard deviation of the measurements for the two concentrations was <4 % (Fig. S4, SI) confirming good array-to-array and day-to-day reproducibility. The immunosensor was also used to assess antibody cross reactivity using 5 pg mL−1 of IL-6 and IL-8. The cross-reactivity of each antibody was <5 % of the peak current in the absence of the interfering agents (Fig. S5A and B, SI), and was considered within acceptable limits for simultaneous detection of the two proteins.
3.3 Detection of IL-6 and IL-8 in mixtures
For simultaneous detection of IL-6 and IL-8, capture antibodies for each protein were attached to four spots on the array (Fig. S5C, SI). Bioconjugate beads for IL-6 and IL-8 were combined, reconstituted in PBS, loaded into the sample loop, and injected into the reaction chamber, followed by injection of a mixture of IL-6 and IL-8. Incubation, washing, transport to the detection chamber, and detection were done as described above for the single protein standards. The peak currents increased linearly from 5 to 2,500 fg mL−1 for IL-6 and 7 to 3,750 fg mL−1 for IL-8 (Fig. 4). Lower concentrations represent DLs, measured as three times the average standard deviation plus the zero protein control. The standard deviation represents that from four sensor responses in each assay for the multiplexed detection in a single run. The sensitivity of the immunoarray was 4.51 μA mL [fg protein] −1 cm−2 for IL-6 and 4.45 μA mL [fg protein] −1 cm−2 for IL-8 in undiluted calf serum.
Fig. 4.

Amperometric responses for standard protein mixtures in undiluted calf serum at −0.2 V vs Ag/AgCl developed by injecting a mixture of 1 mM HQ and 0.1 mM H2O2 for (A) IL-6 and (C) IL-8, also showing calibration plots for (B) IL-6 and (D) IL-8. Error bars represent standard deviations (n=4) for the four IL-6 or IL-8 antibody-modified electrodes on a single immunoarray.
3.4 Assay Validation with Conditioned Media from Oral Cancer Cells
Oral cancer or head and neck squamous cell carcinoma (HNSCC) is the sixth most common cancer in the developed world (Siegel et al., 2011). High mortality of HNSCC is related to frequent diagnoses at advanced stages (Horowitz and Alfano, 2001; Siegel et al., 2012). IL-6 and IL-8 are associated with HNSCC, and hence accurate monitoring of their levels in patients holds promise for early detection and therapeutic monitoring. To establish method accuracy, we used the microfluidic immunoarray to analyze levels of IL-6 and IL-8 in conditioned media from populations of HNSCC cell lines which contained up to 200 ng mL−1 total protein as measured by the indirect Bradford assay. Samples (5 μL) were diluted in PBS prior to injection into the capture chamber. Good accuracy of the immunoarray is illustrated by linear correlation plots with standard ELISA (Fig. 5). The plots had slopes close to 1.0 (1.00 ± 0.01 for IL-6 and 0.83 ± 0.01 for IL-8) and intercepts close to zero (−0.592 ± 13.4 for IL-6 and 0.458 ± 0.29), confirming good correlation (Table S1, SI). Fig. S6 (SI) shows comparative results for IL-6 and IL-8 in these samples by on-line capture immunoassays and standard ELISA. Cancer cell lines HN12, HN13 and Cal27 secreted large amounts of IL-6 and IL-8 (>1,000 pg mL−1), while immortalized HaCaT cells established from normal cancer-free epidermal cells showed low levels.
Fig. 5.
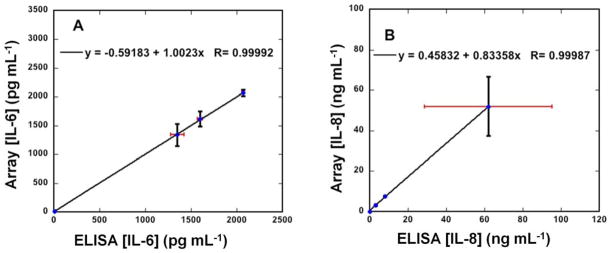
Correlation plots of immunoarray assay results for conditioned media of HaCat, HN12, HN13 and Cal27 cell lines vs. standard ELISA assays for (A) IL-6 and (B) IL-8 (also see Fig. S6, SI). Error bars represent standard deviations for the immunoarray for n=4, and where not apparent are smaller than the point size.
4. Discussion
Results described above demonstrate that the modular microfluidic system with the addition of a chamber for automated on-line capture of protein biomarkers onto massively multilabeled magnetic beads can accurately detect two protein cancer biomarkers in serum with high sensitivity and ultralow DLs. The MPs have high surface area to volume ratio here enabling attachment of 300,000 HRP labels and 40,000 antibodies to provide extremely efficient protein capture (Mani et al., 2012) as well as high sensitivity. Magnetic bead position is controlled magnetically in the online capture chamber for rapid binding of proteins, washing, and delivery to the detection chamber. Sensitivities in undiluted calf serum from slopes of the calibration curves were 4.5 μA mL [fg protein] −1 cm−2 for both IL-6 and IL-8. In contrast, assays using a similar microfluidic device with no capture chamber, off-line protocol, using beads with 400,000 HRP labels in simultaneous assays of 4 oral cancer proteins gave sensitivities of 5.9 μA mL [fg protein] −1 cm−2 for IL-6 and 6.8 μA mL [fg protein] −1 cm−2 for IL-8 in serum (Malhotra et al., 2012). The slight decrease in sensitivity for the present on-line capture system can be attributed to fewer HRP labels used in Ab2-MP-HRP. DLs of 5 fg mL−1 for IL-6 and 7 fg mL−1 for IL-8 for the on-line capture system were slightly better than the 10 fg mL−1 for both IL-6 and IL-8 in the earlier 4-protein off-line capture assay (Malhotra et al., 2012). Thus, the new on-line protein capture chamber incorporated into the earlier microfluidic detection system exhibited comparable sensitivity and about 2-fold better DLs.
Very good accuracy of the assay system was confirmed by the correlation of immunoarray results on conditioned media for oral cancer cell lines with ELISA assays (Fig. 5 and Table S1, SI). Assays were done using 5 μL of conditioned media diluted in PBS to fit the dynamic range of the immunoassay. Selectivity was confirmed by accurate simultaneous detection of IL-6 and IL-8 in the conditioned cell media that also contains hundreds of other proteins, many at relatively high concentrations. Results suggest that the sensor will be suitable for use with a variety of real samples. In addition, the immunosensor gave good reproducibility as demonstrated by small array-to-array standard deviations (Fig. 4 and 5) suggesting suitability for future clinical applications.
Inclusion of the on-line protein capture module provides a more automated strategy compared to the earlier device that required off-line capture since capture and washing are done in the microfluidic system, not manually as previously (Chikkaveeraiah et al., 2011; Malhotra et al., 2012). In the new system, most immunoassay steps are incorporated into the microfluidic device, requiring only loading of reagents, samples and wash solutions by the operator. The assay requires 30 min, which is less than 50 min for the off-line capture assay (Malhotra et al., 2012) and much less than standard ELISA (>5 hrs) (Findlay et al., 2000) and other commercial detection methods. Thus, assay time and level of automation begins to approach the needs of POC applications (Gubala et al., 2012; Soper et al., 2006), but further simplification of reagent addition will be required. The system has multiplexing capability for up to 8 proteins at attomolar levels with DLs 100–1,000 fold better than ELISA and commercial multiprotein bead assays, which have DLs of 1–10 pg mL−1 for many proteins (Lilja et al., 2008; Rusling, 2010; Ward et al., 2001).
In summary, we have fabricated and validated a modular microfluidic system featuring novel on-line capture of analyte proteins on magnetic beads to detect multiple cancer biomarker proteins. PDMS chambers are fabricated on machined molds, so that no lithography is needed. They are coupled to inexpensive commercial components so the system can be accessible to virtually any biomedical laboratory. Proof-of-concept was established by fast ultrasensitive, selective, reproducible detection of two proteins in biologically relevant mixtures. Partial automation and short analysis time suggest promise for clinical diagnosis of cancer and therapeutic monitoring, although further simplification is desirable. On-line capture on magnetic beads is also promising for integration into other low-cost microfluidic systems.
Supplementary Material
Highlights.
A modular microfluidic system for multiple protein detection is described that incorporates online magnetic bead capture of proteins.
Massively labeled, antibody laden magnetic beads capture the proteins and deliver them to a sensor array.
Detection of two proteins in serum was achieved with detection limits of 5 fg mL−1.
Good correlations were found with standard ELISA for two proteins in conditioned media of oral cancer cell lines.
Microfluidic chambers are fabricated with non-lithographic procedures and coupled to inexpensive commercial components.
Acknowledgments
This work was financially supported by grant EB014586 from the National Institute of Biomedical Imaging and Bioengineering (NIBIB), NIH, USA. The authors thank Drs. V. Patel and S. Gutkind of the Oral and Pharyngeal Cancer Branch, NIDCR, National Institutes of Health for supplying cancer cell conditioned media samples.
Footnotes
Publisher's Disclaimer: This is a PDF file of an unedited manuscript that has been accepted for publication. As a service to our customers we are providing this early version of the manuscript. The manuscript will undergo copyediting, typesetting, and review of the resulting proof before it is published in its final citable form. Please note that during the production process errors may be discovered which could affect the content, and all legal disclaimers that apply to the journal pertain.
References
- Beveridge JS, Stephens JR, Williams ME. Anal Chem. 2011;4:251–273. doi: 10.1146/annurev-anchem-061010-114041. [DOI] [PubMed] [Google Scholar]
- Chikkaveeraiah BV, Mani V, Patel V, Gutkind JS, Rusling JF. Biosens Bioelectron. 2011;26:4477–4483. doi: 10.1016/j.bios.2011.05.005. [DOI] [PMC free article] [PubMed] [Google Scholar]
- Chin CD, Laksanasopin T, Cheung YK, Steinmiller D, Linder V, Parsa H, Wang J, Moore H, Rouse R, Umviligihozo G, Karita E, Mwambarangwe L, Braunstein SL, van de Wijgert J, Sahabo R, Justman JE, El-Sadr W, Sia SK. Nature Med. 2011;17:1015–1019. doi: 10.1038/nm.2408. [DOI] [PubMed] [Google Scholar]
- Chin CD, Linder V, Sia SK. Lab Chip. 2012;12:2118–2134. doi: 10.1039/c2lc21204h. [DOI] [PubMed] [Google Scholar]
- Deckert F, Legay FO. J Pharm Biomed Anal. 2000;23:403–411. doi: 10.1016/s0731-7085(00)00313-7. [DOI] [PubMed] [Google Scholar]
- Etzioni R, Urban N, Ramsey S, McIntosh M, Schwartz S, Reid B, Radich J, Anderson G, Hartwell L. Nat Rev Cancer. 2003;3:243–252. doi: 10.1038/nrc1041. [DOI] [PubMed] [Google Scholar]
- Findlay JWA, Smith WC, Lee JW, Nordblom GD, Das I, DeSilva BS, Khan MN, Bowsher RR. J Pharm Biomed Anal. 2000;21:1249–1273. doi: 10.1016/s0731-7085(99)00244-7. [DOI] [PubMed] [Google Scholar]
- Gervais L, de Rooij N, Delamarche E. Adv Mater. 2011;23:H151–H176. doi: 10.1002/adma.201100464. [DOI] [PubMed] [Google Scholar]
- Gokhale AS, Haddad RI, Cavacini LA, Wirth L, Weeks L, Hallar M, Faucher J, Posner MR. Oral Oncol. 2005;41:70–76. doi: 10.1016/j.oraloncology.2004.06.005. [DOI] [PubMed] [Google Scholar]
- Gubala V, Harris LF, Ricco AJ, Tan MX, Williams DE. Anal Chem. 2012;84:487–515. doi: 10.1021/ac2030199. [DOI] [PubMed] [Google Scholar]
- Hanash SM, Pitteri SJ, Faca VM. Nature. 2008;452:571–579. doi: 10.1038/nature06916. [DOI] [PubMed] [Google Scholar]
- Hawkridge AM, Muddiman DC. Ann Rev Anal Chem. 2009;2:265–277. doi: 10.1146/annurev.anchem.1.031207.112942. [DOI] [PMC free article] [PubMed] [Google Scholar]
- Horowitz AM, Alfano MC. J Am Dent Assoc. 2001;132:5S–6S. doi: 10.14219/jada.archive.2001.0383. [DOI] [PubMed] [Google Scholar]
- Jeon GA, Lee JS, Patel V, Gutkind JS, Thorgeirsson SS, Kim EC, Chu IS, Amornphimoltham P, Park MH. Int J Cancer. 2004;112:249–258. doi: 10.1002/ijc.20399. [DOI] [PubMed] [Google Scholar]
- Kingsmore SF. Nature Rev. 2006;5:310–320. doi: 10.1038/nrd2006. [DOI] [PMC free article] [PubMed] [Google Scholar]
- Krause CE, Otieno BA, Latus A, Faria RC, Patel V, Gutkind JS, Rusling JF. Chemistry Open. 2013 doi: 10.1002/open.201300018. submitted. [DOI] [PMC free article] [PubMed] [Google Scholar]
- Kulasingam V, Diamandis EP. Nat Clin Pract Oncol. 2008;5:588–599. doi: 10.1038/ncponc1187. [DOI] [PubMed] [Google Scholar]
- Lee HJ, Wark AW, Corn RM. Analyst. 2008;133:975–983. doi: 10.1039/b717527b. [DOI] [PMC free article] [PubMed] [Google Scholar]
- Lilja H, Ulmert D, Vickers AJ. Nat Rev Cancer. 2008;8:268–278. doi: 10.1038/nrc2351. [DOI] [PubMed] [Google Scholar]
- Malhotra R, Patel V, Chikkaveeraiah BV, Munge BS, Cheong SC, Zain RB, Abraham MT, Dey DK, Gutkind JS, Rusling JF. Anal Chem. 2012;84:6249–6255. doi: 10.1021/ac301392g. [DOI] [PMC free article] [PubMed] [Google Scholar]
- Mani V, Chikkaveeraiah BV, Patel V, Gutkind JS, Rusling JF. ACS Nano. 2009;3:585–594. doi: 10.1021/nn800863w. [DOI] [PMC free article] [PubMed] [Google Scholar]
- Mani V, Chikkaveeraiah BV, Rusling JF. Exp Opin Med Diagnostics. 2011;5:381–391. doi: 10.1517/17530059.2011.607161. [DOI] [PMC free article] [PubMed] [Google Scholar]
- Mani V, Wasalathanthri DP, Joshi AA, Kumar CV, Rusling JF. Anal Chem. 2012;84:10485–10491. doi: 10.1021/ac3028257. [DOI] [PMC free article] [PubMed] [Google Scholar]
- Manz A, Harrison DJ, Verpoorte EMJ, Fettinger JC, Paulus A, Ludi H, Widmer HM. J Chromatogr. 1992;593:253–258. [Google Scholar]
- Pan Y, Sonn GA, Sin MLY, Mach KE, Shih MC, Gau V, Wong PK, Liao JC. Biosens Bioelectron. 2010;26:649–654. doi: 10.1016/j.bios.2010.07.002. [DOI] [PMC free article] [PubMed] [Google Scholar]
- Patolsky F, Zheng G, Lieber CM. Anal Chem. 2006;78:4260–4269. doi: 10.1021/ac069419j. [DOI] [PubMed] [Google Scholar]
- Pütter J. In: Methods of Enzymatic Analysis 3. Becker R, Bergmeyer HU, editors. Verlug Chemie; Deerfield Beach, FL: 1983. pp. 286–293. [Google Scholar]
- Riedel F, Zaiss I, Herzog D, Gotte K, Naim R, Horman K. Anticancer Res. 2005;25:2761–2765. [PubMed] [Google Scholar]
- Rusling JF. Chem Record. 2012;12:164–176. doi: 10.1002/tcr.201100034. [DOI] [PMC free article] [PubMed] [Google Scholar]
- Rusling JF, Kumar CV, Gutkind JS, Patel V. Analyst. 2010;135:2496–2511. doi: 10.1039/c0an00204f. [DOI] [PMC free article] [PubMed] [Google Scholar]
- Rusling J, Munge B, Sardesai N, Malhotra R, Chikkaveeraiah B. Nanoscience-based electrochemical sensors and arrays for detection of cancer biomarker proteins. In: Crespilho FN, editor. Nanobioelectrochemistry. Springer-Verlag; Berlin-Heidelberg: 2013. pp. 1–26. [Google Scholar]
- Siegel R, Naishadham D, Jemal A. CA Cancer J Clin. 2012;62:10–29. doi: 10.3322/caac.20138. [DOI] [PubMed] [Google Scholar]
- Siegel R, Ward E, Brawley O, Jemal A. CA Cancer J Clin. 2011;61:212–236. doi: 10.3322/caac.20121. [DOI] [PubMed] [Google Scholar]
- Smith PK, Krohn RI, Hermanson GT, Mallia AK, Gartner FH, Provenzano MD, Fujimoto EK, Goeke NM, Olson BJ, Klenk DC. Anal Biochem. 1985;150:76–85. doi: 10.1016/0003-2697(85)90442-7. [DOI] [PubMed] [Google Scholar]
- Soper SA, Brown K, Ellington A, Frazier B, Garcia-Manero G, Gau V, Gutman SI, Hayes DF, Korte B, Landers JL, Larson D, Ligler F, Majumdar A, Mascini M, Nolte D, Rosenzweig Z, Wang J, Wilson D. Biosens Bioelectron. 2006;21:1932–1942. doi: 10.1016/j.bios.2006.01.006. [DOI] [PubMed] [Google Scholar]
- Sriuranpong V, Park JI, Amornphimoltham P, Patel V, Nelkin BD, Gutkind JS. Cancer Res. 2003;63:2948–2956. [PubMed] [Google Scholar]
- Wang J. Electroanalysis. 2007;19:769–776. [Google Scholar]
- Wang J, Ahmad H, Ma C, Shi Q, Vermesh O, Vermesh U, Heath J. Lab Chip. 2010;10:3157–3162. doi: 10.1039/c0lc00132e. [DOI] [PMC free article] [PubMed] [Google Scholar]
- Ward AM, Catto JW, Hamdy FC. Ann Clin Biochem. 2001;38:633–651. doi: 10.1258/0004563011901055. [DOI] [PubMed] [Google Scholar]
- Wei F, Liao W, Xu Z, Yang Y, Wong DT, Ho CM. Small. 2009;5:1784–1790. doi: 10.1002/smll.200900369. [DOI] [PMC free article] [PubMed] [Google Scholar]
- Whitesides GM. Nature. 2006;442:368–373. doi: 10.1038/nature05058. [DOI] [PubMed] [Google Scholar]
- Wiechelman KJ, Braun RD, Fitzpatrick JD. Anal Biochem. 1988;175:231–237. doi: 10.1016/0003-2697(88)90383-1. [DOI] [PubMed] [Google Scholar]
- Xie K. Cytokine Growth Factor Rev. 2001;12:375–391. doi: 10.1016/s1359-6101(01)00016-8. [DOI] [PubMed] [Google Scholar]
- Yu X, Munge B, Patel V, Jensen G, Bhirde A, Gong JD, Kim SN, Gillespie J, Gutkind JS, Papadimitrakopoulos F, Rusling JF. J Am Chem Soc. 2006;128:11199–11205. doi: 10.1021/ja062117e. [DOI] [PMC free article] [PubMed] [Google Scholar]
Associated Data
This section collects any data citations, data availability statements, or supplementary materials included in this article.