Donor-strand complemented AggA subunit of aggregative adherence fimbriae type I from Shiga toxin-producing E. coli O104:H4 was crystallized. Diffraction data were collected to 1.55 Å resolution. Initial phases were derived from a sulfur single anomalous diffraction experiment.
Keywords: aggregative adherence fimbriae, chaperone/usher pathway, Shiga toxin-producing Escherichia coli O104, H4, sulfur single anomalous diffraction
Abstract
The outbreak of Shiga toxin-producing Escherichia coli O104:H4 infection in Germany in 2011 was associated with significant mortality and morbidity owing to the progressive development of haemolytic-uraemic syndrome. The outbreak strain emerged recently as a result of horizontal transfer events leading to the acquisition of a number of virulence factors. Among them, aggregative adherence fimbriae type I (AAF/I) are considered to be particularly important since they are involved in the initial attachment of bacteria to the intestinal mucosa. Here, the crystallization and preliminary X-ray diffraction analysis of the major subunit of AAF/I, AggA, are reported. Crystallization of recombinant donor-strand complemented AggA was performed by the vapour-diffusion method. The crystals diffracted to 1.55 Å resolution and belonged to the orthorhombic space group C2221, with unit-cell parameters a = 77.83, b = 80.17, c = 91.42 Å. Despite a low sulfur content of the protein [0.57%(w/w)], sufficiently accurate initial phases were derived from a sulfur SAD experiment.
1. Introduction
The recent outbreak of enterohaemorrhagic gastroenteritis and haemolytic-uraemic syndrome (HUS) related to infections with Shiga toxin-producing Escherichia coli O104:H4 was one of the largest outbreaks of HUS (Wu et al., 2011 ▶). Among 4137 infected persons, 896 developed HUS and 54 died. Genome sequencing of isolates from the German outbreak revealed that this was a typical enteroaggregative E. coli (EAEC) strain which had been lysogenized with a phage encoding Shiga toxin 2 (Rasko et al., 2011 ▶). The combination of these factors resulted in a highly virulent Shiga toxin-producing EAEC strain.
The attachment of EAEC to the intestinal mucosa is critical for infectivity (Nataro, 2005 ▶). The attachment is mediated by aggregative adherence fimbriae (AAFs), surface-exposed proteinaceous structures that specifically bind to host-cell receptors. Four types of AAFs have been described to date: AAF/I–III and Hda (Boisen et al., 2008 ▶). AAFs are assembled from two protein subunits, a major adhesive subunit (A) and a minor subunit (B) of unknown function, via the FGL-periplasmic chaperone–usher (CU) pathway polyadhesin assembly machinery (Zav’yalov et al., 2010 ▶; Zavialov et al., 2007 ▶). Subunits of CU fimbriae are linked together by donor-strand complementation (DSC), with the N-terminal sequence (donor strand) of one subunit inserted into the hydrophobic cleft of a neighbouring subunit.
Knowledge of the AAF structure is crucial for understanding the mechanism of EAEC pathogenesis. Here, we report the purification and crystallization of the donor-strand complemented major subunit of AAF/I, dsc-AggA, and the solution of the structure using the sulfur single anomalous diffraction (S-SAD) phasing method.
2. Materials and methods
2.1. Protein expression and purification
Donor-strand complemented (Zavialov, Berglund, Pudney et al., 2003 ▶; Zavialov et al., 2005 ▶) dsc-AggA was produced by relocating residues 29–40 of AggA, the donor strand, to the C-terminus following a DNKQ linker (Table 1 ▶). An ASQHHHHHH tag was added after the periplasm-targeting signal peptide for purification purposes (Yu, Dubnovitsky et al., 2012 ▶; Yu, Fooks et al., 2012 ▶; Zavialov, Berglund & Knight, 2003 ▶). The gene was placed under the control of the T7 promoter of pET101D (Invitrogen) as described in Roy et al. (2012 ▶) to produce the pET101D-AggAdsA-O104H4 plasmid. The plasmid was transformed into E. coli strain BL21-AI (Invitrogen). E. coli transformants were cultivated in Luria–Bertani medium containing ampicillin (100 mg ml−1) at 310 K. The cells were induced with 1 mM isopropyl β-d-1-thiogalactopyranoside and 0.2% arabinose for protein expression and were then cultivated for 3 h. Expressed proteins were extracted by osmotic shock as described in Chapman et al. (1999 ▶). About 60% dsc-AggA leaked into the 20% sucrose, 5 mM EDTA, 50 mM Tris–HCl pH 8.0 solution (sucrose fraction) and 40% dsc-AggA was extracted by 5 mM MgSO4 (periplasmic fraction). The target protein was purified by immobilized metal-ion affinity chromatography in 20 mM sodium phosphate, 0.5 M sodium chloride, 5 mM imidazole buffer pH 7.4 using a 5 ml HiTrap Ni-IMAC column (GE Healthcare) at 277 K. A 5–500 mM gradient of imidazole was used to elute the protein. The protein sample was dialyzed overnight in 50 mM HEPES buffer pH 7.5 and further purification was performed by cation-exchange chromatography in 50 mM HEPES buffer pH 7.5 using a Mono S 5/50 GL column (GE Healthcare) with a 0–300 mM gradient of NaCl at 297 K. To obtain the highest purity samples, proteins were subjected to gel filtration on a Superdex 75 16/60 HiLoad column (GE Healthcare) equilibrated with 50 mM HEPES, 150 mM NaCl buffer pH 7.5 at 277 K. The protein was concentrated to 30 and 83 mg ml−1 for crystallization experiments using a Vivaspin device (GE Healthcare) with a molecular-weight cutoff of 5 kDa. The protein concentration was determined by absorption measurements at 280 nm using a molar extinction coefficient of 21 150 cm−1 M −1. The final yield of the protein was about 2 mg per litre of cell culture.
Table 1. Macromolecule-production information.
| Source organism | Shiga toxin-producing E. coli O104:H4 that caused anoutbreak of haemolytic-uraemic syndrome in Germany in 2011 |
| DNA source | Oligonucleotide synthesis |
| Expression vector | pET101D-AggAdsA-O104H4 (produced based on pET101D from Invitrogen) |
| Expression host | E. coli strain BL21-AI (Invitrogen) |
| Complete amino-acid sequence of the construct produced | MKTLKNMRRKNLYITLGLVSLLSGGANAASQHHHHHHVTNDCPVTITTTPPQTVGVSSTTPIGFSAKVTTSDQCIKAGAKVWLWGTGPANKWVLQHAKVAKQKYTLNPSIDGGADFVNQGTDAKIYKKLTSGNKFLNASVSVNPKTQVLIPGEYTMILHAAVDFDNKQGGASQQTTQTIRLTVT, where MKTLKNMRRKNLYITLGLVSLLSGGANA is the signal peptide, HHHHHH is the purification six-His tag, DNKQGG is the linker and ASQQTTQTIRLTVT is the donor strand |
2.2. Crystallization
Initial crystallization conditions were obtained by the sitting-drop vapour-diffusion method using commercial screening kits: Index, Crystal Screen HT (Hampton Research), The JCSG+ Suite (Qiagen) and PACT premier (Molecular Dimensions). Aliquoting was performed with a Mosquito liquid dispenser (TTP LabTech) by mixing protein solution (in 25 mM HEPES, 75 mM NaCl pH 7.5 buffer) and reservoir solution in three different ratios (0.75:1, 1:1 and 1.5:1) in a 96-well plate and equilibrating against 80 µl reservoir solution. A PX Scanner device (Agilent Technologies) was used to examine the diffraction of crystals in the crystallization plates. To improve the crystallization conditions, additional experiments were performed manually by mixing 2 µl protein solution with 2 µl precipitant solution and equilibrating against 500 µl reservoir solution using the hanging-drop vapour-diffusion method at 277 and 290 K.
2.3. Data collection and processing
Crystals were soaked for 30–60 s in cryoprotection solution prepared by mixing two parts of precipitant solution with one part 50% PEG 400 and then cooled by plunging them into liquid nitrogen. Diffraction data were collected under liquid-nitrogen cryoconditions at 100 K on beamline BM14 at the European Synchrotron Radiation Facility (ESRF), Grenoble, France. Data were collected and processed using the XDS program (Kabsch, 2010 ▶). Initial phases were determined by the S-SAD phasing method and initial models were constructed using the PHENIX software package (Adams et al., 2002 ▶). Sulfurs were found with HySS followed by phasing with Phaser and statistical density modification with RESOLVE (solvent flattening and histogram matching).
3. Results and discussion
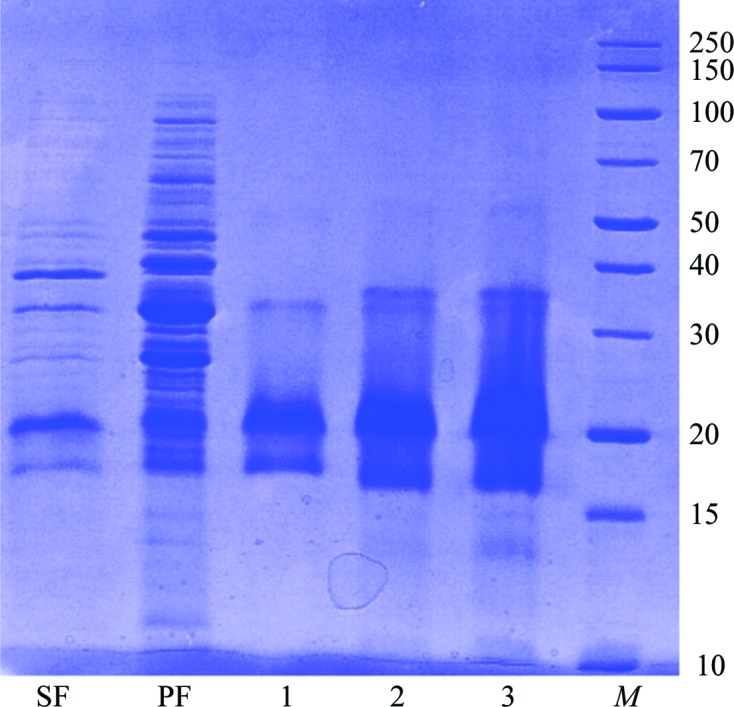
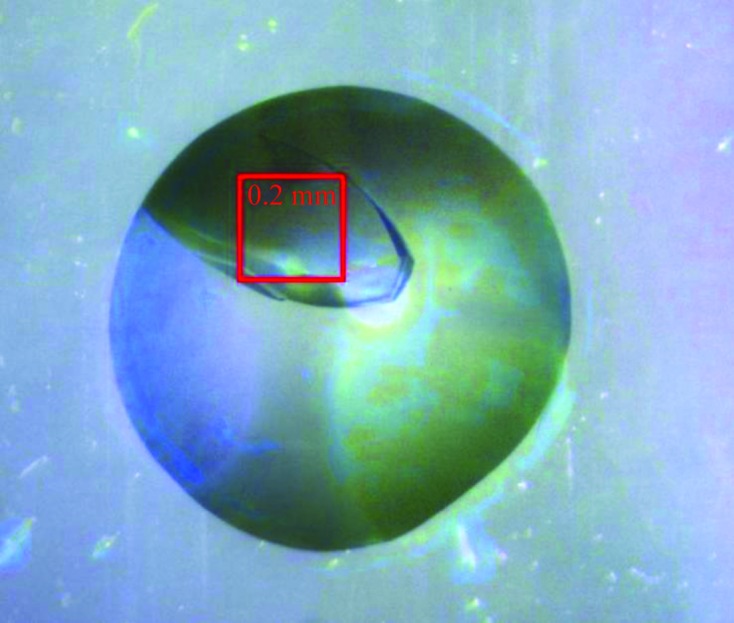
Dsc-AggA accumulated to a high level in the E. coli periplasm (Fig. 1 ▶). A highly homogenous protein sample was obtained with a three-step purification procedure (Fig. 1 ▶). Initial screening of crystallization conditions resulted in the appearance of three-dimensional crystals in a broad range of conditions (Table 2 ▶). The largest crystal (Fig. 2 ▶) grew in drops with 0.2 M sodium acetate, 0.1 M sodium cacodylate pH 6.5, 30%(w/v) PEG 8000. The crystal diffracted to 1.55 Å resolution, revealing the symmetry of a C-centred orthorhombic lattice. A 97.2% complete data set was obtained with an overall R meas of 4.4% (Table 3 ▶). Analysis of the systematic absences suggested C2221 space-group symmetry. The Matthews coefficient V M (the crystal volume per unit of protein molecular weight) assuming the presence of two molecules per crystallographic asymmetric unit was 2.14 Å3 Da−1.
Figure 1.

SDS–PAGE (12%) monitoring of the overexpression and purification of dsc-AggA [lane SF, sucrose fraction (0.03 mg was loaded into the lane); lane PF, periplasmic fraction (0.05 mg was loaded); lane 1, dsc-AggA after 5 ml HiTrap Ni-IMAC column purification (0.08 mg was loaded); lane 2, dsc-AggA after Mono S 5/50 GL column purification (0.08 mg was loaded); lane 3, dsc-AggA after gel filtration (0.15 mg was loaded); lane M, marker (labelled in kDa)]. The band below the main band of the protein probably belongs to dsc-AggA with a cleaved linker loop. The full-length protein was crystallized, judged on the basis of the preliminary model.
Table 2. Conditions for dsc-AggA crystal formation.
| Reservoir solution | Protein concentration (mg ml−1) | Temperature (K) | Time for crystal formation (d) |
|---|---|---|---|
| 0.1 M bis-tris pH 6.5, 2.0 M ammonium sulfate | 30–45 | 277 | 15 |
| 0.1 M Tris pH 8.5, 25%(w/v) PEG 3350 | 30–45 | 277 | 8 |
| 0.2 M ammonium sulfate, 0.1 M HEPES pH 7.5, 25%(w/v) PEG 3350 | 30–45 | 277 | 30 |
| 0.2 M sodium chloride, 0.1 M Tris pH 8.5, 25%(w/v) PEG 3350 | 30–45 | 277 | 8 |
| 0.2 M lithium sulfate monohydrate, 0.1 M bis-tris pH 6.5, 25%(w/v) PEG 3350 | 30–45 | 277 | 8 |
| 0.2 M lithium sulfate monohydrate, 0.1 M HEPES pH 7.5, 25%(w/v) PEG 3350 | 30–45 | 277 | 15 |
| 0.1 M HEPES sodium pH 7.5, 2%(v/v) PEG 400, 2.0 M ammonium sulfate | 30–45 | 277 | 5 |
| 0.2 M sodium acetate, 0.1 M sodium cacodylate pH 6.5, 30%(w/v) PEG 8000 | 83 | 290 | 8 |
Figure 2.

A crystal of dsc-AggA grown in 0.2 M sodium acetate, 0.1 M sodium cacodylate pH 6.5, 30%(w/v) PEG 8000. The picture was obtained using a PX Scanner (Agilent Technologies).
Table 3. Statistics of the X-ray diffraction data sets and sulfur SAD phasing.
Values in parentheses are for the highest resolution shell.
| Native data set | S-SAD data set | |
|---|---|---|
| Wavelength (Å) | 0.954 | 1.75 |
| Temperature (K) | 100 | 100 |
| Detector | MAR225 CCD | MAR225 CCD |
| Crystal-to-detector distance (mm) | 174 | 83 |
| Rotation range per image (°) | 0.5 | 1 |
| Total rotation range (°) | 270 | 720 |
| Exposure time per image (s) | 5 | 5 |
| Space group | C2221 | C2221 |
| Unit-cell parameters (Å, °) | a = 77.83, b = 80.17, c = 91.42, α = β = γ = 90 | a = 78.04, b = 80.28, c = 91.59, α = β = γ = 90 |
| Mosaicity (°) | 0.22 | 0.22 |
| Resolution range (Å) | 47.66–1.55 (1.63–1.55) | 45.80–1.90 (2.00–1.90) |
| Total No. of reflections | 170118 (24737) | 1243785 (155685) |
| No. of unique reflections | 40475 (5758) | 22711 (3199) |
| Completeness (%) | 97.2 (98.8) | 98.7 (96.0) |
| Multiplicity | 4.2 (4.3) | 54.8 (48.7) |
| 〈I/σ(I)〉 | 19.0 (2.1) | 61.6 (8.3) |
| R meas † | 0.044 (0.897) | 0.062 (0.666) |
| R merge ‡ | 0.038 (0.787) | 0.061 (0.652) |
| Overall B factor from Wilson plot (Å2) | 22.2 | 24.3 |
Anomalous signal measurability as a function of resolution. The anomalous signal measurability is defined as the fraction of Bijvoet-related intensity differences for which |δI|/σ(δI) > 3.0 min{I(+)/σ[I(+)], I(−)/σ[I(−)]} > 3.0 holds.
| Resolution shells (Å) | 4.15 | 3.30 | 2.88 | 2.62 | 2.43 | 2.28 | 2.17 | 2.08 | 2.00 | 1.90 |
|---|---|---|---|---|---|---|---|---|---|---|
| Measurability | 0.18 | 0.11 | 0.07 | 0.03 | 0.02 | 0.02 | 0.02 | 0.017 | 0.012 | 0.012 |
Sulfur substructure.
| Positions | ||||||
|---|---|---|---|---|---|---|
| No. | Assignment | x | y | z | Occupancy | B factor (Å2) |
| S1 | SS bond, molecule 2 | −0.438 | 0.167 | 0.657 | 1.214 | 22.0 |
| S2 | SS bond, molecule 1 | −0.151 | 0.059 | 0.403 | 0.846 | 2.0 |
| S3 | Met, molecule 1 | −0.388 | 0.307 | 0.090 | 0.884 | 23.6 |
| S4 | Met, molecule 2 | −0.294 | 0.120 | 0.840 | 0.812 | 25.6 |
| S5 | SS bond, molecule 1 | −0.132 | −0.054 | −0.402 | 0.594 | 3.3 |
| S6 | SS bond, molecule 1 | −0.169 | −0.064 | −0.403 | 0.740 | 2.9 |
| S7 | SS bond, molecule 2 | −0.057 | −0.360 | −0.157 | 0.916 | 16.0 |
R
meas = 
 , where N(hkl) is the multiplicity.
R
merge = 
 , where I(hkl) is the intensity of a reflection hkl,
  is the sum over all reflections and
  is the sum over i measurements of reflection hkl.
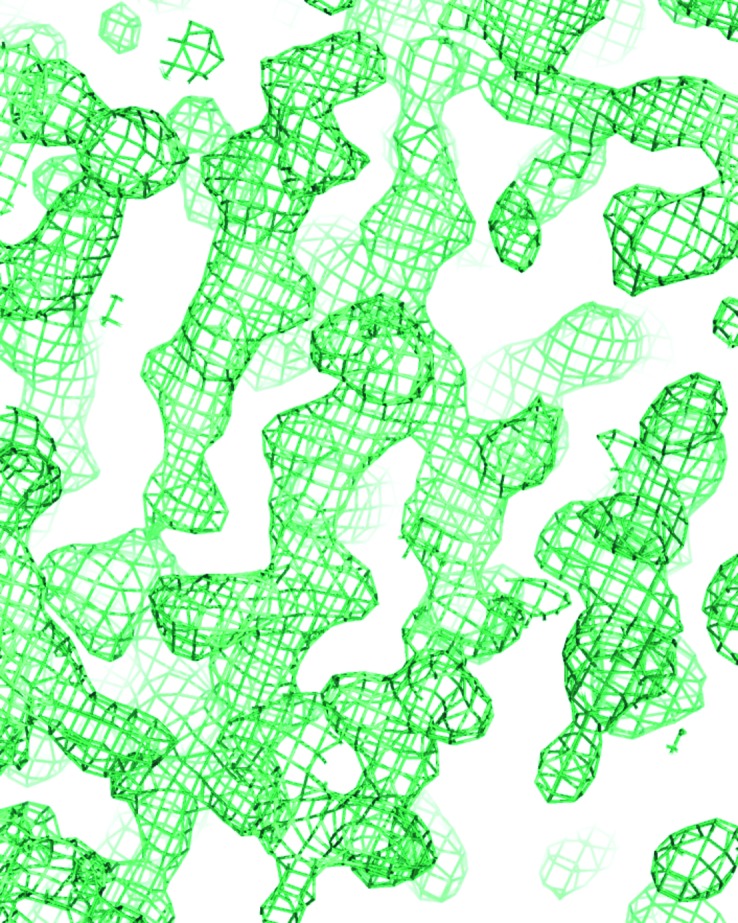
The presence of three sulfur-containing residues in the mature dsc-AggA (one methionine and two cysteines; Table 1 ▶) prompted us to apply an S-SAD method to determine phases. The diffraction data were collected using the highest possible wavelength at the beamline (1.75 Å) to a resolution of 1.9 Å. The phasing power of the first, 94.2% complete data set with a multiplicity of 35 was not sufficient to solve the structure. Hence, a more complete (98.7%) and more accurate (multiplicity of 55, R meas of 6.2%) data set was collected after changing the κ angle by 40° (Table 3 ▶). The anomalous signal of this data set extended to 2.7–3.0 Å resolution (Table 3 ▶). Seven sulfur sites were found and refined using the PHENIX software package (Table 3 ▶). Phase improvement by density modification resulted in experimental electron density that contained recognizable features of a β-structural protein (Fig. 3 ▶). 28% of the asymmetric unit was chain-traced by AutoSol. The SAD phases were applied to the native data set (Table 3 ▶) and extended to 1.55 Å resolution using AutoBuild followed by automatic building of 90% of the structure.
Figure 3.

Experimental electron density computed using S-SAD phases. A fragment of the 2mF o − DF c (σA) (Read, 1986 ▶) electron-density map contoured at 1σ is shown (produced using PyMOL; Schrödinger).
The model demonstrated that two S atoms in the initial sulfur substructure corresponded to the methionine residue, while four substructure atoms corresponded to cysteine residues that appeared to be engaged in the formation of a disulfide bond in each of the two dsc-AggA molecules in the asymmetric unit (Table 3 ▶). The seventh atom in the substructure is located between two S atoms of the disulfide bond in one of the molecules. Why this disulfide yielded three atoms in the substructure is unknown.
The study demonstrates that S-SAD phasing of a protein structure with a sulfur content as low as 0.57%(w/w) is possible and underlines the critical importance of the data quality for this method.
Acknowledgments
The authors would like to thank the staff at beamline BM14, ESRF, Grenoble, France for their assistance in data collection. This work was supported by grants FA-136333 and FA-140959 to AZ and by an Erasmus visiting scientist stipend to NP.
References
- Adams, P. D., Grosse-Kunstleve, R. W., Hung, L.-W., Ioerger, T. R., McCoy, A. J., Moriarty, N. W., Read, R. J., Sacchettini, J. C., Sauter, N. K. & Terwilliger, T. C. (2002). Acta Cryst. D58, 1948–1954. [DOI] [PubMed]
- Boisen, N., Struve, C., Scheutz, F., Krogfelt, K. A. & Nataro, J. P. (2008). Infect. Immun. 76, 3281–3292. [DOI] [PMC free article] [PubMed]
- Chapman, D. A. G., Zavialov, A. V., Chernovskaya, T. V., Karlyshev, A. V., Zav’yalova, G. A., Vasiliev, A. M., Dudich, I. V., Abramov, V. M., Zav’yalov, V. P. & MacIntyre, S. (1999). J. Bacteriol. 181, 2422–2429. [DOI] [PMC free article] [PubMed]
- Kabsch, W. (2010). Acta Cryst. D66, 125–132. [DOI] [PMC free article] [PubMed]
- Nataro, J. P. (2005). Curr. Opin. Gastroenterol. 21, 4–8. [PubMed]
- Rasko, D. A. et al. (2011). N. Engl. J. Med. 365, 709–717. [DOI] [PMC free article] [PubMed]
- Read, R. J. (1986). Acta Cryst. A42, 140–149.
- Roy, S. P., Rahman, M. M., Yu, X. D., Tuittila, M., Knight, S. D. & Zavialov, A. V. (2012). Mol. Microbiol. 86, 1100–1115. [DOI] [PubMed]
- Wu, C.-J., Hsueh, P.-R. & Ko, W.-C. (2011). J. Microbiol. Immunol. Infect. 44, 390–393. [DOI] [PubMed]
- Yu, X. D., Dubnovitsky, A., Pudney, A. F., Macintyre, S., Knight, S. D. & Zavialov, A. V. (2012). Structure, 20, 1861–1871. [DOI] [PubMed]
- Yu, X. D., Fooks, L. J., Moslehi-Mohebi, E., Tischenko, V. M., Askarieh, G., Knight, S. D., Macintyre, S. & Zavialov, A. V. (2012). J. Mol. Biol. 417, 294–308. [DOI] [PubMed]
- Zavialov, A., Berglund, J. & Knight, S. D. (2003). Acta Cryst. D59, 359–362. [DOI] [PubMed]
- Zavialov, A. V., Berglund, J., Pudney, A. F., Fooks, L. J., Ibrahim, T. M., MacIntyre, S. & Knight, S. D. (2003). Cell, 113, 587–596. [DOI] [PubMed]
- Zavialov, A. V., Tischenko, V. M., Fooks, L. J., Brandsdal, B. O., Aqvist, J., Zav’yalov, V. P., Macintyre, S. & Knight, S. D. (2005). Biochem. J. 389, 685–694. [DOI] [PMC free article] [PubMed]
- Zavialov, A., Zav’yalova, G., Korpela, T. & Zav’yalov, V. (2007). FEMS Microbiol. Rev. 31, 478–514. [DOI] [PubMed]
- Zav’yalov, V., Zavialov, A., Zav’yalova, G. & Korpela, T. (2010). FEMS Microbiol. Rev. 34, 317–378. [DOI] [PubMed]


