Abstract
The presence of fixative-induced and cellular-derived artifactual autofluorescences (AAFs) presents a challenge in histological analysis involving immunofluorescence. We have established a simple and highly effective method for the reduction of AAFs that are ubiquitous in fixed mammalian brain and other tissues. A compact AAF-quenching photo-irradiation device was constructed using a commercially available light emitting diode (LED) array, cooling unit, and supporting components. The LED panel is comprised of an array of multispectral high intensity LEDs which serve as the illumination source for the photo-irradiation process. Rabbit and cat brain specimens of 5 μm- and 40 μm-thicknesses, respectively, were photo-irradiated for various durations. The AAFs were reduced to near tissue background levels after 24 h of treatment for both deparaffinized and paraffinized rabbit brain specimens, and for the free-floating cat brain specimens. Subsequent immunofluorescence staining using primary antibodies against GFAP, NeuN, Iba-1, and MAP-2, and the corresponding Qdot® and Alexafluor® fluoroconjugates confirmed that the LED photo-irradiation treatment did not compromise the efficiency of the immunofluorescence labeling. The use of the device is not labor intensive, and only requires minimal tissue processing and experimental set-up time, with very low maintenance and operating costs. Finally, multiple specimens, in both slide and well-plate format, can be simultaneously photo-irradiated, thus, allowing for scalable batch processing.
Keywords: Autofluoresence, Photo-irradiation, Light emitting diodes (LEDs), Immunofluorescence, Fluorophores, Antibody
1. Introduction
Immunofluorescence techniques are invaluable tools in histological analysis. Tissue immunolabeling using fluorophores, coupled with advanced imaging and quantitative measurement systems, allow for the visualization and analysis of biological and pathological conditions of interest. However, most mammalian tissues contain endogenous substances that autofluoresce and may distort, diminish, or conceal the labeling fluorophores by fluorescing at or near the same wavelength. As a result, the presence of artifactual autofluorescences (AAFs) decreases the signal-to-noise ratio of specific labeling, and may confound interpretation in fluorescence-mediated quantification and measurements. The challenge is to reduce the AAFs without compromising tissue integrity and staining quality.
Brain tissue contains a variety of cellular-derived autofluorescent substances that include lipofuscin or lipofuscin-like granules which accumulate intracellularly with the subjects’ advancing age (Barden, 1980; Siakotos and Munkres, 1982). Lipofuscin contains malonaldehyde which reacts with proteins to yield conjugated Schiff bases and fluorescent products (Schnell et al., 1999). These products have a broad fluorescence emission spectrum ranging from 460 nm to 630 nm (Seehafer and Pearce, 2006). O'Connell et al. (1986) described another autofluorescence-associated substance, hemosiderin, which accumulates in macrophages of brain tissue and fluoresces in the 340–500 nm range. Brain tissue also contains a complex network of vasculature comprising collagen and elastin fibers that autofluoresce in the 400 nm and 525 nm range (Billinton and Knight, 2001). Furthermore, there is an abundance of cellular metabolic products that autofluoresce, e.g., the metabolic redox molecules nicotinamide adenine dinucleotide (NAD), reduced NADH, and flavin adenine dinucleotide (FAD) which naturally fluoresce in the 360–460 nm ranges (Andersson et al., 1998; Benson et al., 1979).
Besides cellular-derived autofluorescence, chemical fixation of the tissue by aldehyde-based fixatives such as glutaraldehyde and paraformaldehyde may exacerbate autofluorescence (Beisker et al., 1987). Aldehyde fixatives generate fluorescent products by reacting with various amines and protein components of the tissue milieu (Diez-Fraile et al., 2012). Furthermore, unreacted aldehydes may bind to the tissue and decrease signal-to-noise ratio of the subsequent immunofluorescence labels. Collectively, cellular-derived and fixative-induced autofluorescences constitute the artifactual autofluorescences (AAFs) that occur across the spectrum of many commercially available fluorophores used in immunofluorescence techniques.
Current approaches to eliminate AAFs have had limited success. A brief summary is provided in Table 1. One approach employs the masking of AAFs by Sudan Black, Trypan Blue, Pontamine Sky Blue, or other biological vital dyes (Oliveira et al., 2010; Cowen et al., 1985). Usually, the dye masking steps are performed after the immunofluorescence labeling process. Sudan Black functions to conceal any AAFs present, but may also reduce the labeling intensity of the fluorophores, and is not effective in completely eliminating AAFs (Diez-Fraile et al., 2012; Viegas et al., 2007). Other approaches to eliminate AAFs include chemical treatment with cupric sulfate to reduce the AAFs from hemosiderin-laden macrophages (Potter et al., 2012) or with sodium borohydride (Clancy and Cauller, 1998) to reduce the unreacted aldehydes associated with fixation. However, cupric metal ions have been shown to eliminate or quench some fluorophores such as quantum dots (Zarkowsky et al., 2011). Sodium borohydride may require special handling since it is corrosive and reacts strongly with water to release potentially explosive hydrogen gas. Furthermore, it must be freshly prepared and its effervescent action is not recommended for fragile tissues (Diez-Fraile et al., 2012). It has been shown that AAFs can be separated by using imaging or digital processing tools (Steinkamp and Stewart, 1986; Van de Lest et al., 1995). For example, during confocal image acquisition, the spectra of the labeling fluorophores and AAFs may be segregated into individual spectral channels. This method is effective for the reduction of fixative-induced, but not cellular-derived, AAFs since many of the cellular substances have a broad emission spectrum and fluoresce at the same wavelengths as the fluorophores of interest. The separation techniques become more difficult when using two or more fluorophores.
Table 1.
Survey of autofluorescence reduction methods: advantages and disadvantages.
| Method | AAF reduction | Reproducibility | Labor inputa | Batch processingb | Main drawbacks | References |
|---|---|---|---|---|---|---|
| LED array | Excellent | Excellent | Non-intensive | Yes | Long treatment time for thicker sections | This report |
| UV and fluorescent lights | Good | Good | Non-intensive | Yes | Narrow spectral range may not reduce AAFs in different spectrum | Neumann and Gabel (2002), Schnell et al. (1999) |
| Sudan Black | Moderate | Moderate | Moderately intensive | No | Diminish fluorescence intensity of labels, does not mask AAFs across entire spectrum | Oliveira et al. (2010), Viegas et al. (2007) |
| Cupric sulfate | Moderate | Moderate | Moderately intensive | No | Incompatible with Qdot® fluorophores | Potter et al. (2012), Zarkowsky et al. (2011) |
| Sodium borohydrate | Moderate | Moderate | Moderately intensive | No | Chemical hazard, bubbling action may cause tissue damage | Clancy and Cauller (1998) |
Preparing and processing reagents, specimens, and instrument.
Multiple specimens per treatment.
Another approach is to quench the AAFs by photo-bleaching prior to the immunolabeling. Photo-bleaching is based on the photo-induced chemical destruction of a fluorophore by free radicals generated during its repeated excitation and emission of photons. The fluorophore may undergo irreversible covalent modification and can no longer be excited (Widengren and Rigler, 1996). Variables for photo-bleaching include intensity of the light source, duration of exposure, and concentration of the fluorophores being excited. Current photo-bleaching techniques rely on a complex arrangement of fluorescent lights or incandescent UV bulbs and a cooling mechanism to dissipate the heat from the bulbs. Neumann and Gabel (2002) developed a photo-irradiation light box comprising a 20 W UV bulb and two 18 W fluorescent tubes (bulbs) with emission peaks of 488 nm and a 633 nm, respectively. Slide-mounted specimens were photo-irradiated for 12–48 h. Similarly, Viegas et al. (2007) combined UV irradiation and Sudan Black to quench AAFs in murine liver, kidneys, and pancreas.
Currently, there are no effective commercially available optical quenching devices for reducing AAFs. We have developed a highly effective photo-bleaching or photo-irradiation technique using light-emitting diodes (LEDs) to reduce both fixative-induced and cellular-derived AAFs while preserving tissue integrity and labeling quality. LEDs are semiconductor light sources (Schubert, 2006; Mueller, 2000). They have many advantages over incandescent or fluorescent light sources including lower energy consumption, longer lifetime, higher power output, lower heat output and smaller size. LEDs of different spectrum and intensity can be configured to quench the emissions of the fluorophores of interest. The properties of LEDs make them attractive light sources to effectively reduce AAFs found in unfixed and fixed tissues from a variety of applications such as those involving electrode-neural tissue interfaces (Han et al., 2012). In addition, we have established an immunohistological method for staining specimens subsequent to elimination of AAFs by the LED array device, as previously presented and summarized in Table 2 (Duong et al., 2012).
Table 2.
Primary antibodies and corresponding fluoroconjugated secondary antibodies used for immunolabeling of brain tissues.
| Primary antibodies | AlexaFluor® conjugated secondary antibodies | Qdot® conjugated secondary antibodies |
|---|---|---|
| Rabbit anti-Iba-1 | Goat anti-rabbit IgG-AlexaFluor® 488 | |
| Rat anti-GFAP | Goat anti-rat IgG-AlexaFluor® 633 | Goat anti-rat IgG-Qdot® 585 Goat anti-rat IgG-Qdot® 655 |
| Chicken anti-MAP-2 | Goat anti-chicken IgG-AlexaFluor® 594 | Goat anti-chicken IgG-Qdot® 655 |
| Mouse anti-NeuN-biotinylated | Goat anti-streptavidin-AlexaFluor® 546 | Goat anti-streptavidin-Qdot® 525 |
2. Methods and procedures
2.1. LED array photo-irradiation device
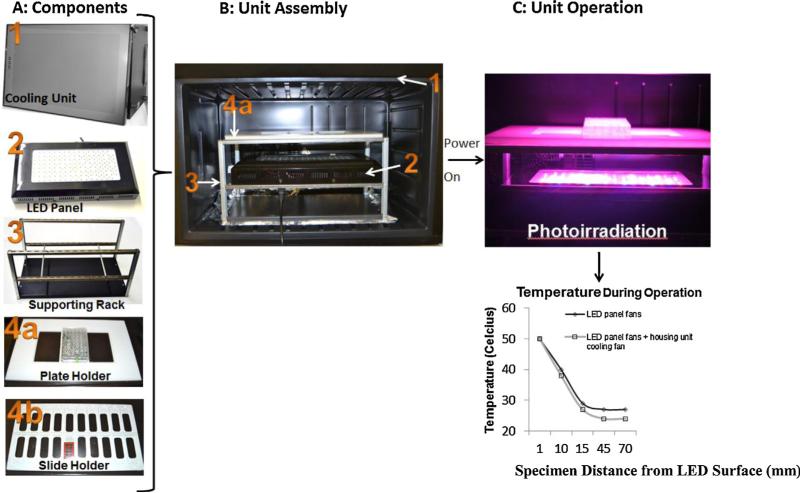
A commercially available 240 W high output LED panel (GrowLight™, HTG Supply Inc., Orange, CT) was incorporated into a cooling unit. The LED panel utilizes 80 3 W LEDs with the following emissions: 390 nm (UV), 430 nm, 460 nm, 630 nm, 660 nm, and 850 nm (infrared). In addition, the array includes several white/blue diodes for broad coverage of the visible light spectrum. Each diode emits light through a 90° half-intensity beam angle lens (as specified by the manufacturer). Together, the array of LEDs can excite a wide spectrum of fluorophores. The LED array photo-irradiation device apparatus (Fig. 1A and B) includes a LED panel (with 3 built-in cooling fans), a supporting rack, slide and plate holders, and an isothermal housing unit modified from a commercially available refrigerator unit (Air and Water Co., Santa Ana, CA). The air temperature as a function of distance from the LED panel was measured by repositioning a general glass mercury thermometer every 30 min to various heights (1–70 mm) above the LED panel surface (Fig. 1C). The effect of the built-in cooling unit on air temperature was tested by operating the LED panel with the housing cooling unit set to its lowest setting (12 °C).
Fig. 1.
Assembly and operation of the LED array device. (A) The components include: (1) a cooling housing unit, (2) an LED array panel, (3) aluminum supporting stand, (4a) plate holder, and (4b) slide holder. (B) LED array device assembly with components inside as numbered in (A). (C) Illustration of LED array device operation and corresponding temperature output measured at tissue-to-air interface with and without cooling. The height of the specimen holder rack can be adjusted to vary the distance from the LED panel surface. Plot showed slightly lower temperature at the tissue-to-air interface with additional cooling from the housing unit.
2.2. Tissue processing and photo-irradiation treatment
Rabbit and cat subjects were perfused and fixed with 4% paraformaldehyde using a standard perfusion protocol described in Han et al. (2012). The rabbit's cerebral cortex was paraffin-embedded (using 3 mm × 3 mm blocks), sectioned into 5 μm-thick slices and mounted on pre-cleaned slides (Fisher Scientific, Irvine, CA). Similarly, the cat cerebral cortex (3 mm × 3 mm blocks) was sectioned into 40 μm-thick slices using a vibratome (Leica, Buffalo Grove, IL) and placed in 24-well plates (ISC Bioexpress, Kaysville, UT). Slices were rehydrated in 1 ml of citrate buffer, pH 6.0 (Lifetechnologies, Carlsbad, CA), and supplemented with thymol (50 μg/ml) and sodium azide (0.05%) to inhibit microbial growth. The slides or plates, containing tissue slices (hereafter referred to as specimens) were positioned above the LED panel surface and photo-irradiated for up to 24 h. Slide-mounted specimens were photo-irradiated in either unprocessed paraffin-embedded or deparaffinized format. The paraffin-embedded specimens were photo-irradiated in a dry form. The deparaffinized specimens were photo-irradiated while immersed in citrate buffer. For specimens in well plates, the 40 μm semi-thick cat brain slices were immersed in 1 ml of citrate buffer during the photo-irradiation treatment. The control specimens were submerged in citrate buffer for similar duration and were not photo-irradiated.
2.3. Immunofluorescence labeling
Following photo-irradiation, the specimens were immunolabeled using 4 different antibodies: (1) GFAP (Life Technologies), (2) Iba-1 (Wako Chemical USA, Richmond, VA), (3) NeuN, and (4) MAP-2 (EMD Milipore, Billerica, MA). Quantum dots (Qdots®) or AlexaFluor® (Life Technologies) fluorophores were used as the fluoroconjugated secondary antibodies (Table 2). Specimens (in citrate buffer) were subjected to mild antigen retrieval by heat treatment for 1 h at 83 °C in a water bath, and were allowed to cool down to room temperature. Subsequently, the specimens were immuno-blocked with 5% normal goat serum in Tris buffer saline (TBS), pH 7.6 for 2 h at room temperature. The specimens were then incubated with primary antibodies pre-diluted in TBS supplement with 2% NGS and 0.3% Triton X-100. The 5 μm (slide-mounted) specimens received 24 h incubation with the primary antibodies, and the 40 μm (in-well plate) specimens received 48 h incubation with the primary antibodies. Primary antibody incubation for all specimens was done at 4 °C with constant agitation. Subsequently, the specimens were washed with TBS 0.3% Triton X-100 every 1 h for a total of 3 washes. Specimens were incubated with AlexaFluor® or Qdots® secondary antibody conjugates for the same duration as the primary antibody labeling step. Finally, specimens were mounted on slides in an aqueous mounting medium (Prolong Gold Antifade, Life Technologies).
2.4. Photo-irradiation on tissue specimens
Unprocessed paraffin-embedded and deparaffinized slide-mounted specimens, as well as semi-thick specimens in well plates, were positioned 7 mm above the LED panel surface and photo-irradiated for 0 h (control) to 24 h. Some specimens were immersed in citrate buffer only and were not subjected to photo-irradiation. These were used as controls for possible quenching by the buffer reagent. At each time point, images were captured at a region of interest within the specimens by using a 5 MP color CCD GigE Basler camera (Edmund Optics Inc. Barrington, NJ) mounted on an Olympus BX60 fluorescence microscope (Olympus America Corp., Center Valley, PA). Qdot® labeled specimens were imaged using a multi-band excitation (495 nm) and emission filter (520–700 nm) on the Olympus microscope. AlexaFluor® labeled specimens were imaged on an LSM 510 laser scanning system (Zeiss, Thornwood, NY) equipped with an Axiovert 200M microscope (Zeiss). The images captured by laser scanning microscopy were acquired using the same conditions and settings, e.g., gains, brightness correction, airy units, scan speed, averaging, laser power and transmission.
2.5. Measurements and quantification
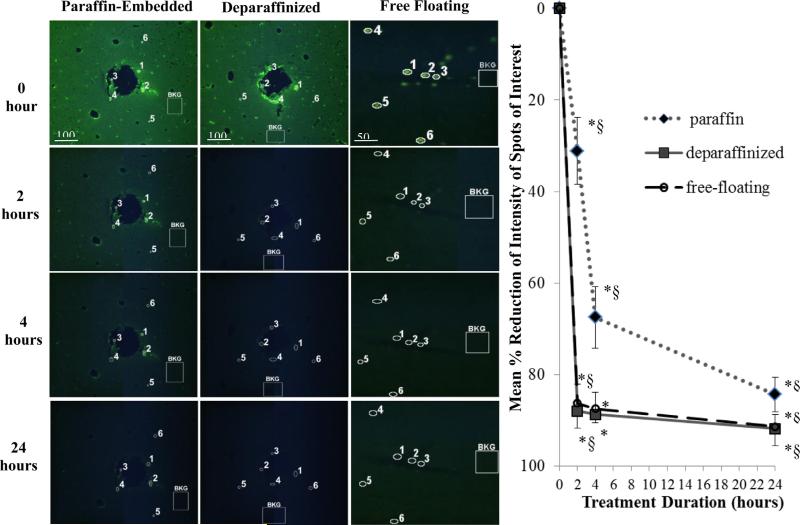
The reduction of fluorescence intensity (Fig. 2) was quantified using the Java-based ImageJ freeware image processing program available from the National Institute of Health (NIH). Briefly, the fluorescence intensity of specific AAF spots of interest (SOIs) and tissue background regions (regions not containing SOIs) for each the treatment duration (t = 2, 4, and 24 h) were calculated using the histogram analysis feature of ImageJ. Percent reduction was calculated as follows:
| (1) |
where I0 and Δ0 represent the initial mean intensity values of the SOIs and tissue background regions, respectively (n = 6 each), and Ix and Δx represent the mean intensity values of the SOIs and tissue background regions, respectively, after x hours (n = 6 each). The percent reduction was plotted as a function of treatment duration for the three tissue formats as shown in Fig. 2. Statistical significance was determined by paired Student's t-test analysis by comparing percent reduction from (1) each treatment durations to t = 0, and (2) between treatment durations.
Fig. 2.
Robustness of LED array-based photo-irradiation with multiple tissue specimens in 5 μm-thick paraffin-embedded (left column) and deparaffinized (middle column) rabbit cortical sections, and 40 μm-thick cat cortical sections (right column). Fluorescence intensity of selected AAF spots of interest (SOIs, n = 6) are circled and numbered. Non-AAF tissue background regions are labeled “BKG.” The BKG region on each image is representative of five other regions selected for measurements (not shown for simplicity). Plot showed the mean percent-reduction of SOIs with respect to BKG at each treatment duration (see Eq. (1)). Error bars represent one standard deviation. *Statistical significance (p < 0.05) comparing treatment time to the initial time point of t = 0 h. §Statistical significance (p < 0.05) comparing between treatment durations. Statistical significance was determined by paired Student's t-test analysis (n = 6).
3. Results
3.1. LED panel heat output (temperature versus distance measurements)
High temperature may alter tissue morphology and antigen–antibody binding sites. Therefore, the heat output from the LED panel is a factor. The temperature 1 mm from the LED panel surface reached 50 °C but decreased with increasing distance from the LED panel surface (Fig. 1, plot). At a distance of 70 mm or greater above the LED panel surface, the mean temperature reached a maximum of 24 °C, which was the chamber's air temperature. Results from our tests of the built-in cooling feature of the housing unit showed that there was a small reduction in the temperature during the LED array operation with the additional cooling feature.
3.2. Photo-irradiation of slide-mounted brain sections
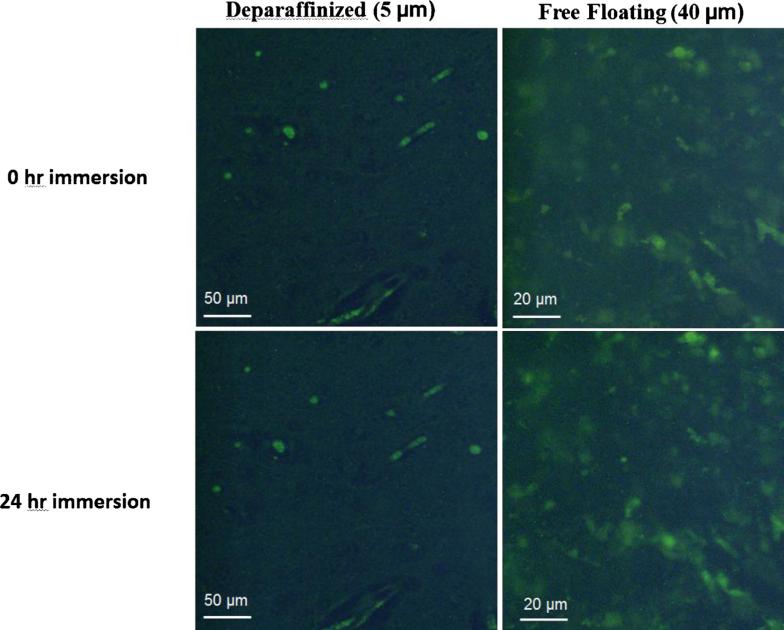
The effect of photo-irradiation on the reduction of AAFs in 5 μm-thick, slide-mounted rabbit brain specimens was investigated. Results showed that there was a statistically significant decline of fluorescence intensity in the specimens following treatment. For deparaffinized specimens, AAFs were reduced by 88% following 2 h of photo-irradiation, and by 91% after 24 h (Fig. 2, plot). For the unprocessed paraffin-embedded specimen, the AAFs reduction process was slower: 31%, 67%, and 84% after 2 h, 4 h, and 24 h of treatment, respectively. Statistical evaluation using paired Student's t-test showed that the differences in the percent reduction of AAFs were significant at all post-treatment durations compared to t = 0 h, with p value of less than 0.05 for both type of specimens. There were significant differences between all treatment durations in the case of paraffin-embedded specimens. For deparaffinized specimens, there was not a significant improvement from 2 h to 4 h, while it was significant in the first 2 h and then from 4 h to 24 h. The deparaffinized specimens in citrate buffer were not subjected to LED photo-irradiation and showed no reduction of AAFs, indicating that the citrate buffer does not contribute to the reduction of AAFs (Fig. 3).
Fig. 3.
Reagent buffer control test. Deparaffinized 5 μm-thick slide-mounted and 40 μm-thick free-floating in well-plate specimens were immersed in citrate buffer for 24 h. No difference in AAF reduction was observed demonstrating that the citrate buffer reagent did not contribute to AAF's reduction.
3.3. Photo-irradiation of free-floating thick sections
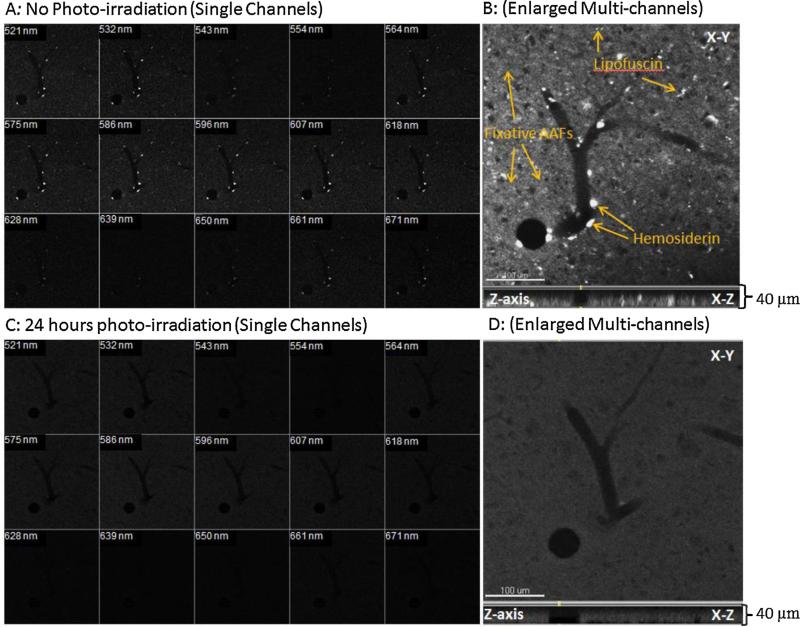
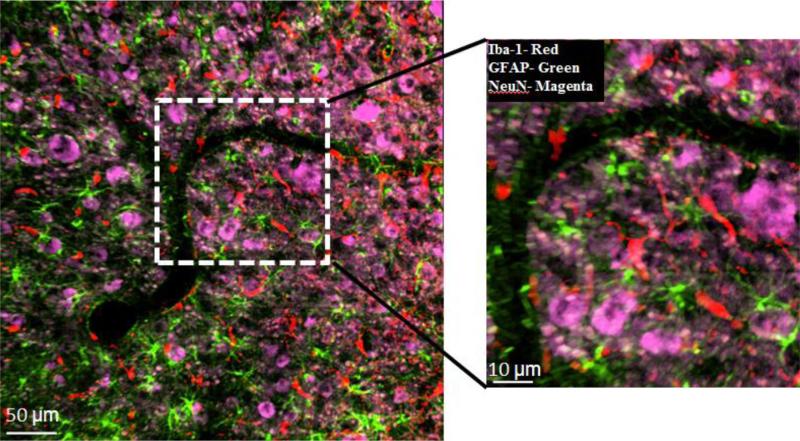
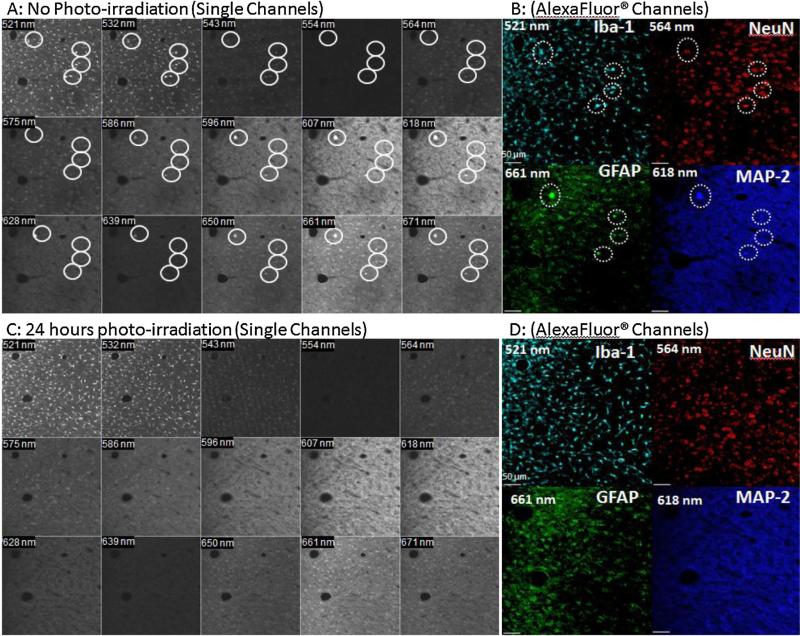
Cat brain tissue specimens 40 μm in thickness were photo-irradiated for 0–24 h. Results showed a sharp decline initially (86% reduction) in AAFs intensity following the first 2 h of treatment (Fig. 2, plot) and then a steady decline to 91% following 24 h of treatment. Statistical evaluation showed significant differences when comparing all durations to t = 0 (untreated) (Fig. 2, plot). There was not a significant improvement from 2 h to 4 h, while there was significant difference in the first 2 h of treatment and also from 4 h to 24 h. The reagent controls showed no reduction after 24 h of immersion in citrate buffer, ensuring that the citrate buffer reagent was not a contributing factor to AAFs reduction (Fig. 3). Laser scanned comparison of a 40 μm-thick specimen before and after photo-irradiation was conducted. Prior to treatment, the AAFs were detected in multiple channels across the spectrum (Fig. 4A). An enlarged image of the area of interest (Fig. 4B) showed numerous AAFs, which may include: hemosiderin (intravascular), lipofuscin (cellular), and unreacted aldehyde components (tissue interstitial spaces). Following 24 h of treatment on the same tissue, there were no AAFs detected in the channels in which they were previously detected (Fig. 4C). The elimination of the AAFs appeared to occur throughout the entire thickness of the 40 μm-thick specimen (Fig. 4D). We further processed the photo-irradiated specimen by immunolabeling for GFAP, NeuN, MAP-2, and Iba-1. Results showed robust signal-to-noise ratio for the glial and neural markers (Fig. 5).
Fig. 4.
Reduction of AAFs in a 40 μm-thick cat brain specimen pre- and post-treatment by the LED array. (A) Laser-scanned image of a pre-treatment specimen showing AAF presence in individual spectral channels, and (B) throughout the entire thickness of the specimen (Z-axis view). (C) The elimination of AAFs across the entire spectrum following treatment on the same specimen, and (D) shows elimination of AAFs throughout Z-axis. The specimen was photo-irradiated for 24 h at a distance of 7 mm from the LED panel surface. A staining integrity of the post-treatment specimen was demonstrated in Fig. 5.
Fig. 5.
Quality of triple-label immunostaining after 24-h-treatment on the same 40 μm-thick cat brain specimen as shown in Fig. 4D, using primary antibodies against Iba-1 (microglia), GFAP (astrocytes), NeuN (neural cell bodies) and corresponding AlexaFluor® fluorophores: Iba-1 (488 nm), GFAP (633 nm), and NeuN (546 nm). Image was obtained on LSM 510 laser scanning system. False colors were applied for each fluorophore. Iba-1, red; GFAP, green; NeuN, magenta. (For interpretation of the references to color in this figure legend, the reader is referred to the web version of this article.)
3.4. Post-treatment immunofluorescence labeling
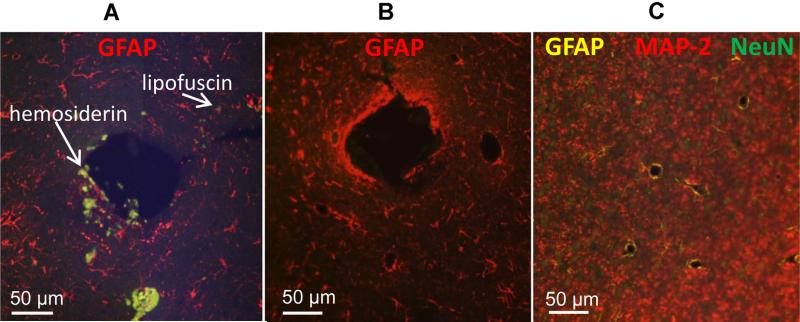
To confirm that the photo-irradiation process did not alter tissue morphology or compromise tissue antigens, the tissue specimens were immuno-labeled with glial markers specific for reactive astrocytes and activated microglia, as well as neural markers for neuronal somas and dendrites (Table 2). Results showed that the immunofluorescence labeling efficiency was not compromised in either the slide-mounted thin specimens (Fig. 6) or the 40 μm-thick free-floating specimens (Fig. 7). Fig. 6 illustrates the similar labeling intensities of the untreated (Fig. 6A) and treated rabbit brain specimens (Fig. 6B and C) for GFAP, MAP-2 and NeuN using Qdot® fluorophores. A major difference was that the non-treated specimens always exhibited AAFs (Fig. 6A). Similar results were observed in two vertically adjacent free-floating 40 μm-thick cat brain specimens (Fig. 7). Laser-scanned images of untreated 40 μm-thick brain specimens showed AAFs (Fig. 7A, circles) in many spectral channels including the same channel as the labeling Alexa® fluorophores for Iba-1 (521 nm), NeuN (564 nm), MAP-2 (618 nm), and GFAP (661 nm) (Fig. 7B). In the photo-irradiated specimen, the AAFs were not detected in any spectral channels (Fig. 7C and D). Clearly, the photo-irradiation treatment had completely eliminated the AAFs in the specimens while retaining similar labeling intensity as the untreated specimens.
Fig. 6.
Immunostaining quality comparison between untreated and treated 5 μm-thick rabbit brain specimens. Specimens were photo-irradiated for 4 h at a distance of 1 mm away from the LED panel surface. The large hole represents an electrode shaft area with AAFs. (A) GFAP staining (Qdot® 655 nm, red) on untreated specimens with AFFs (white arrows). (B) GFAP staining (Qdot® 655 nm, red) on treated section showing no AAFs present. (C) Triple staining for GFAP (Qdot® 585 nm, yellow), NeuN (Qdot® 525 nm, green), and MAP-2 (Qdot® 655 nm, red) following treatment. Note the absence of AAFs in the treated groups (B and C). Samples were imaged on a widefield fluorescence scope (Olympus Inc.) using a multiband excitation (495 nm) and emission filter (520–700 nm) for the Qdot® fluorophores used. (For interpretation of the references to color in this figure legend, the reader is referred to the web version of this article.)
Fig. 7.
Reduction of AAFs in multiple spectral channels in confocal images following 24 h treatment on two vertically adjacent 40 μm-thick cat brain specimens. (A) Image showed AAFs present (circles) in multiple channels prior to treatment, and (B) subsequent quadruple-labeled immunostaining using primary antibodies and AlexaFluor®fluorophores for Iba-1 (cyan), NeuN (red), GFAP (green), and MAP-2 (dark blue). False colors were applied and some AAFs were detected in the same channels as the labeling fluorophores. (C) Image showed elimination of AAFs in spectral channels following 24-h photo-irradiation on a vertically adjacent tissue section to that of (A), and (D) no interfering AAFs were detected in subsequent immunostaining. Images were obtained on an LSM 510 laser scanning system. The specimens were photo-irradiated for 24 h at a distance of 7 mm from the LED panel surface. (For interpretation of the references to color in this figure legend, the reader is referred to the web version of this article.)
4. Discussion
We tested the efficacy of LED array-based photo-irradiation for the reduction of AAFs in brain tissue specimens of two animal species, and found that both cellular-derived and fixative-induced AAFs were reduced to near tissue background levels following photo-irradiation. The amount of time required for effective quenching of the AAFs was dependent primarily on histological preparation. The deparaffinized slide-mounted specimens required as few as 2 h for the AAFs to be reduced to levels near that of the tissue background levels (Fig. 2), whereas a longer treatment time (up to 24 h) was required in unprocessed paraffin-embedded specimens. We speculated that the paraffin layer surrounding the specimen may possess an additional barrier to which LED photons must penetrate, thereby reducing the rate and quantity of photons reaching the tissue surface in order to exert their effect on the AAFs. Nevertheless, we found that the quenching of AAFs was achievable for unprocessed paraffin-embedded specimens. However, additional treatment time beyond 24 h was required. We also found that the LED photo-irradiation treatment could effectively reduce AAFs in thicker (40 μm) free-floating specimens. In as little as 2 h, the intensity of AAFs sharply dropped by 86% and steadily declined to levels near that of tissue background autofluorescence following 24 h of photo-irradiation (Fig. 2, plot). Additionally, we have found that LED photo-irradiation treatment effectively reduced AAFs throughout the entire thickness of the 40 μm-thick tissue specimen (Fig. 4D).
Another factor that affects photo-irradiation time is the intensity of the LEDs’ output, whereas luminescence can be equated to the relative brightness or the actual number of photons emitting from the LEDs (Mueller, 2000). Unlike incandescent or fluorescent light bulbs, which emit light in every direction, LEDs emit light within a narrow beam angle. The beam angle dictates the diffusivity of photons from the LEDs where it is the brightest toward the center and as the angle increases the brightness decreases (Gu and Narendran, 2004). The LED arrays mounted on the panel are of 90° half-intensity beam angle, which was configured for maximizing plant growth in a larger area where the diffused photons could be captured by plant leaves at a greater distance. However, our photo-irradiation method allowed for the exposure of specimens to the brightest point of the beam angle by placing the specimens very close to the LED's center. This will allow the strongest irradiation of the specimen, thereby reducing the time required for quenching the autofluorescence.
The heat output of the LED array was investigated since high temperature may adversely affect tissue integrity and the subsequent labeling process. There are two heat sources contributing to the temperature gradient during photo-irradiation. We believed that the overall rise in air temperature is due to the combination of radiant energy emitted by the LEDs and from electrical warming of LEDs due to their limited efficiency in converting electrical energy into light. Further testing is needed to systematically quantify the contribution of each heating source. Nevertheless, the maximum temperature reached was 50 °C at 1 mm from the LEDs, and we showed that the labeling efficiency remained robust at this distance (Fig. 6). Additional cooling using the housing unit's cooling feature also had little effect at 1 mm distance from the LED panel but did produce a measurable reduction in the ambient temperature at further distances (Fig. 1, plot). It is likely that the temperature is less affected by the decreasing light intensity at distances further away from the panel surface, providing more air circulation at these distances.
To validate staining integrity following the photo-irradiation treatment, we took a two-pronged approach: (1) staining of the same tissue specimen after treatment (Fig. 5), and (2) staining of separate tissue specimens with and without treatments (Figs. 6 and 7). These results from the deparaffinized rabbit brain specimens and the free-floating cat brain specimens confirmed that the staining integrity was preserved on the neural and glial markers and that AAFs reduction was effective.
While our focus has been on thin and brain specimens up to 40 μm in thickness, we also found that the same LED array device could effectively reduce AAFs in tissues up to 80 μm in thickness, but the thicker sections may require longer exposure time. These longer tissue processing times without refrigeration may be a concern because the incubation medium may be susceptible to microbial contamination. This is overcome by adding thymol and sodium azide to the citrate buffer, which helped the preservatives inhibit the proliferation of any microbial growth. We have photo-irradiated specimens for up to 72 h and microscopically observed no microbial contamination or degradation of the specimens.
We have also tested the photo-irradiation treatment technique on other tissue types including kidney and liver. Preliminary results showed some reduction of AAFs in these specimens although longer photo-irradiation time was required (>72 h) to achieve an observable reduction (unpublished). Since liver and kidney tissues contain an abundance of biotin that autofluoresce at 490–500 nm spectrum (Rost, 1995; Wang and Pevsner, 1999), we hypothesized that additional LEDs at the 488 nm may be needed to excite the biotin autofluorescence.
In conclusion, we have designed a LED array device and a method for quenching both cellular-derived and fixative-induced autofluorescences. As summarized in Table 1, advantages of this novel approach include: (1) batch processing of multiple tissue specimens and formats, including thin paraffin-embedded and deparaffinized specimens mounted on slides, as well as semi-thick, free-floating specimens in well-plate format, (2) effective reduction of the AAFs in thin and thick brain specimens from different animal species with provisions for long treatment time outside of refrigeration, (3) preservation of the quality of immunostaining, (4) low-cost and simple operation requiring only a one-time setup and single step processing of specimens as opposed to other current methods, and (5) non-invasive approach in contrary to the harsh conditions of other chemical treatment or high temperature light sources. Finally, the unique feature about our LED array device is that its panel component can easily be replaced with a different spectral range to facilitate quenching AAFs in different tissue types. These LED panels are readily obtainable commercially.
HIGHLIGHTS.
We established a highly effective method to reduce artifactual autofluorescence (AAFs) in fixed mammalian brain tissues.
An array of light emitting diodes (LEDs) was used to photo-irradiate the tissue and quench the autofluorescence.
The photo-irradiation process can reduce AAFs to near tissue background levels.
Photo-irradiation can be performed on brain specimens prepared as either slide-mounted or free-floating in-well plate sections.
The staining quality of neural and glial markers remained robust following the LED photo-irradiation treatment.
Acknowledgements
We thank Al Kowalewski for parts assembly, Jesus Chavez for sectioning paraffinized tissue blocks, Heng Gao Zhong for processing part of the tissues, Douglas McCreery and Victor Pikov for assistance, and Edna Smith, Franchesca Sanchez, and Jo Lemke for animal care. The animal use procedures followed the guidelines of the Institutional Animal Care and Use Committee (IACUC) at Huntington Medical Research Institutes (HMRI), Pasadena, CA, the National Research Council's Guide for the Care and Use of Laboratory Animals, and USAMRMC Animal Care and Use Review Office (ACURO). This work was sponsored by the Defense Advanced Research Projects Agency-MTO under the auspices of Dr. Jack Judy through the Space and Naval Warfare Systems Center Pacific Grant no. N66001-111-4010 (to MH), the National Institutes of Health Grant no. R21EB008582 (to MH), and the Altadena Guild.
Abbreviations
- AAFs
artifactual autofluorescences
- UV
ultraviolet
- LEDs
light emitting diodes
Footnotes
This is an open-access article distributed under the terms of the Creative Commons Attribution-NonCommercial-ShareAlike License, which permits noncommercial use, distribution, and reproduction in any medium, provided the original author and source are credited.
References
- Andersson H, Baechi T, Hoechi M, Richter C. Autofluorescence of living cells. J Microsc. 1998;191:1–7. doi: 10.1046/j.1365-2818.1998.00347.x. [DOI] [PubMed] [Google Scholar]
- Barden H. Interference filter microfluorometry of neuromelanin and lipofuscin in human brain. J Neuropathol Exp Neurol. 1980;37:437–51. doi: 10.1097/00005072-198009000-00008. [DOI] [PubMed] [Google Scholar]
- Beisker W, Dolbeane F, Gray JW. An improved immunocytochemical procedure for high-sensitivity detection of incorporated bromodeoxyuridine. Cytometry. 1987;8:235–9. doi: 10.1002/cyto.990080218. [DOI] [PubMed] [Google Scholar]
- Benson RC, Meyer RA, Zaruba MW, McKhann GM. Cellular autofluorescence: it is due to flavins. J Histochem Cytochem. 1979;27:44–8. doi: 10.1177/27.1.438504. [DOI] [PubMed] [Google Scholar]
- Billinton N, Knight AW. Seeing the wood through the tree: a review of techniques for distinguishing green fluorescence protein from endogenous autofluorescence. Anal Biochem. 2001;291:175–97. doi: 10.1006/abio.2000.5006. [DOI] [PubMed] [Google Scholar]
- Clancy B, Cauller LJ. Reduction of background autofluorescence in brain sections following immersion of sodium borohydride. J Neurosci Methods. 1998;83:97–102. doi: 10.1016/s0165-0270(98)00066-1. [DOI] [PubMed] [Google Scholar]
- Cowen T, Haven AJ, Burnstock G. Pontamine Sky Blue: a counterstain for background autofluorescence in fluorescence and immunofluorescence histochemistry. Histochemistry. 1985;82:205–8. doi: 10.1007/BF00501396. [DOI] [PubMed] [Google Scholar]
- Diez-Fraile A, Van Hecke N, Guerin CJ, D'Herde K. Applications of immunocytochemistry. InTech Publishing; 2012. Optimizing multiple immunostaining of neural tissue. pp. 29–48. [Google Scholar]
- Duong H, Pikov V, Han M. Use of a multispectral LED light array for the reduction of autofluorescence in brain tissue. Society for Neuroscience; New Orleans, LA: 2012. p. 14. (Prog. no. 404) [DOI] [PMC free article] [PubMed] [Google Scholar]
- Gu Y, Narendran N. Design and evaluation of an LED-based fixture. Third International Conference on Solid State Lighting, Proceedings of SPIE 5187. 2004:318–329. [Google Scholar]
- Han M, Manoonkitiwongsa PS, Wang C, McCreery DB. In vivo validation of custom-designed silicon-based microelectrode arrays for long-term neural recording and stimulation. IEEE Trans Biomed Eng. 2012;59(2):346–54. doi: 10.1109/TBME.2011.2172440. [DOI] [PMC free article] [PubMed] [Google Scholar]
- Mueller G. Semiconductors and semimetals. Vol. 64. Academic Press; 2000. Electroluminescence 1. ISBN 0-12-752173-9. [Google Scholar]
- Neumann M, Gabel D. Simple method for reduction of autofluorescence in fluorescence. J Histochem Cytochem. 2002;50(3):437–8. doi: 10.1177/002215540205000315. [DOI] [PubMed] [Google Scholar]
- O'Connell MJ, Baum H, Peters TJ. Haemosiderin-like properties of free radical modified ferritin. Biochem J. 1986;240:297–300. doi: 10.1042/bj2400297. [DOI] [PMC free article] [PubMed] [Google Scholar]
- Oliveira VC, Carrara RCV, Simoes DLC, Saggioro FP, Carlotti CG, Covas DT, et al. Sudan Black B treatment reduces autofluorescence and improves resolution of in situ hybridization specific fluorescent signals of brain sections. Histol Histopathol. 2010;25:1017–24. doi: 10.14670/HH-25.1017. [DOI] [PubMed] [Google Scholar]
- Potter KA, Simon JS, Velagapudi B, Capadona JR. Reduction of autofluorescence at the microelectrode-cortical tissue interface improves antibody detection. J Neurosci Methods. 2012;203(1):96–105. doi: 10.1016/j.jneumeth.2011.09.024. [DOI] [PubMed] [Google Scholar]
- Rost FWD. Fluorescence microscopy. Vol. 2. Cambridge University Press; 1995. (chapter 9) [Google Scholar]
- Schnell SA, Staines WA, Wessendorf MW. Reduction of lipofuscin-like autofluorescence in fluorescently labeled tissue. J Histochem Cytochem. 1999;47(6):716–30. doi: 10.1177/002215549904700601. [DOI] [PubMed] [Google Scholar]
- Schubert EF. Light-emitting diodes. Cambridge University Press; 2006. ISBN 0-521-86538. [Google Scholar]
- Seehafer SS, Pearce DA. You say lipofuscin, we say ceroid: defining autofluorescent storage material. Neurobiol Aging. 2006;27:576–88. doi: 10.1016/j.neurobiolaging.2005.12.006. [DOI] [PubMed] [Google Scholar]
- Siakotos AN, Munkres KD. In: Recent developments in the isolation and properties of autofluorescent lipopigments. Armstrong D, Koppang N, Rider JA, editors. Ceroid lipofuscinosis; 1982. pp. 167–78. [Google Scholar]
- Steinkamp JA, Stewart CC. Dual-laser, differential fluorescence correction method for reducing cellular background autofluorescence. Cytometry. 1986;7:566–74. doi: 10.1002/cyto.990070611. [DOI] [PubMed] [Google Scholar]
- Viegas MS, Martins TC, Seco F, do Carmo A. An improved and cost-effective methodology for the reduction of autofluorescence in direct immunofluorescence studies on formalin fixed paraffin-embedded tissues. Eur J Histochem. 2007;51(1):59–66. [PubMed] [Google Scholar]
- Van de Lest CH, Versteeg EM, Veerkamp JH, Van Kuppevelt TH. Elimination of autofluorescence in immunofluorescence microscopy with digital image processing. J Histochem Cytochem. 1995;43:727–30. doi: 10.1177/43.7.7608528. [DOI] [PubMed] [Google Scholar]
- Wang H, Pevsner J. Detection of endogenous biotin in various tissues: novel functions in the hippocampus and implications for its use in avidin–biotin technology. Cell Tissues Res. 1999;296:511–6. doi: 10.1007/s004410051311. [DOI] [PubMed] [Google Scholar]
- Widengren J, Rigler R. Mechanism of photobleaching investigated by fluorescence correlation spectroscopy. Bioimaging. 1996;4:149–57. [Google Scholar]
- Zarkowsky D, Lamoreaux L, Chattopadhyay P, Koup RA, Perfetto SP, Roederer M. Heavy metals contaminants can eliminate quantum dot fluorescence. Cytometry A. 2011;79(1):84–9. doi: 10.1002/cyto.a.20986. [DOI] [PMC free article] [PubMed] [Google Scholar]


