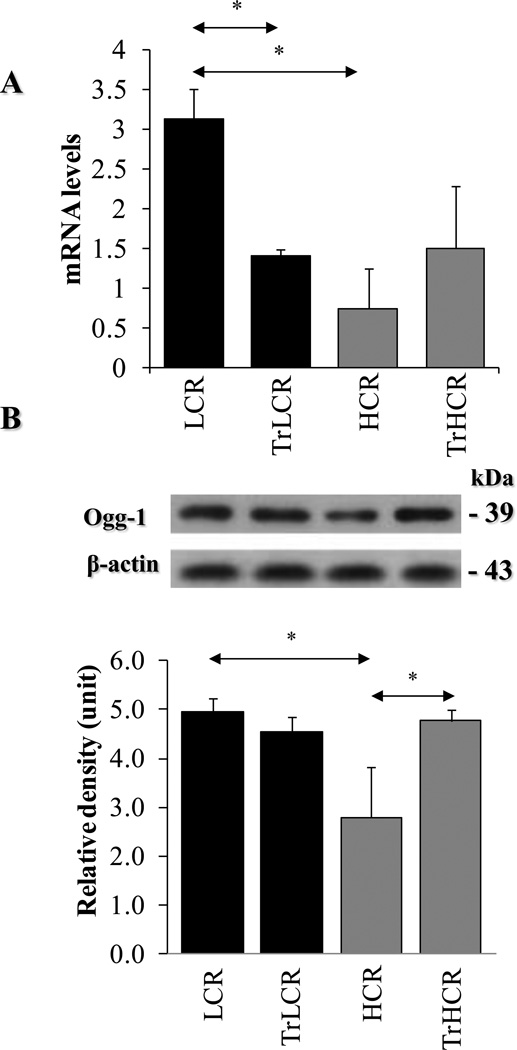
Figure 4. Expression of OGG1 in LCR and HCR animals in response to exercise.
After aerobic endurance treadmill training, the hippocampus was excised and qRT-PRC and Western blot analysis was undertaken as Materials and Methods. (A), Effect of training on Ogg1 mRNA levels in hippocampus of LCR and HCR animals. (B), Ogg1 in hippocampus of LCR and HCR animals. Upper panel, representative autoradiograms from Ogg1 and β-actin immunoblots. Lower panel, graphical depiction of Ogg1 levels as calculated by band intensities (ImageJ software). β-actin was used as an internal control. LCR, HCR, TrLCR and TrHCR as in legend to Fig. 1. Values were means ± SD for six subjects per group. * p<0.05

