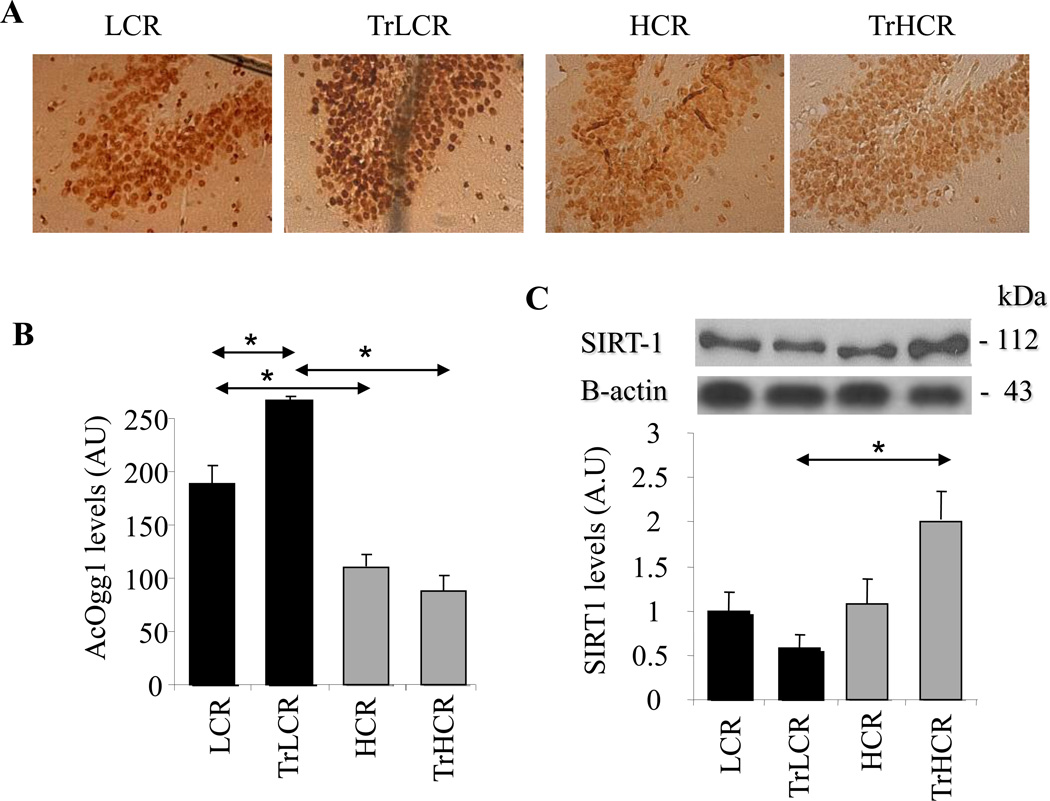
Figure 5. AcOgg1 and SIRT1 level is lower in HCR groups of animals.
LCR and HCR groups of animals were subjected to 12 weeks of training, and AcOgg1 as well as SIRT1 levels were determined by immune staining. (A) Sections of the hippocampus of exercise-trained animals were stained with AcOgg1 antibody and by the streptavidin-biotin immunoenzymatic antigen detection system. (B) Graphical representation of staining intensities is shown as determined by ImageJ software. (C) SIRT1 expression at protein level. Lower panel shows band intensities as determined by ImageJ software. HCR, TrLCR and TrHCR as in legend to Fig. 1. Values were means ± SD for six subjects per group. * p<0.05.

