Abstract
Background
Underweight refers to the weight range in which health risk can increase, since the weight is lower than a healthy weight. Negative attitudes towards obesity and socio-cultural preference for thinness could induce even underweight persons to attempt weight control. This study was conducted to investigate factors related to weight control attempts in underweight Korean adults.
Methods
This was a cross-sectional study on 690 underweight adults aged 25 to 69 years using data from the Korea National Health and Nutrition Examination Survey, 2007-2010. Body image perception, weight control attempts during the past one year, various health behaviors, history of chronic diseases, and socioeconomic status were surveyed.
Results
Underweight women had a higher rate of weight control attempts than underweight men (25.4% vs. 8.1%, P < 0.001). Among underweight men, subjects with the highest physical activity level (odds ratio [OR], 7.75), subjects with physician-diagnosed history of chronic diseases (OR, 7.70), and subjects with non-manual jobs or other jobs (OR, 6.22; 12.39 with reference to manual workers) had a higher likelihood of weight control attempts. Among underweight women, subjects who did not perceive themselves as thin (OR, 4.71), subjects with the highest household income level (OR, 2.61), and unmarried subjects (OR, 2.08) had a higher likelihood of weight control attempts.
Conclusion
This study shows that numbers of underweight Korean adults have tried to control weight, especially women. Seeing that there are gender differences in factors related to weight control attempts in underweight adults, gender should be considered in helping underweight adults to maintain a healthy weight.
Keywords: Underweight, Body Image, Body Weight, Weight Reduction, Social Class
INTRODUCTION
Underweight refers to the weight range in which health risk can increase since the weight is lower than a healthy weight,1) which is the weight range corresponding to lower risk of mortality and morbidity, better physical fitness and better quality of life. Traditionally, underweight is defined as a body mass index (BMI) <18.5 kg/m2,2) the Korea National Health and Nutrition Examination Survey (KNHANES) 20103) showed that almost one in 20 Korean adults aged 19 years and over were underweight (total, 4.8%; men, 2.9%; women, 6.7%). Obesity and underweight are associated with increased risk of mortality.4) Although potential sources of bias including smoking and pre-existing illness might partly affect the relationship between BMI and mortality,5) it is not possible to explain the increased mortality risk in the underweight category only by the effect of potential confounders.6) Underweight has also been reported to be related with increased risk of morbidity including osteoporosis, erectile dysfunction, bronchial and lung diseases, intestinal diseases, coronary artery disease, and mental health impairment.7-9)
However, the health risk of underweight is not as clear as that of obesity in the general population. Overemphasis on the health risks of obesity can bring about weight bias and stigma towards obese persons.10) Negative attitude towards obesity and discrimination against obese persons can induce even those who are not overweight to attempt weight control to keep their body slim and attractive.11) A recent study in Korea reported that 43.1% of adults (men, 22.3%; women, 58.5%) who tried to control weight during the past one year were not overweight.12) Since socio-cultural pressure to be thin is particularly intense for women,13) women tend to consider a thinner body shape as ideal, overestimate their own body weight, and be more concerned with weight control compared to men.14) Although body image distortion, especially in women, could lead even underweight persons, in whom weight control might do harm, to attempt weight control, there is insufficient research on weight control attempts in underweight persons.
This study was conducted to investigate factors related to weight control attempts in underweight adults using a nationally representative sample of Korean adults. We anticipated that there might be gender differences in related factors of weight control attempts in underweight adults since weight-related attitudes and behaviors are divergent depending on gender.
METHODS
1. Study Population
This study was based on data from KNHANES, 2007-2010. The KNHANES is a nationwide representative survey with a complex, stratified, multistage, cluster-sampling design to assess the health and nutritional status of the non-institutionalized civilian population in Korea. The survey has been carried out annually since the rolling sample design was introduced in 2007.3) A total of 33,829 individuals aged ≥1 year participated in KNHANES, 2007-2010. Among them, 20,063 individuals were 25 to 69-years-of-age. Subjects with no anthropometric data (n = 1,236), those who failed to complete all the questionnaires (n = 163) and pregnant women (n = 150) were excluded, leaving 18,514 individuals (8,001 men and 10,513 women). Finally, the data of 690 individuals (198 men and 492 women) who were assessed to be underweight with a BMI < 18.5 kg/m2 were available for the final analysis. The study protocol was approved by institutional review board of the Seoul Paik Hospital (IRB no. IIT-2012-362). Informed consent was waived by the IRB.
2. Measurements
All anthropometric measurements and health interviews were conducted by trained teams in specially equipped mobile examination centers. Data on health behaviors including smoking, drinking and weight control were obtained through self-administered questionnaires and data on socioeconomic status (SES), and history of chronic disease were obtained through face-to-face interviews.
Anthropometric measurements were taken with subjects wearing light clothing and no shoes. Height was measured to the nearest 0.1 cm using a SECA-225 apparatus (SECA Deutschland, Hamburg, Germany). Weight was measured to the nearest 0.1 kg using a GL-6000-20 apparatus (CASKOREA, Seoul, Korea). BMI was calculated by dividing weight (kg) by the square of height (m2) and underweight was defined as a BMI <18.5 kg/m2.
Body image perception was determined by asking subjects to evaluate their own body image on a scale from 'very thin,' through 'somewhat thin,' 'average,' and 'somewhat obese' to 'very obese.' Subjects were asked whether they had ever, on their own initiative, tried to control their body weight during the past one year with choices including: 1) had ever tried to lose body weight, 2) had ever tried to maintain body weight, 3) had ever tried to increase body weight, and 4) had never tried to control body weight. In this study, subjects were defined as having weight control attempts if they had ever, of their own will, tried to either lose or maintain their body weight during the past one year. The primary motive for attempting weight control was surveyed only during the period of 2007 to 2009 and was not assessed in the survey in 2010.
Smoking status was classified into current smokers, ex-smokers and non-smokers. Drinking status was classified into two groups (less than once a month and once or more a month by frequency of alcohol intake). The physical activity level, which was assessed by the Korean version of International Physical Activity Questionnaire (IPAQ) short form, was computed as a continuous score (unit: MET-minutes/wk) and was classified into three categories (low, moderate, and high) according to the guidance of the questionnaire developers.15) Subjects were queried concerning chronic diseases including hypertension, diabetes, dyslipidemia, stroke, ischemic heart disease, arthritis, asthma, renal failure, and liver cirrhosis diagnosed by physicians. Subjects with physician diagnosis history of any kind of chronic disease were considered as having a history of chronic disease. Physician-diagnosed cancers of stomach, liver, colon, breast, cervix, lung, and other organs were also questioned. Subjects with physician diagnosis history of any kind of cancer were considered as having a history of cancer.
Education level, household income, and occupation were surveyed as socioeconomic indicators. Education level was classified as more than college graduate, high school graduate, and less than middle school. Classifying by household income, household equivalent income was calculated by dividing total family income by the square root of the number of family members and was categorized into tertiles (high, middle, and low) for each survey year. Occupation was classified into non-manual workers, manual worker, and the others (soldiers, students, homemakers, and unemployed) by the Korean Standard Classification of Occupations revised in 2007. Marital status was classified into married, unmarried, and others (divorced, separated, and widowed).
3. Statistical Analyses
All the analyses were performed using the SPSS Complex Samples procedure taking into account stratification, cluster, and sample weights with PASW SPSS ver. 18.0 (SPSS Inc., Chicago, IL, USA) in accordance with the guidelines for use of KNHANES raw data. Data were expressed as mean ± standard error or percentage ± standard error. Chi-square test and logistic regression analysis were used to elucidate the factors related to weight control attempts in underweight adults. Since gender differences have been observed in socio-demographic characteristics and weight control behaviors of underweight adults, the analyses were conducted after stratification by gender. As no underweight women with a physician diagnosis of cancer indicated having attempted weight control, a past history of cancer was not included in the logistic regression model in women. It was determined that there was a statistically significant difference when the P-value was < 0.05.
RESULTS
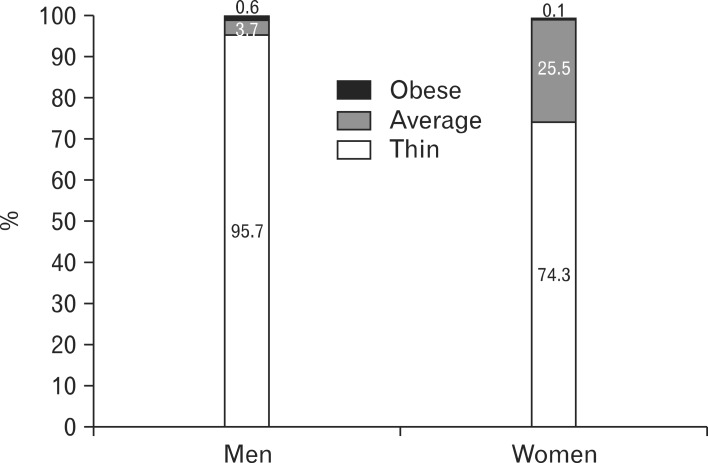
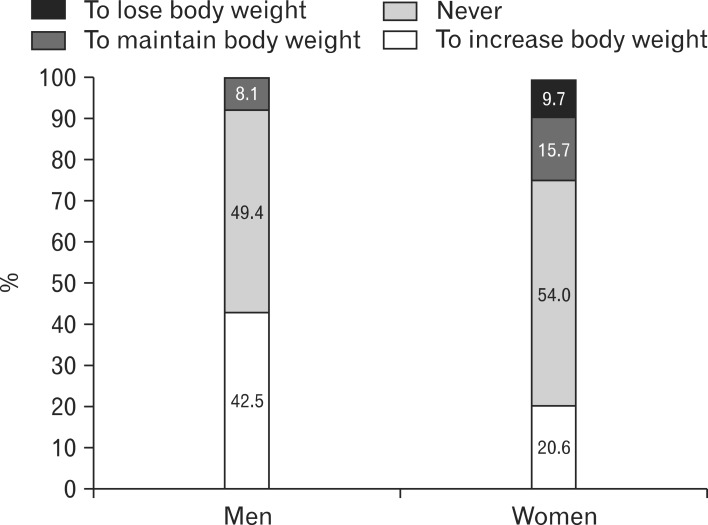
The socio-demographic characteristics of the study subjects, underweight adults aged 25 to 69 years from KNHANES, are presented in Table 1. The mean age of men and women was 42.2 ± 1.0 years and 35.4 ± 0.5 years, respectively; men were significantly older than women. The mean BMI of men (17.57 ± 0.07 kg/m2) was not significantly different from that of women (17.65 ± 0.04 kg/m2). Women had a higher education level, higher household income, and lower proportion of manual workers than men. In contrast, men more often had a history of physician diagnosis of chronic disease than women. Women were much more likely than men to perceive themselves as average or obese even though they were underweight (25.7% vs. 4.3%, P < 0.001) (Figure 1) and to have ever tried to lose or maintain their body weight (25.4% vs. 8.1%, P < 0.001) (Figure 2).
Table 1.
General characteristics of underweight adults
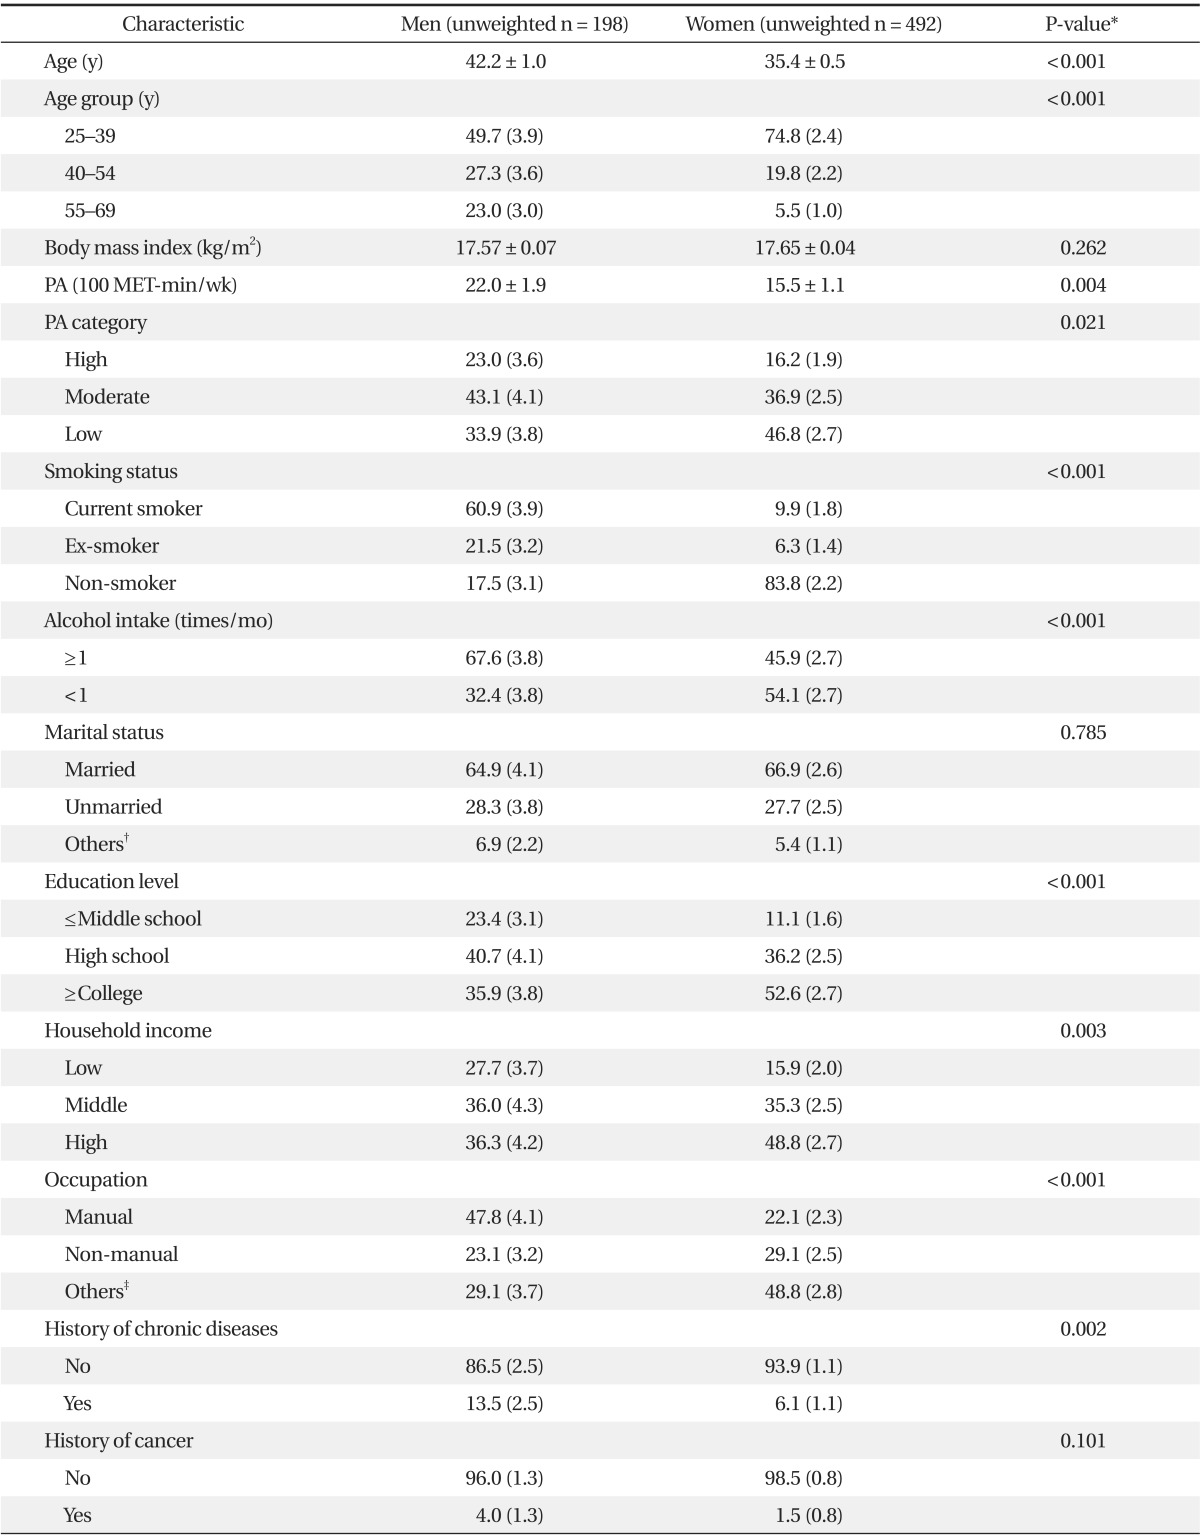
Values are expressed as mean ± SE or % (SE).
PA: physical activity.
*By t-test or chi-square test. †Including divorced, separated and widowed. ‡Including soldiers, students, homemakers and unemployed.
Figure 1.
Body image perception in underweight adults. Body image perceptions and weight control attempts were significantly different between men and women (P < 0.001 by chi-square test).
Figure 2.
Weight control attempts in underweight adults. Weight control attempts were significantly different between men and women (P < 0.001 by chi-square test).
The factors that were independently related to weight control attempts in underweight adults were elucidated through logistic regression analysis after stratification by gender. Among underweight men, subjects with the highest physical activity level (odds ratio [OR], 7.75; 95% confidence interval [CI], 1.44 to 41.76) and subjects with physician diagnosis history of chronic diseases (OR, 7.70; 95% CI, 1.35 to 43.99) had a higher likelihood of weight control attempts than subjects with the lowest physical activity level and subjects without physician diagnosis history, respectively. Additionally, men with non-manual jobs (OR, 6.22; 95% CI, 1.04 to 37.35) or other jobs (OR, 12.39; 95% CI, 2.99 to 51.29) had a higher rate of weight control attempts compared to manual workers (Table 2). In contrast, among underweight women, subjects who did not perceive themselves as thin (OR, 4.71; 95% CI, 2.82 to 7.85) and subjects with the highest household income level (OR, 2.61; 95% CI, 1.11 to 6.13) had a higher likelihood of weight control attempts than subjects who perceived themselves as thin and subjects with the lowest household income level, respectively. In addition, unmarried women (OR, 2.08; 95% CI, 1.11 to 3.88) had a higher rate of weight control attempts compared to married women (Table 3).
Table 2.
Results of logistic regression analyses on weight control attempts in underweight men (unweighted n = 198)
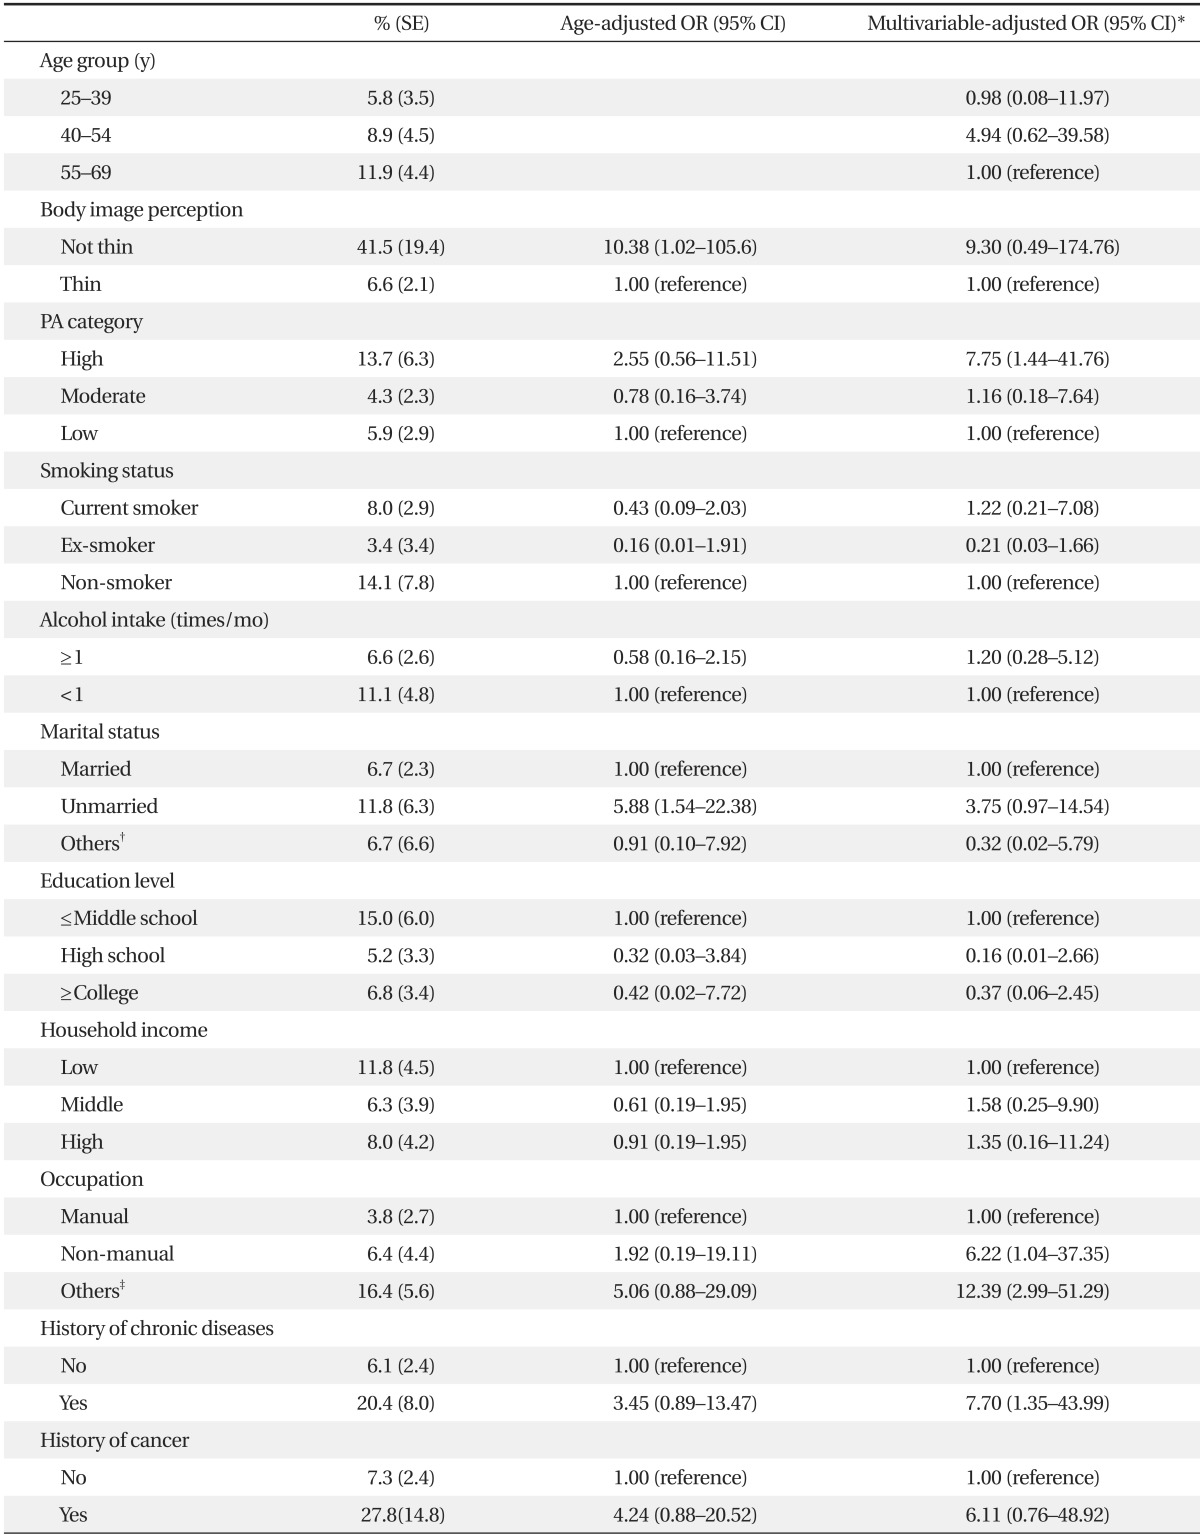
OR: odds ratio, CI: confidence interval, PA: physical activity.
*Adjusted by the other variables in the table. †Including divorced, separated and widowed. ‡Including soldiers, students, homemakers and unemployed.
Table 3.
Results of logistic regression analyses on weight control attempts in underweight women (unweighted n = 492)
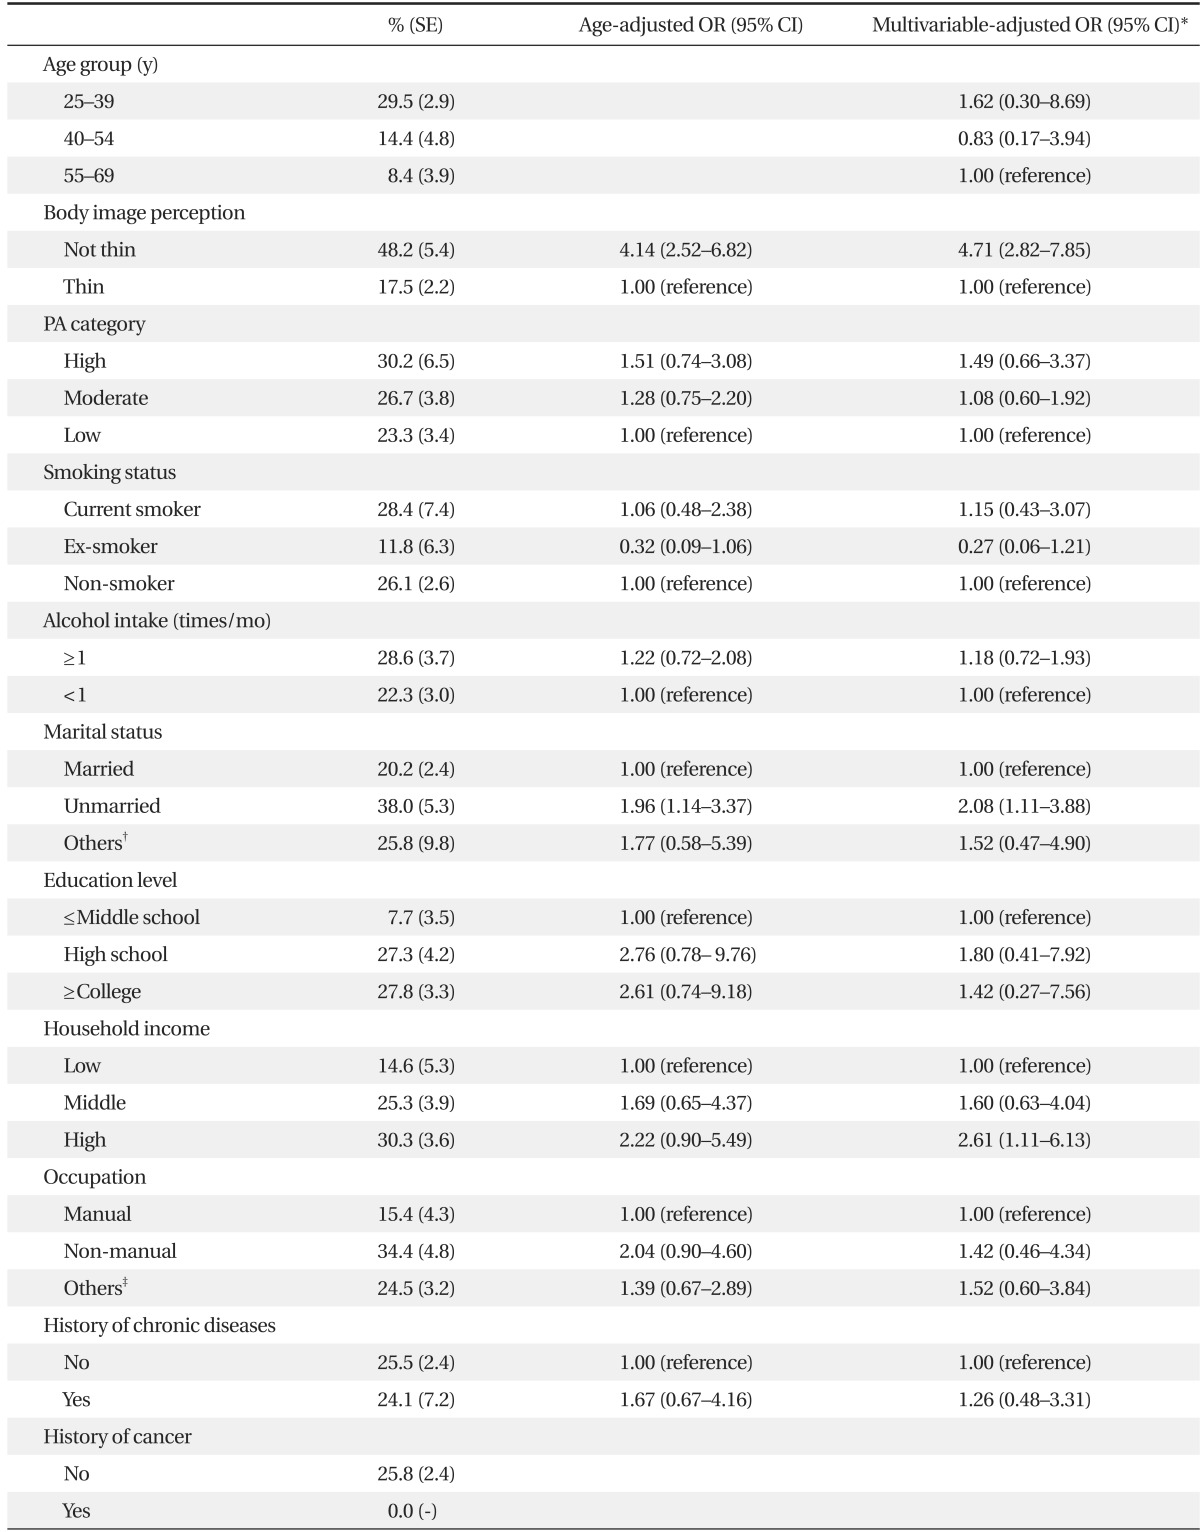
OR: odds ratio, CI: confidence interval, PA: physical activity.
*Adjusted by the other variables in the table. †Including divorced, separated and widowed. ‡Including soldiers, students, homemakers and unemployed.
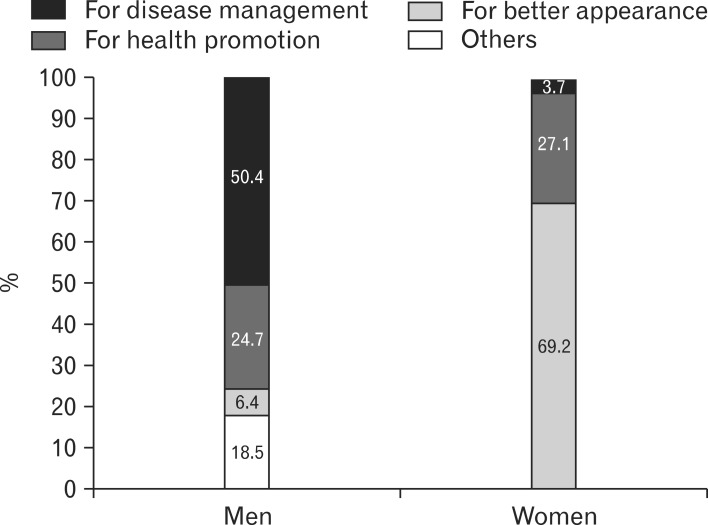
The primary motive for attempting weight control was assessed only for subjects who had tried to either lose or maintain body weight during the past one year. Men answered most frequently that the primary motive for attempting weight control was for disease management (50.4%), but women answered most frequently that the primary motive was for better appearance (69.2%) (Figure 3).
Figure 3.
The primary motive for attempting weight control in underweight adults who had ever tried to control their body weight. Distribution of primary motive for attempting weight control was significantly different between men and women (P < 0.001 by chi-square test).
DISCUSSION
This study aimed to investigate factors related to weight control attempts in underweight adults using data from KNHANES 2007-2010. We supposed that different factors might be involved with weight control attempts between underweight men and women because of gender differences in weight-related attitudes and behaviors. While female subjects with high SES were more likely to attempt weight control, male subjects with a past history of chronic disease were more likely to attempt weight control. These results suggest that related factors of weight control attempts in underweight adults differ depending on gender.
Underweight persons are likely to be heterogeneous, including persons who have lost weight as a result of smoking or underlying diseases, persons who have kept slim by diet or exercise and persons with eating disorders who have a distorted body image.16) It is natural to think that there are differences in body image perception, weight-related concerns, weight control behaviors, and the motives for attempting weight control according to the underlying causes of underweight. Presently, while underweight women were younger and had higher SES than underweight men, underweight men had a higher smoking rate and were more likely to have a past history of chronic disease than underweight women (Table 1). These results suggest that the main underlying cause of underweight might differ depending on gender. Underweight Korean men might include a large proportion of those who had lost weight as a result of smoking or underlying disease, but underweight Korean women might include a large proportion of those who became underweight for other reasons. Thus, the distinguishing characteristics between underweight men and women could partly account for the differences in body image perception, frequency of weight control attempts, motives for attempting weight control, and related factors of weight control attempts depending on gender, which were observed in this study.
Whereas only 4.3% of men evaluated their own body image as average or obese even though they were underweight and only 8.1% of men had ever tried to control their body weight during the past one year, 25.7% of women perceived their body image as average or obese and 25.4% had attempted weight control. This result is consistent with previous studies that reported that women are more dissatisfied with their body weight, are more likely to overestimate their weight and are more frequently trying to lose weight than men.17,18) As women have greater tendency to consider a thin body as ideal, many underweight women do not perceive themselves as thin. The socio-cultural pressure to be thin is particularly intense for women.13) Social and economic disadvantage in obese persons, which is more noticeable in women, may aggravate a woman's distortion of body image.19) The repeated exposure to mass media depicting the thin-ideal women leads some women to internalize the thin ideal stereotype, which produces heightened body dissatisfaction and eating disorder symptoms.20) Presently, women who did not perceive themselves as thin even though they were underweight were approximately 5-times more likely to attempt weight control than other women, and better appearance was selected the most frequently as the primary motive for attempting weight control by underweight women. This result supports the notion that body image distortion and thin-ideal internalization could induce even underweight women, for whom weight control might do harm, to attempt weight control.
Among underweight women, factors related to weight control attempts were household income and marital status with body image perception. SES was closely related with weight-related attitudes and behaviors. Wardle and Griffith21) reported that higher SES in British adults was related to higher levels of self-perception of being overweight, monitoring weight more closely and a higher likelihood of trying to lose weight. It should be noted that body image distortion, body dissatisfaction and frequent attempts of weight control manifested in young underweight women with higher SES could be clinical features of an eating disorder.22) We also observed that unmarried women were approximately twice as likely to attempt weight control than married women. Marital status has an effect on various health behaviors including smoking and alcohol consumption. Vogeltanz-Holm et al.23) reported that being unmarried was a predictor of intense dieting in American female adults. Hay suggested that marriage has a protective effect on potentially problematic eating behaviors.24)
Among underweight men, factors related to weight control attempts were past history of chronic disease, physical activity level, and occupation. Underweight men with chronic disease may have much more interest in weight control because they are more frequently exposed to messages concerning weight control. People with a past history of chronic disease are more likely to come in contact with recommendations through various media sources including medical personnel to control body weight for disease management. Presently, disease management was selected most frequently as the primary motive for attempting weight control by underweight men. However, it is uncertain whether weight control would be helpful in disease management for underweight persons with chronic disease who are lower than the healthy weight and are exposed to additional health risks related to underweight. It should be noted that the general principle of the major guidelines for disease management is not to lower body weight as much as possible but to achieve and maintain a healthy body weight.25) Additionally, subjects with the highest physical activity level had a higher likelihood of weight control attempts than subjects with the lowest physical activity level in this study. This result may be because underweight men frequently try exercise as a weight control method. Hur et al.12) reported that exercise was the weight control method tried most frequently in Korean men and was selected for weight control with higher frequency in Korean men compared to Korean women. In this study, subjects with non-manual jobs or other jobs had a higher rate of weight control attempts compared to the manual workers. This result might be related to the fact that men with various types of chronic disease could shift from manual jobs to non-manual jobs or unemployment.
This study has several limitations to be considered. Although this study was performed using nationally representative data, it was a cross-sectional study that could not address causality or temporality. While height and weight were measured at the time of the survey, weight control attempts were surveyed through recall of the experience during the past one year. So, the study subjects could include those who fell into the underweight category through reducing weight during the past one year. However, we think that this is less likely to bias the results because it is unhealthy to lower one's body weight below a healthy weight as a result of intentional weight reduction. In addition, the study sample was not sufficiently large to perform in-depth analysis because of the low prevalence of underweight individuals, although we analyzed data of KNHANES from 2007 to 2010 together. We could not ascertain the size of bias resulting from exclusion of subjects who failed to complete the anthropometric measures or all the questionnaires. Nonetheless, this study is meaningful in that it was performed using a nationally representative sample that covered a wide age range and both genders, while previous studies on weight control attempts or weight-related attitudes in the underweight included only specific groups such as young women or adolescents as the study population. This is the first study, to the best of our knowledge, to investigate factors related to weight control attempts in underweight adults and the differences between genders.
Negative attitude towards obesity and socio-cultural preference for thinness could lead even underweight persons to control their body weight. This study reports with more clarity the numbers of underweight Korean adults who have tried to control weight, especially women. There are differences in related factors of weight control attempts and the primary motive for attempting weight control between underweight men and women. Among underweight men, past history of chronic disease was a factor highly related to weight control attempts and more than 50% of them controlled their body weight for disease management. It is emphasized in underweight men that goal weight for reducing the risk of disease is not underweight but healthy weight. Among underweight women, higher SES and body image perception were factors highly related to weight control attempts and approximately 70% of them control their body weight for better appearance. Because distorted body image perception and frequent attempts at weight control manifested in underweight women with higher SES could be clinical features of eating disorder, underweight women with these features should be carefully evaluated for eating disorders.
Footnotes
No potential conflict of interest relevant to this article was reported.
References
- 1.Dwyer J. Policy and healthy weight. Am J Clin Nutr. 1996;63(3 Suppl):415S–418S. doi: 10.1093/ajcn/63.3.415. [DOI] [PubMed] [Google Scholar]
- 2.Physical status: the use and interpretation of anthropometry: report of a WHO Expert Committee. World Health Organ Tech Rep Ser. 1995;854:1–452. [PubMed] [Google Scholar]
- 3.Korean Ministry of Health and Welfare; Korea Center for Disease Control and Prevention. Korea health statistics 2010: Korea National Health and Nutrition Examination Survey (KNHANES V-1) Seoul: Korean Ministry of Health and Welfare; 2011. [Google Scholar]
- 4.Flegal KM, Graubard BI, Williamson DF, Gail MH. Cause-specific excess deaths associated with underweight, overweight, and obesity. JAMA. 2007;298:2028–2037. doi: 10.1001/jama.298.17.2028. [DOI] [PubMed] [Google Scholar]
- 5.Gelber RP, Kurth T, Manson JE, Buring JE, Gaziano JM. Body mass index and mortality in men: evaluating the shape of the association. Int J Obes (Lond) 2007;31:1240–1247. doi: 10.1038/sj.ijo.0803564. [DOI] [PubMed] [Google Scholar]
- 6.Flegal KM, Graubard BI, Williamson DF, Gail MH. Impact of smoking and preexisting illness on estimates of the fractions of deaths associated with underweight, overweight, and obesity in the US population. Am J Epidemiol. 2007;166:975–982. doi: 10.1093/aje/kwm152. [DOI] [PubMed] [Google Scholar]
- 7.Lusky A, Barell V, Lubin F, Kaplan G, Layani V, Shohat Z, et al. Relationship between morbidity and extreme values of body mass index in adolescents. Int J Epidemiol. 1996;25:829–834. doi: 10.1093/ije/25.4.829. [DOI] [PubMed] [Google Scholar]
- 8.Suastika K, Dwipayana P, Saraswati MR, Gotera W, Budhiarta AA, Sutanegara ND, et al. Underweight is an important risk factor for coronary heart disease in the population of Ceningan Island, Bali. Diab Vasc Dis Res. 2012;9:75–77. doi: 10.1177/1479164111422828. [DOI] [PubMed] [Google Scholar]
- 9.Mond J, Rodgers B, Hay P, Owen C. Mental health impairment in underweight women: do body dissatisfaction and eating-disordered behavior play a role? BMC Public Health. 2011;11:547. doi: 10.1186/1471-2458-11-547. [DOI] [PMC free article] [PubMed] [Google Scholar]
- 10.Puhl RM, Heuer CA. The stigma of obesity: a review and update. Obesity (Silver Spring) 2009;17:941–964. doi: 10.1038/oby.2008.636. [DOI] [PubMed] [Google Scholar]
- 11.Sugawara A, Sato M, Totsuka K, Saito K, Kodama S, Fukushi A, et al. Factors associated with inappropriate weight loss attempts by early adolescent girls in Japan. Eat Weight Disord. 2011;16:e157–e163. doi: 10.1007/BF03325127. [DOI] [PubMed] [Google Scholar]
- 12.Hur YI, Cho YG, Kang JH, Park HA, Kim KW, Park NR, et al. Weight control methods related to depressive symptoms among adults living in Seoul. Korean J Fam Med. 2011;32:21–28. [Google Scholar]
- 13.McElhone S, Kearney JM, Giachetti I, Zunft HJ, Martinez JA. Body image perception in relation to recent weight changes and strategies for weight loss in a nationally representative sample in the European Union. Public Health Nutr. 1999;2:143–151. doi: 10.1017/s1368980099000191. [DOI] [PubMed] [Google Scholar]
- 14.Kuan PX, Ho HL, Shuhaili MS, Siti AA, Gudum HR. Gender differences in body mass index, body weight perception and weight loss strategies among undergraduates in Universiti Malaysia Sarawak. Malays J Nutr. 2011;17:67–75. [PubMed] [Google Scholar]
- 15.Oh JY, Yang YJ, Kim BS, Kang JH. Validity and reliability of Korean version of International Physical Activity Questionnaire (IPAQ) short form. J Korean Acad Fam Med. 2007;28:532–541. [Google Scholar]
- 16.Willett WC, Dietz WH, Colditz GA. Guidelines for healthy weight. N Engl J Med. 1999;341:427–434. doi: 10.1056/NEJM199908053410607. [DOI] [PubMed] [Google Scholar]
- 17.Kiefer I, Leitner B, Bauer R, Rieder A. Body weight: the male and female perception. Soz Praventivmed. 2000;45:274–278. doi: 10.1007/BF01591690. [DOI] [PubMed] [Google Scholar]
- 18.Wardle J, Haase AM, Steptoe A. Body image and weight control in young adults: international comparisons in university students from 22 countries. Int J Obes (Lond) 2006;30:644–651. doi: 10.1038/sj.ijo.0803050. [DOI] [PubMed] [Google Scholar]
- 19.Sarlio-Lahteenkorva S, Lahelma E. The association of body mass index with social and economic disadvantage in women and men. Int J Epidemiol. 1999;28:445–449. doi: 10.1093/ije/28.3.445. [DOI] [PubMed] [Google Scholar]
- 20.Stice E, Schupak-Neuberg E, Shaw HE, Stein RI. Relation of media exposure to eating disorder symptomatology: an examination of mediating mechanisms. J Abnorm Psychol. 1994;103:836–840. doi: 10.1037//0021-843x.103.4.836. [DOI] [PubMed] [Google Scholar]
- 21.Wardle J, Griffith J. Socioeconomic status and weight control practices in British adults. J Epidemiol Community Health. 2001;55:185–190. doi: 10.1136/jech.55.3.185. [DOI] [PMC free article] [PubMed] [Google Scholar]
- 22.Chen H, Jackson T. Prevalence and sociodemographic correlates of eating disorder endorsements among adolescents and young adults from China. Eur Eat Disord Rev. 2008;16:375–385. doi: 10.1002/erv.837. [DOI] [PubMed] [Google Scholar]
- 23.Vogeltanz-Holm ND, Wonderlich SA, Lewis BA, Wilsnack SC, Harris TR, Wilsnack RW, et al. Longitudinal predictors of binge eating, intense dieting, and weight concerns in a national sample of women. Behav Ther. 2000;31:221–235. [Google Scholar]
- 24.Hay P. The epidemiology of eating disorder behaviors: an Australian community-based survey. Int J Eat Disord. 1998;23:371–382. doi: 10.1002/(sici)1098-108x(199805)23:4<371::aid-eat4>3.0.co;2-f. [DOI] [PubMed] [Google Scholar]
- 25.Krauss RM, Eckel RH, Howard B, Appel LJ, Daniels SR, Deckelbaum RJ, et al. AHA dietary guidelines: revision 2000: a statement for healthcare professionals from the Nutrition Committee of the American Heart Association. Stroke. 2000;31:2751–2766. doi: 10.1161/01.str.31.11.2751. [DOI] [PubMed] [Google Scholar]


