Abstract
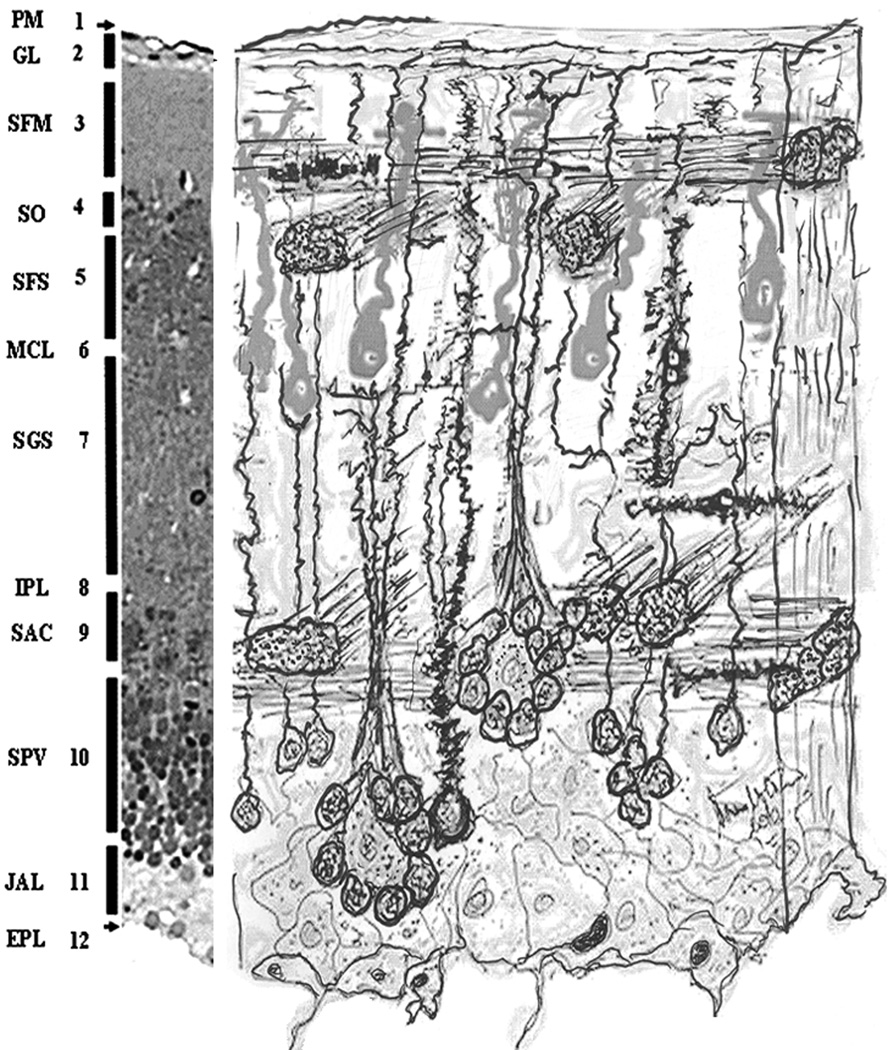
Cellular composition of the adult zebrafish (Danio rerio) optic tectal cortex was examined in this study. Morphological techniques such as 1µm thick serial plastic sections stained with osmium tetroxide and toluidine blue, modified rapid Golgi silver impregnation, GFAP immunohistochemistry, confocal microscopy, as well as scanning and transmission electron microscopy were used. Neuronal and glial components are described and the layers of the cortex are revisited. Specific neuronal arrangements as well as unique glial/ependymal cells are described. A three dimensional rendering of the astrocytic fiber arrangement in the marginal zone is presented and a composite drawing summarizes the cellular composition of the optic tectum.
Keywords: teleost, brain, nervous system, CNS, visual system, microscopy
Introduction
Zebrafish (Danio rerio), a small and sturdy teleost, native to Bangladesh but widely available in pet stores around the world started its career as a laboratory animal for genetic studies (den Hollander and others, 2010). Its use, however, exploded into developmental research (Esain and others, 2010) and gene expression (Vascotto and others, 1997) because of its transparent chorion and easiness to maintain and handle embryos.
During the last decade or so, zebrafish have become a widely used laboratory animal. Recently, it has gained popularity in many other scientific fields like toxicology (Augustine-Rauch and others, 2010; Sukardi and others, 2010), behavioral neuroscience (Guerette and others, 2007) and neuroplasticity (Becker and Becker, 2008). Apart from its biological value, the other main reason why zebrafish are now widely used in many laboratories is the inexpensive cost (Vascotto and others, 1997). As more and more general information becomes available about zebrafish anatomy, physiology, biochemistry, molecular biology and behavior, the more important this fish is becoming as a general laboratory animal.
We have been using zebrafish in our laboratory for several years. One area that interests our laboratory in particular is the visual system. Although, there is a great deal of published data dealing with the structure of the brain of adult boney fish (teleost) in general, the morphological information concerning the adult zebrafish brain is limited. Accordingly, the aim of this study was to collect new morphological data pertaining to the optic tectum of the adult zebrafish brain using different histotechnical procedures both at the light and electron microscopic levels. Since the brain of the zebrafish is closely related to the brain of the goldfish (Carassius auratus), which has been more widely studied in the past and has considerably more published literature (Meek, 1981a; b; 1983; Meek and Schellart, 1978; Romeskie and Sharma, 1979), in this work we are adopting the anatomical nomenclature accepted for goldfish.
Materials and Methods
Animals
Fish, obtained from a pet store (Animal Pantry, Staten Island, NY) were maintained in 20-gallon aquaria with hiding places, adequate filtration, and day lighting at 27 ° C. The distribution of the sexes was not determined (expected to be roughly 50/50 percent). Fish were fed flake food daily. Water chemistry tests were performed on the tanks as needed.
For this study, 60 adult zebrafish of both sexes were used. Animals were randomly selected and distributed to different morphological techniques as follows: 20 for plastic embedding for semithin and ultrathin sectioning; 10 fish for scanning electron microscopy; 6 fish for tubulin immunofluorescence; 12 fish for glial fibriallary acidic protein (GFAP) (6 immufluorescence and 6 for PAP immunohistochemistry); 6 fish for nestin immunohistochemistry; and 14 fish for Golgi silver impregnation. Adulthood was determined by the size of fish as 2.5 to 3.8 cm in length. Sexual maturity was not specifically detected; however, similar size fish are frequently used to obtain eggs for embryonic projects in our lab suggesting that the fish in this study were also sexually mature. All used procedures are listed in and approved by the IACUC Protocol (#359, issued by the New York State for Basic Research).
Prior to sacrifice, fish were anesthetized using 0.04% tricaine (3-amino benzoic acidethylester, Sigma-Aldrich) according to the methods described by Westerfield (Westerfield, 2007).
Fixation of the brain
Brains, exposed by removing parietal bones of the skull, were fixed in situ by immersion of the head into the appropriate fixative solution at room temperature for 2 days, then removed from the base of the skull and completely immersed in the same fixative solution for additional two days. Choice of the fixative solution depended on the morphological procedure to be used (Chandler and Roberson, 2009; Gard, 1991; Kalman and others, 1985; Lam and others, 2009; Rosoklija and others, 2003).
Tissue Preparations
Unembedded brains were sectioned on a vibrotome (80 µm) (OTS-4000, Electron Microscopy Sciences) or pressed into “squashed preparations” (see later). Brains embedded into resin (Durcupan, Fluka) were cut on an ultra microtome (Sorvall MT2-B) either as 1 µm semithin section series for light microscopy or 100 nm ultrathin sections for transmission electron microscopy.
Semithin sections were stained with 1% toluidine blue containing sodium borate; ultrathin sections were contrasted with uranyl acetate and lead citrate (Kalman and others, 1985).
For scanning electron microscopy (SEM) brains were fixed and dehydrated according the literature (Chandler and Roberson, 2009) and cut or broken under the stereomicroscope, then coated with gold in a Hummer sputter-coater for about 5–7 minutes at 15 mA.
Making of Squashed Preparations
Individual pieces of the tectum were collected prior to fixation and firmly pressed down onto a slide creating a cellular monolayer out of the sample. After being pressed between a piece of parafilm and two slides, the sample was fixed with dry ice to free the parafilm and then further fixed in a 4% paraformaldehyde and 2% glutaraldehyde solution, dehydrated and stained with toluidine blue prior to cover slipping.
Special Staining
Rapid Golgi Impregnations
Rapid Golgi impregnations were performed according to modifications from techniques published earlier. (Fulop and others, 1979; Meek and Schellart, 1978; Romeskie and Sharma, 1979; Rosoklija and others, 2003).
Immunocytochemistry & Immunofluorescence
For PAP immunohistochemistry, the procedure was adopted from Lam and others (Lam and others, 2009). Briefly, slices were treated with formic acid and hydrogen peroxide to expose antigen sites, blocked with 4% normal goat serum and treated with the primary antibody overnight, followed by a PB wash and treated with the secondary antibody goat-anti-mouse conjugated to horseradish peroxidase (HRP). Following washing, the slices were developed with diaminobenzoate (DAB), dehydrated, mounted on slides and cover-slipped.
Immunofluorescence procedure was adopted from Gard (Gard, 1991). Briefly, sections were dehydrated through xylene and rehydrated to phosphate buffer to help reduce autofluroescence. Brain slices were permeabilized in Triton X-100, quenched with 1mg/ml sodium tetraborate on ice, and blocked in 4% normal donkey serum. Sections were incubated in primary antibody overnight, washed in PB and incubated in secondary antibody for one hour, then mounted in Vector-shield antifade with DAPI (Vector Laboratories).
Microscopic Image Acquisition and Post-processing
All bright-field light microscopic images were captured with an Olympus BX-40 light microscope with a Sony ExWave HAD analog camera using FlashBus image capture card. Confocal imaging was done on either a Leica SP2 TCS or a Nikon C1. Transmission electron microscopic imaging was done on a Philips CM100 TEM and micrographs were captured using Motic digital camera (Moticam 2500). All SEM electron micrographs were taken using a Topcon ABT-32 SEM equipped with a GW Printerface digital imaging system. Post processing of confocal images including image deconvolution and three dimensional rendering were done using Auto Deblur (Autoquant). Montages were assembled using Adobe Photoshop.
Results
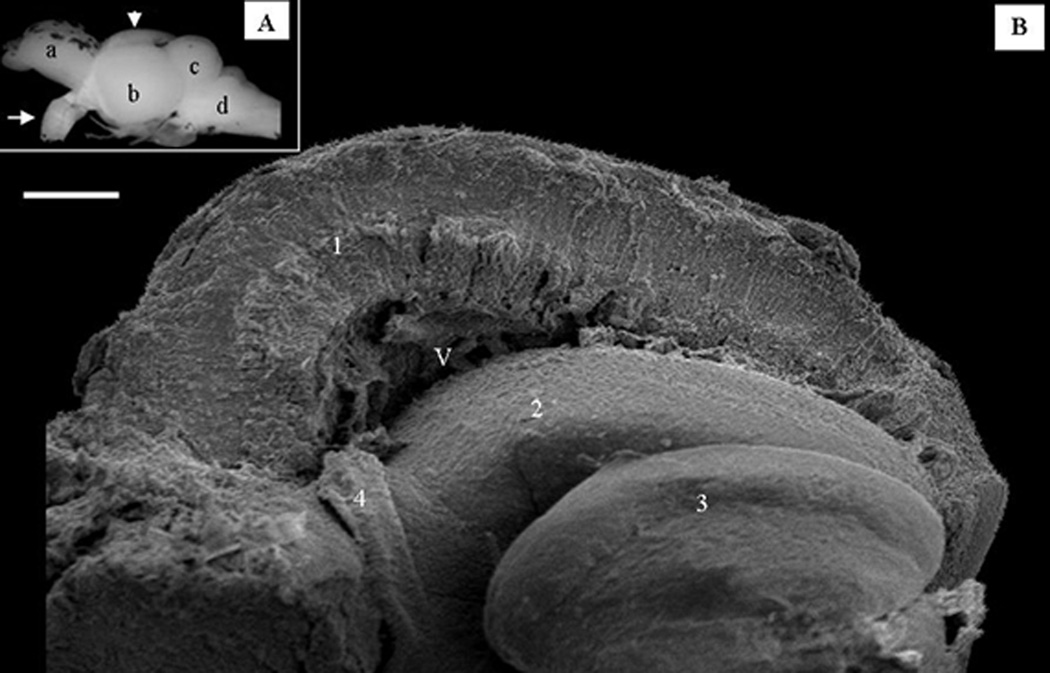
This work focuses primarily on the morphological characteristics of the optic tectum. Figure 1 gives a general orientation of the overall arrangement of the adult zebrafish brain in a stereo microscopic image and also depicts the optic tectum as it is seen under the scanning electron microscope after fracturing it in a midsagittal plane. As it is shown on Fig.1A, the mature zebrafish brain has all the main components of a typical teleost brain namely, the forebrain (a); the optic tectum (b); cerebellum (c); and brainstem (d). The massive optic nerve (arrow) is easily recognizable as a thick bundle ventral to the optic tectum. The broken optic tectum (Fig. 1B) under the scanning electron microscope appears as a layered cortical structure with radially arranged cellular components (1). In this fractured preparation the valvula cerebelli (2) and the torus semicircularis (3), structures closely associated with the optic tectum are also exposed. A piece of the tectal choroid plexus (4) is seen in the most anterior recess of the tectal ventricle (V).
Figure 1.
General overview of the adult zebrafish (Danio rerio) brain. A. Stereomicroscopic image. a: left hemisphere of the forebrain with the olfactory bulb, b: left hemisphere of the optic tectum, arrow-head: points to the dorsal surface of the right optic tectum covered with the left hemisphere, c cerebellum, d: medulla, arrow: optic nerve. B. Scanning electron micrograph of the broken half of the right optic tectal hemisphere (labeled with an arrow-head in panel A).
1 cortex of the optic tectum, 2: valvula cerebelli, 3: torus semicircularis, 4: choroid plexus, V: tectal ventricle. Micron bars: in A=2 mm and in B=1 mm.
Stratification of the Optic Tectum
Using serial semi-thin (1µm plastic)- sections of the adult zebrafish brain cut in all of the three anatomical planes (horizontal, sagittal, and cross sectional), we prepared in advance a digital zebrafish brain atlas (not yet published). Analysis of these sections allowed us to select the best orientations and the most optimal levels of the optic tectum to study some details of its cortical structure. We found that the most informative series are the horizontal orientation and accordingly, most of the analysis presented in this paper is based on the horizontal orientation.
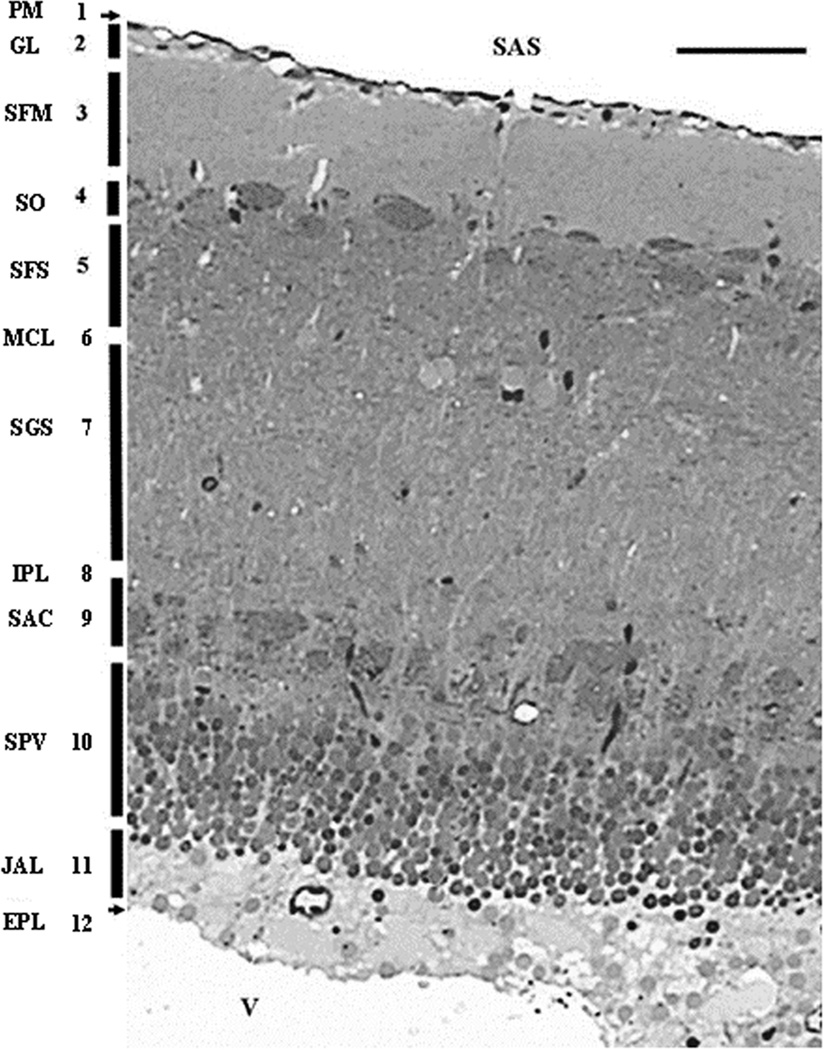
Figure 2 depicts the adult optic tectal layers as it is seen in a toluidine blue stained semi-thin section in the horizontal plane. The figure is a montage of more than a dozen frames captured with a 100× oil immersion objective. The zebrafish optic tectum is comprised of 12 distinct layers as follows. (1) Pia Mater (PM); (2) Glia Limitans (GL); (3) Stratum Fibrosum Marginale (SFM); (4) Stratum Opticum (SO); (5) Stratum Fibrosum Superficiale (SFS); (6) Stratum Magnocellulare (SMCL); (7) Stratum Griseum (SGS); (8) Internal Plexiform Layer (IPL); (9) Stratum Album Centrale (SAC); (10) Stratum Periventriculare (SPV); (11) Stratum Aqueous Marginale (SAM); (12) Ependymal Layer (EL).
Figure 2.
- (PM) - Pia mater
- (GL) - Glial Limitans
- (SFM) - Stratum Fibrosum Marginale
- (SO) - Stratum Opticum
- (SFS) - Stratum Fibrosum Superficiale
- (MCL) - Stratum Magnocellulare
- (SGS) - Stratum Fibrosum Griseum
- (IPL) - Internal Plexiform Layer
- (SAC) - Stratum Album Centrale
- (SPV) - Stratum Periventriculare
- (JAL) - Stratum Juxtaventriculare Aquos
- (EPL) – Ependyma
(SAS) - Subarachnoidal space 165×106 mm
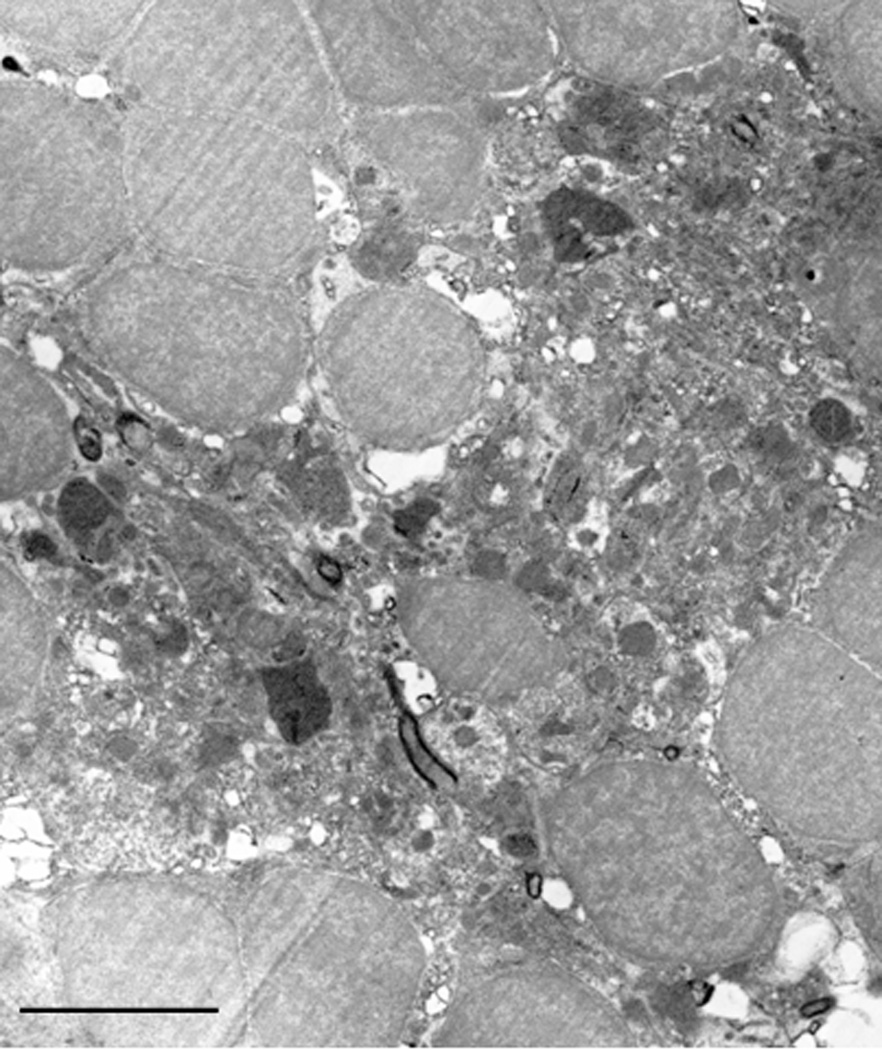
It is important to note that the periventricular layer (SPV) is actually separated from the ependyma by a distinct layer (11), Stratum Aqueous Marginale (SAM), which is composed of watery-appearing, translucent cells, as it can be seen in transmission electron microscope (Figure 3). These cells appear to be closely related to the ependymal layer (12) and seemingly separate (or connect) the SPV cells from (or with) the cerebrospinal fluid (CSF) in the neighboring ventricle.
Figure 3.
Transmission electron micrograph of cells found in the vicinity of the ependyma of the tectal ventricle (juxtaventricular aqueous layer). These cells are characterized by their watery cytoplasm, sparse organelles, and the presence of some granules. The nuclei of these cells have homogenous euchromatin and a well defined, small nucleolus. Frequently seen among the cells of this layer are electron dense protruding processes from other cells (as seen in the center of the figure). Micron bar = 10 µm.
Neuronal Composition
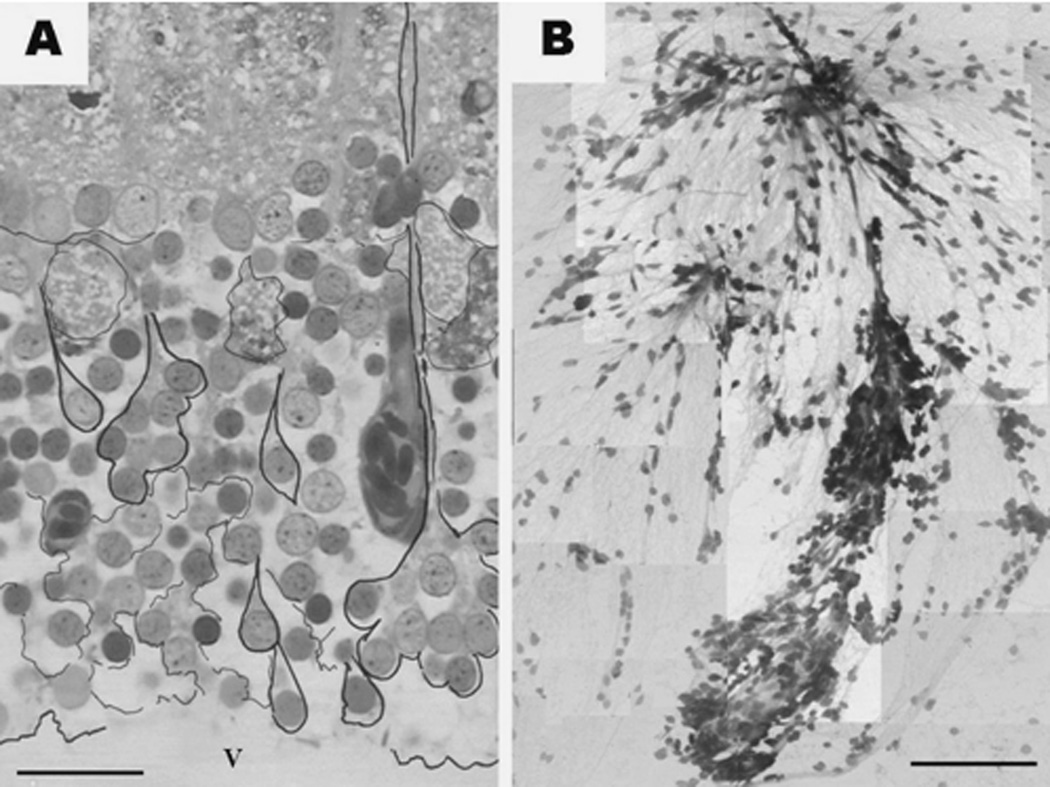
The most prominent neurons in the cortex of the optic tectum are the unipolar type of neurons whose perikarya comprise the periventricular gray zone (SPV). The dendrites and axons of these neurons are contributing to the neurpil of the above layers. A closer look at this layer reveals that the perikarya of certain neurons are often grouped like a “rosette” in such a way that their radially oriented dendrites are bundled together forming a structure resembling a “bunch of scallions” (Fig.4A arrows). Figure 4B shows a photomontage of a similar bunch of periventricular projecting neurons as they appear in squashed preparations of the SPV. Squashed preparations allowed us to visualize that these groups are composed of varying numbers of neurons whose dendrites converge into a common bundle. Most of the periventricular projecting neurons however remain single. These single cells may or may not connect to the common bundle.
Figure 4.
Periventricular projecting neurons in a toluidine blue stained semithin section (A) and in a toluidine blue stained squashed preparation (B). In panel (A), black contours are labeling different periventricular projections neurons either as single cells or as cells grouped (bunched) into what we call rosettes. Also note the large, fluid-filled appearing spaces between the periventricular cells. V - tectal ventricle. (B). The dendrites of several neuronal bunches, of varying size, are joining in the upper part of the picture. Both images are montages of several independent photographs captured with the 100× oil objective. Micron bar: A = 150 µm; B = 30 µm
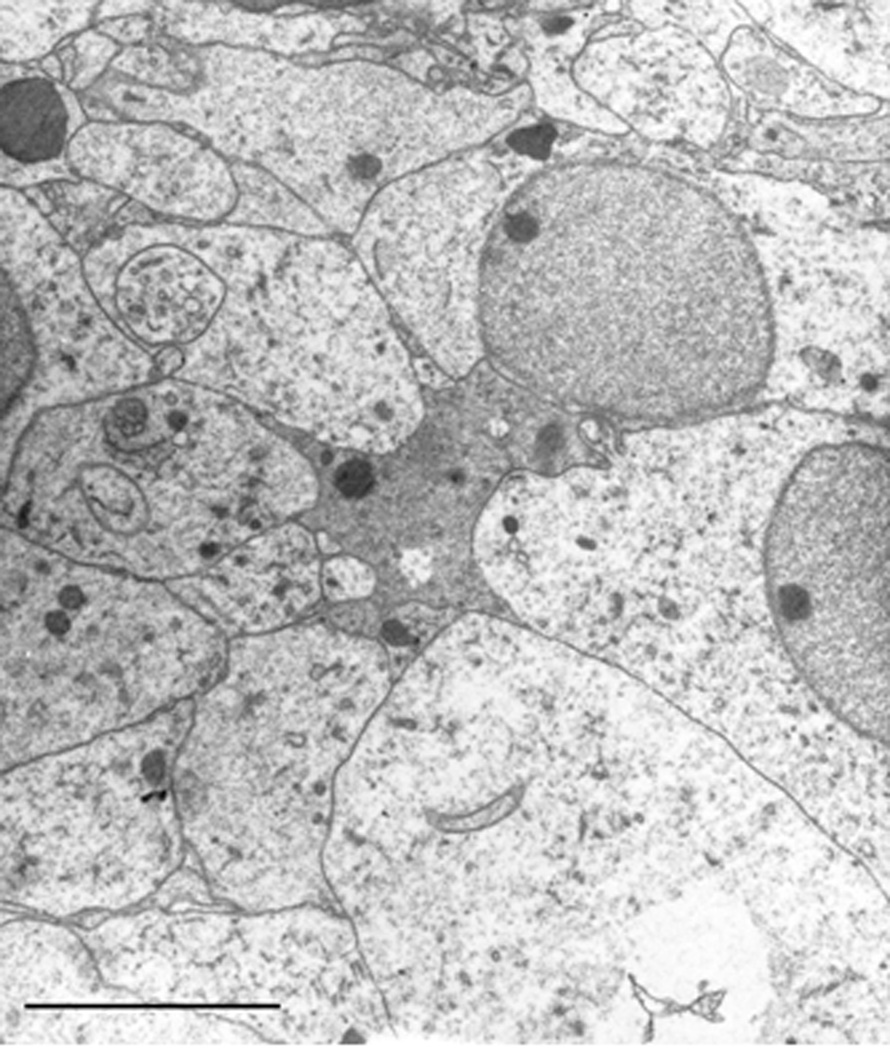
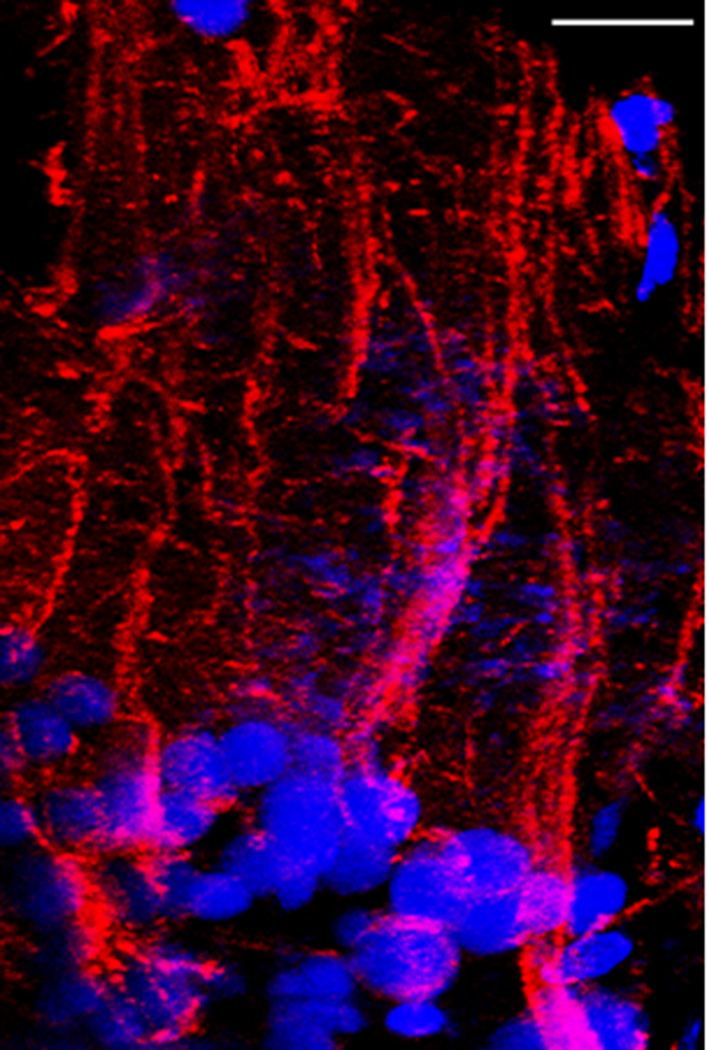
In order to further illustrate this unique neuronal configuration we utilized immunofluorescent labeling of the dendritic tubulin (red) and DAPI-labeling of the nuclei (blue) and co-visualized it using confocal microscopy. Our finding reinforced this arrangement (Fig. 5). A low level electron microscopic view of such a bunch of neurons showed the expected rosette-like arrangement. It also revealed that, central to the spherically arranged neuronal cell bodies, there is always a large, aster-shaped cell present. This type of cell contains numerous mitochondria as well as other organelles, vesicles and various shape and size electron dense inclusions (Fig. 6). We named these cells as inner-hub-cells.
Figure 5.
Confocal image of neuronal groups (blue) in the periventricular zone of the adult zebrafish optic tectum whose dendrites (red) are bundled together like a bunch of scallions. The blue color is DAPI-stained nuclei; the red color is anti-DM1A against the alpha subunit of tubulin. Micron bar = 30 µm.
Figure 6.
Electron micrograph of the rosette-like arrangement of the periventricular projecting neurons. The electron-dense cell located in the center of the picture is surrounded by the periventricular neurons forming a basket. Note the even distribution of the hetero and euchromatin in all cell type nuclei and the very small ring-like cytoplasm of the neurons. The cytoplasm of the centrally located cell is full of organelles such as vesicles which could be lysozomes or perioxisomes as well as mitochondria. Micron bar = 10 µm
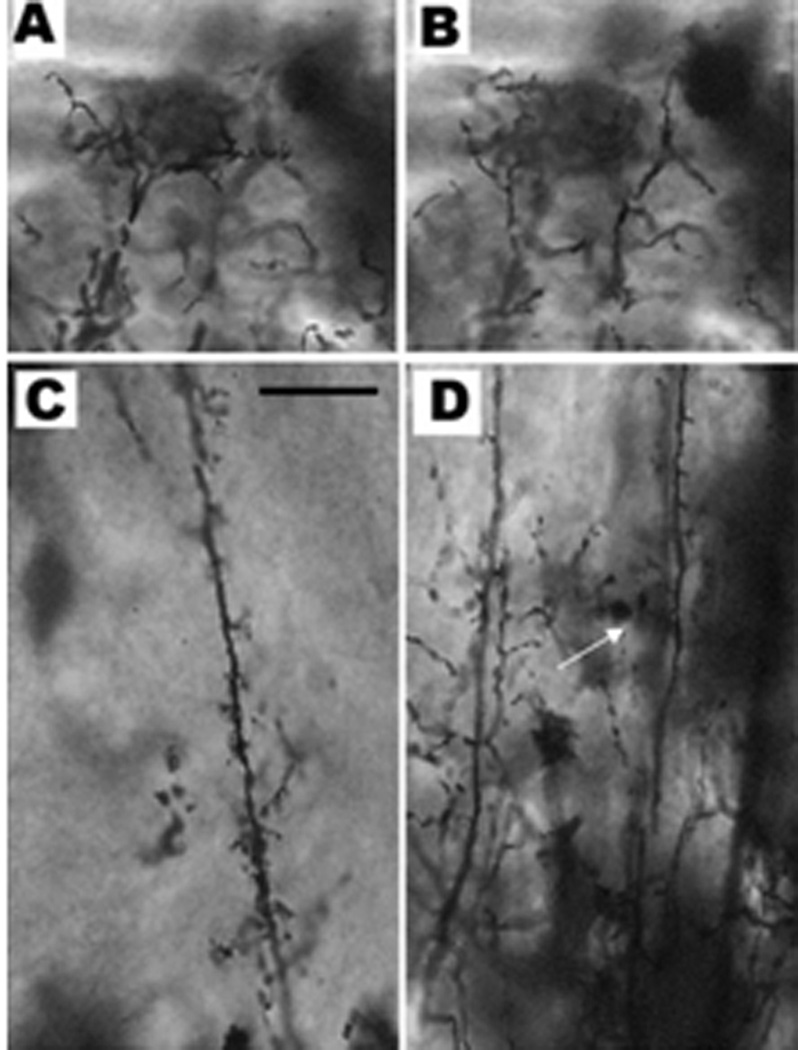
Silver impregnation with the rapid Golgi technique revealed the different specificities of the dendritic shafts of the periventricular projecting neurons. These dendrites are all radially oriented and most of them are reaching up to the superficial fibrosum marginale. Figure 7 shows different samples of the dendritic arborization. A and C depict cell types called monostratified periventricular interneurons (msPVIN) (Nevin and others, 2010). B and D depict bi-stratified periventricular projection neurons (bsPVIN) (Nevin and others, 2010) referring to the number of layers in which their dendrites branch. The long shaft of the msPVIN passing through several layers is richly studded with short dendritic spines, but do not arborize. Dendritic shafts of the bsPVIN have either many short dendritic branches or a lateral arborization somewhere in the SGS. However, comparison of the two images A and B reveals no significant differences in the terminal arborization of the two neuronal types.
Figure 7.
Periventricular neurons stained with rapid Golgi. A & B depict dendritic arborization in the stratum fibrosum marginale of all types of neurons. C & D are different mid-regions of periventricular neuronal dendrites as seen in the stratum fibrosum & gresium superficale. C corresponds to the monostratified periventricular interneuron (the dendrites divide only at the marginal layer). D depicts two types of periventricular neurons: in the left of the picture is a typical periventricular projection neuron with numerous short side dendritic branches seen in many or all of the cortical layers. In the right of the picture is the bi-stratified projetion neuron which branches not only in the marginal region but also in the stratum fibrosum (white arrow). Micron bar = 20 µm
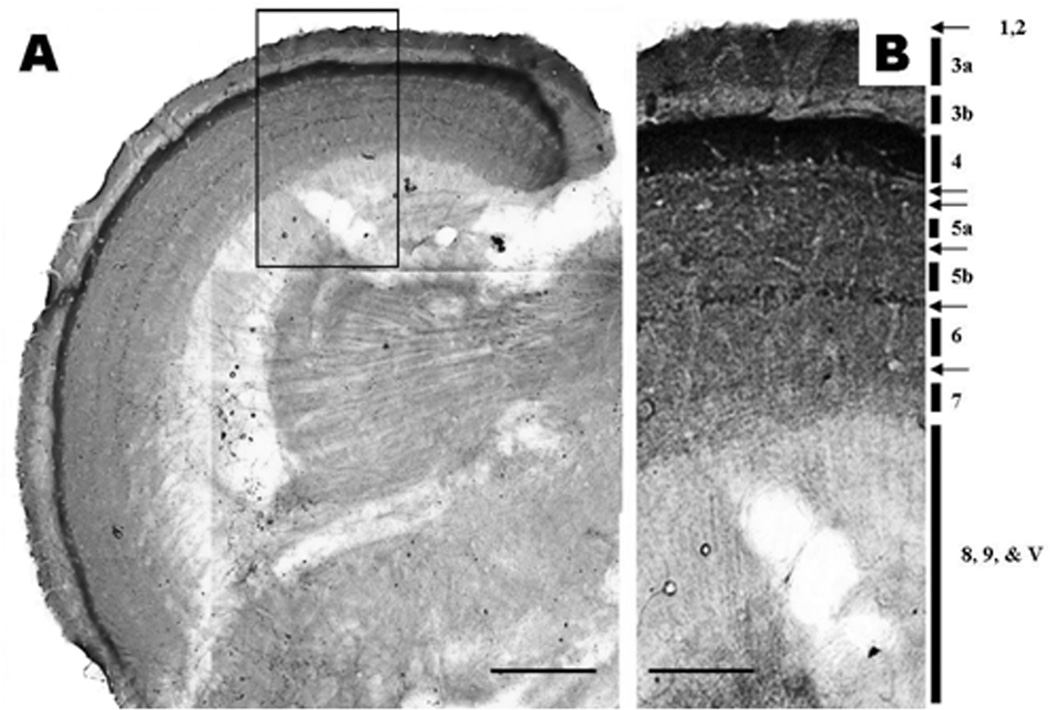
A PAP IHC against nestin, an intermediate filament protein, expressed mostly in the axons or axon terminals of neurons, was used to analyze axonal or axon terminal distribution within the optic tectum layers (Guerette and others, 2007). Figure 8A shows a low magnification (10 × objective) montage that reveals many layers which are presented in more details in figure 8B, a montage made from frames captured with a 100× oil immersion objective. This technique allowed us to depict several synaptic layers labeled on the figure with numbers and arrows. SFM (layer 3) is divided into 3a and 3b layers; SFS (layer 5) is also divided up into 5a and 5b. There are two distinct layers, a light and a dark layer between 4 and 5a labeled with double arrows. A thin, delicate layer can be distinguished between 5a and 5b, between 5b and 6 (SGS) and between 6 and 7 (SAC). Each layer is labeled with a single arrow.
Figure 8.
A. Nestin immunohistochemical stain of neuronal components as seen in an 80 µm thick vibratome section of the adult zebrafish optic tectum. Scale Bar = 150 µm. B. A montage of the framed area in image A captured with 100× oil immersion objective.
1. Pia mater; 2. Glia limitans; 3a & b. Stratum fibrosum marginale; 4. Stratum opticum; 5a & b. Stratum fibrosum and grecium; 6. Stratum album central; 7. Stratum periventricular; 8 & 9. Stratum periventricular; V. Tectal ventricle. Note the intensively stained synaptic layers (arrows) in layers 4,5, & 6. Micron bar = 100 µm
Glial Composition
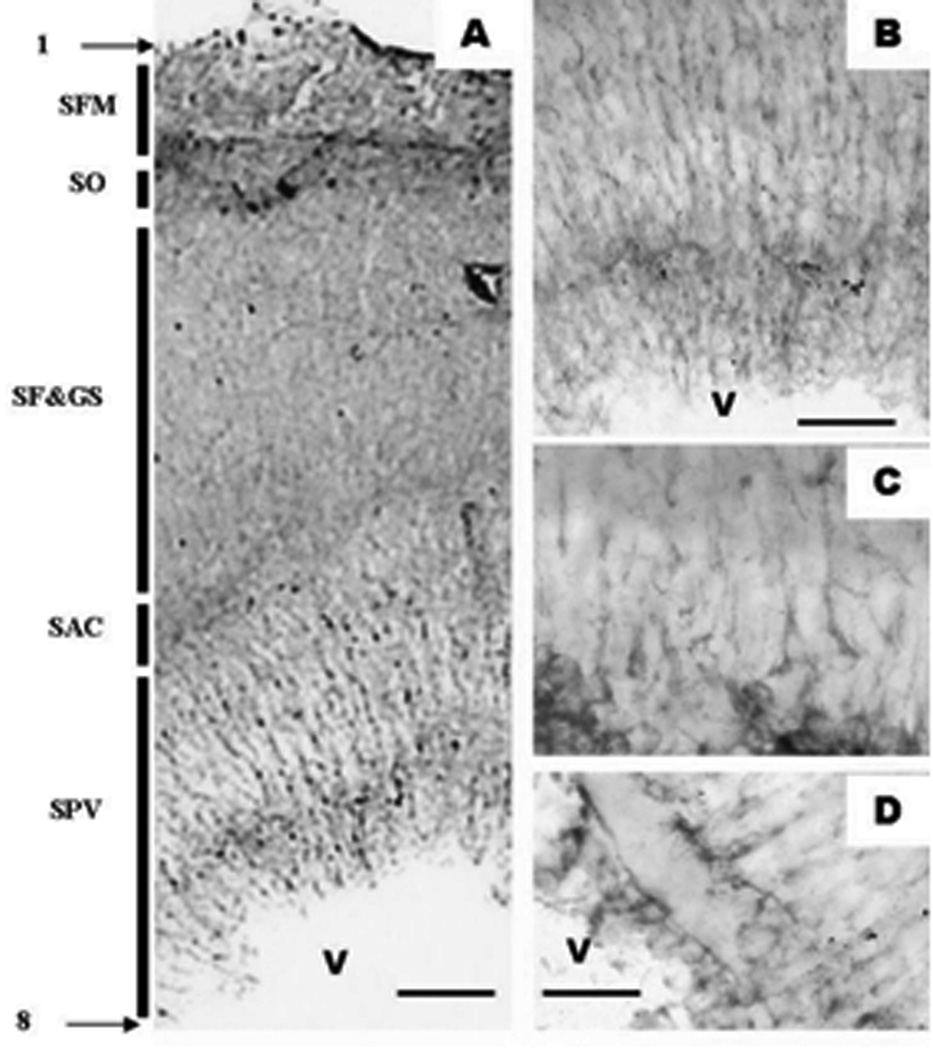
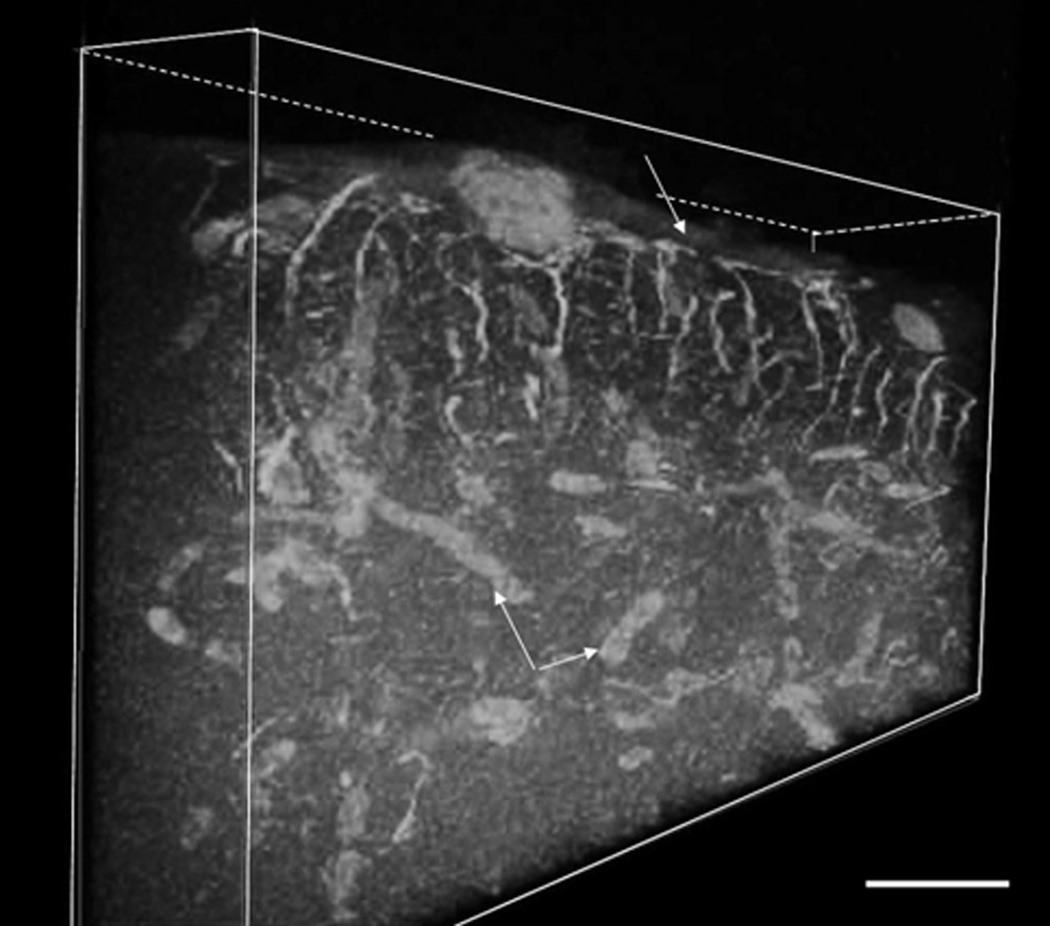
Glial fibriallary acidic protein (GFAP) is known as an immunological marker for astrocytes. We have utilized GFAP immunohistochemistry in with two different approaches, the PAP DAB and the fluorescent approach. Figure 9A (PAP technique) depicts an overview of all the cortical layers as labeled with GFAP. Figures 9B–D show details at higher magnifications. Overall analysis showed that GFAP positive cells/fibers are present throughout the entire tectal cortex (Fig. 9A) but it appears that the cell bodies and radially oriented fibers are more explicit in the periventricular gray zone (Fig 9 B & C). Higher resolution analysis also reveals the intimate relationship of the astrocytic end feet with the blood vessel’s walls (Fig. 9D). Use of the immunofluorescence techniques against GFAP and of confocal microscopy reinforced the previous findings. It was also advantageous in revealing the glial components of the SFN region and the glia limitans (Fig. 10). Autodeblur, a software by AutoQuant, allowed us to present the glial distribution of this layer in a three dimensional mode. It is noteworthy to recognize the rich end feet-made glia limitans (white arrow) immediately below the pia mater as well as the end feet which cover the cortical blood vessels (white arrows with asterisk).
Figure 9.
Adult zebrafish optic tectum as seen in a anti-GFAP-DAB reaction in an 80 µm thick vibratome section. A. is a general overview as seen under a 10× objective B. The periventricular gray zone as seen under 40× objective. C & D. are the periventricular gray zone with 100× oil immersion. Note that the layering of the optic tectum seem in GFAP differs from what we have observed in toluidine blue and nestin staining. 1. Pia mater; SFM - Stratum fibrosum marginale; SO - Stratum opticum; SF&GS - Stratum fibrosum and griseum superficiale; SAC - Stratum album centrale; SPV - Stratum periventriculare; 8. Ependyma; V - Tectal ventricle Micron bars: A = 60 µm , B = 30 µm , C&D = 20 µm
Figure 10.
Three dimensional representation of 30 µm thick stratum fibrosum marginale stained with GFAP immunohistochemistry and collected from an 80 µm thick vibratome section. Note the richly arranged, radially orientated GFAP positive astrocytic fibers with the layers of end feet attaching to the pia mater (white arrow), creating the glial limitans. Double arrows with the asterisk point toward the labeled blood vessels. Micron bar = 30 µm.
Discussion
The overall description of the teleost optic tectum is based on the original Golgi studies by Ramon-y-Cajal (1911), which is a summary of his findings in different fish species. Later, in 1955, Leghissa returned to the same topic and studied the optic tectum with different techniques and found 13 cell types (Leghissa, 1955). His findings were reexamined in 1975 by Vanegas et al, & Vanegas respectively in which only 11 cell types were described (Vanegas, 1974; Vanegas and others, 1974) creating a small confusion. The discrepancy might be due to the techniques used and that different species that were compared; examples being trout, carp and goldfish all of which were summarized as teleosts. Vanegas and Schroder, later, in 1977, reinvestigated and reinforced their earlier findings (Schroeder and Vanegas, 1977).
Since zebrafish became a widely used laboratory animal only during the last decade, it is normal that there is very limited information published concerning its different brain structures, including the optic tectum (Vascotto and others, 1997). In this work we were able to collect some important morphological information pertaining structural characteristics of the adult zebrafish optic tectum both on the light and electron microscopy level. Our approach using different morphological techniques turned out to be valuable in both determining the layering of the optic tectal cortex and characterizing some of its cellular elements.
As far as the layering of the optic tectum in adult zebrafish is concerned we have found great similarities to the published and accepted layer construction in other teleosts. However, we also found some distinct and characteristic features that are not yet described in the literature. These new elements, which require further investigation, may induce interest in other scientists to further explore.
In short, as seen in Figure 11, immediately below the pia mater and the glia limitans (1 & 2) there is a plexiform-type layer filled with a dense assortment of dendrites, axons, and axon terminals and named as the marginal fibrous layer (3). Below it is a layer of bundles of the optic nerve terminals referred to as the stratum opticum (4). Below the stratum opticum a thick layer is found filled with radially oriented dendrites of the unipolar periventricular projecting neurons, afferent and efferent axons, glial processes, and blood vessels that appears as a fibrous structure and named as the stratum fibrosum (5 & 7). This layer, however, is sub-divided into a superficial, more densely packed, stratum fibrosum superficiale (5) and the inner stratum fibrosum griseum (7) which looks to have more cell body components or more recognizable dendritic shafts. At the boundary of these two layers, a monolayer of loosely spaced, magno-cellular type neurons can be found (6). These neurons resemble the pyramidal cells of the neocortex, the massive singular dendritic shafts of which point toward the marginal layer. This monolayer also reminded us of the arrangement of the Purkinje-cells of the cerebellar cortex. It is surprising that we could not find references and a specific name for this eye-catching neuronal types and their layer, therefore we refer to it as a magnocellular layer. Below the stratum griseum is a thin line to which the literature refers to as the internal plexiform layer (8). Following this is the massive layer of many robust axonal bundles comprising the inner white matter tier that is named stratum album centrale (9). These axonal bundles, like in the stratum opticum are arranged in a lattice form, running perpendicular to each other in both medio-lateral and anterio-posterior directions. Below it, the granular-appearing thick layer loaded with the cell bodies of the most prominent cell types of the optic tectum is recognized as the periventricular gray zone (stratum periventriculare, 10). Literature data end this stratum directly attached to the ependymal layer that separates it from the tectal ventricular space filled with cerebrospinal fluid (Romeskie and Sharma, 1979). However, using semi-thin sections stained with toluidine blue and also transmission electron microscopy, we found that there is an additional, very definite distinct layer composed of translucent cells located between the neurons of the periventricular stratum and the ependyma (11). Under the transmission electron microscope, these cells show a watery appearance with very sporadic organelles, several small size granules and few, small vacuoles, which are filled with clear content. This layer is more prominent in the horizontal and cross sectional planes than the sagittal plane and was not visible in any of the other utilized techniques. This might be the reason why it was not recognized thus far and consequently why we could not find any reference to this layer in the literature. We refer to it as a juxtaventricular aqueous layer. We believe that these cells are a specific type of “liquor contact” glial cells. Liquor contact neurons, glia as well as the ependymal cells are well known in the literature (Kawata and Sano, 1979; Sathyanesan and Joy, 1978; Shioda and others, 1977). Here we speculate that these cells might be a special form of ependymal cells (a sub-category of astrocytes) that could be functioning as liquor distributors for the periventricular neurons.
Figure 11.
Composite drawing of the key features seen in the optic tectal cortical structure. The photographic strip at the left of the figure and the naming of the layers is taken from Figure 2 as a guidance to the diagram. In an enhanced way, the rosettes are depicted as they are seen in the SPV (10). A different cell central to the neuronal cell bodies that form rosettes is also shown. The dendritic branches of these structures are grouping together forming structures like a bunch of scallions. This picture also enhances the juxtaventricular aqueous layer and the monolayer of the magnocellular neurons (6).
Specific stains, like Golgi silver impregnation and nestin immunohistochemistry allowed us to collect data about perikarya and dendrites of the periventricular projecting neurons and some information about the axonal bundles and general distribution of synapses. Analyses of the cellular components of the periventricular zone and the fibrous strata revealed that most of the neurons appear to be unipolar with a relatively small perikarya nearly completely filled with their round nuclei and very few organelles. These neurons send their slender, radially oriented dendritic shafts toward the marginal fibrous layer. These dendrites were found very similar as it is described for goldfish by different authors, namely as the nonstratified, monostratified, and bistratified periventricular projection neurons, meaning that the cells have zero, one, or two layers of side dendritic arborization (Meek, 1983; Nevin and others, 2010). Specifics of toluidine blue stained semi-thin sections, fluorescent staining and electron microscopic analysis reinforced that some of these neurons are frequently arranged in a unique type of groupings: the cell bodies forming a raspberry-like barrel or rosette while the converging dendrites bounding together appearing like a bunch of scallions (Fig. 3A; also see Figure 11, layer 10). In the center of the barrel a different type of cell (we refer to it as inner hub-cell) with a very electron dense cytoplasm containing many organelles, and a distinct nucleolus, can be found. This type of cell showed characteristics what is believed to be typical to astrocytes. It came however as a surprise that they did not stain with either GFAP techniques used. The inclusions can be judged as phagocytic vesicles or different granules produced by the cell. Since we did not perform any specific investigation of this content we cannot make any definitive conclusion; it remains for future studies.
In order to collect more information about this type of neuronal arrangement, we applied the squashed preparation technique in which a piece of tectal cortical region was pressed between two glass slides to form a monolayer (Fulop, 1977). This approach exposed similarly arranged bunches of neurons and showed that several of such bunches, containing different numbers of neurons, tend to further converge into a more robust dendritic bundle (Fig. 3B).
Using nestin IHC, which labels growing axons, axonal terminals, and synaptic connections, we found several synaptic layers: (1) labeled in figure 7b with an arrow between layers 5b and 6 that could correspond to an “external plexiform layer”; (2) in the stratum fibrosum marginale immediately above the stratum opticum (Fig. 7, 3b); (3) as well as two thin, distinguished layers below the stratum opticum (labeled ).Unfortunately, we were not able to find in the literature reference to an external plexiform layer which would be implied if one uses the distinguishing term of “internal plexiform layer.” Further studies needed to be performed to find out specifics about these structures.
The glial cells that were detected with both GFAP labeling reaction systems are the astrocytes. These cells in the zebrafish brain are resembling similar cells in cortical structures of the vertebrate brain in general, namely the long, radially arranged processes, spanning across the entire cortical width (the neuroepithelial cells to which the cerebellar Bergmann-glia, the retinal Muller cell or the periventricular tannycytes are related). These cells were also found to have intimate connections through their end feet with the blood vessels of the cortex and forming the glial limitans, immediately under the pia mater (Figs. 8D, 9 asterisk). We were able to detect these astrocytic processes and their specific arrangement in the marginal zone using three-dimensionally rendered z-stacks from a confocal microscope (Figure 9). This figure provides much visual information on the arrangement of glia limitans.
Conclusion
In summary, we could conclude that the use of several morphological techniques allowed us to uncover layers not yet in the literature. Specifically, we have seen a magnocellular monolayer, few additional layers with dense synapses like external plexiform layer for example, and the layer of translucent cells to which we refer as the juxtaventricular aqueous layer. We also have seen specific arrangements of the periventricular projecting neurons what we refer to as raspberry-like rosettes in the center of which we recognized a specific cell type, the so called inner-hub cell. The dendrites of these neurons converge to form what appears like a bundle of scallions. Although these findings appear exciting, further detailed studies are required.
Acknowledgement
This research was supported by a generous donation by an anonymous donor to Wagner College for which the authors are deeply appreciative. An NIH R15 grant (R15AG034524-01) to Dr. Alejandra Alonso provided partial funding. Special thanks go to Dr. William L’Amoreaux, Biology Department, CUNY College of Staten Island and Dr. George Mertz, Digital Microscopy Lab, NYS Institute for Basic Research, for their assistance with confocal microscopy. Our gratitude is also expressed to Dr. Mihaly Kalman, Semmelweis University Medical School, Hungary for his kind help providing nestin and GFAP antibodies and helping to improve the reactions. We also thank Dr. David Bolton and the New NYS Institute for Basic Research for their IACUC committee oversight of our animal facilities. We appreciate the Zebrafish International Resource Center for supplying zebrafish specific antibodies. This organization is supported by grant P40 RR012546 from the NIH-NCRR.
References
- Augustine-Rauch K, Zhang CX, Panzica-Kelly JM. In vitro developmental toxicology assays: A review of the state of the science of rodent and zebrafish whole embryo culture and embryonic stem cell assays. Birth Defects Res C Embryo Today. 2010;90(2):87–98. doi: 10.1002/bdrc.20175. [DOI] [PubMed] [Google Scholar]
- Becker CG, Becker T. Adult zebrafish as a model for successful central nervous system regeneration. Restor Neurol Neurosci. 2008;26(2–3):71–80. [PubMed] [Google Scholar]
- Chandler DE, Roberson RW. Bioimaging. Bioimaging, Current Concepts in Light and Electron Microscopy. Sudbury MA: Jones and Bartlett; 2009. pp. 29–57. [Google Scholar]
- den Hollander AI, Biyanwila J, Kovach P, Bardakjian T, Traboulsi EI, Ragge NK, Schneider A, Malicki J. Genetic defects of GDF6 in the zebrafish out of sight mutant and in human eye developmental anomalies. BMC Genet. 2010;11:102. doi: 10.1186/1471-2156-11-102. [DOI] [PMC free article] [PubMed] [Google Scholar]
- Esain V, Postlethwait JH, Charnay P, Ghislain J. FGF-receptor signalling controls neural cell diversity in the zebrafish hindbrain by regulating olig2 and sox9. Development. 2010;137(1):33–42. doi: 10.1242/dev.038026. [DOI] [PMC free article] [PubMed] [Google Scholar]
- Fulop Z, Lakos I, Basco E, Hajos F. Identification of early glial elements as the precursors of Bergmann-glia: a Golgi-analysis of the developing rat cerebellar cortex. Acta Morphol Acad Sci Hung. 1979;27(4):273–280. [PubMed] [Google Scholar]
- Gard DL. Organization, nucleation, and acetylation of microtubules in Xenopus laevis oocytes: a study by confocal immunofluorescence microscopy. Dev Biol. 1991;143(2):346–362. doi: 10.1016/0012-1606(91)90085-h. [DOI] [PubMed] [Google Scholar]
- Guerette D, Khan PA, Savard PE, Vincent M. Molecular evolution of type VI intermediate filament proteins. BMC Evol Biol. 2007;7:164. doi: 10.1186/1471-2148-7-164. [DOI] [PMC free article] [PubMed] [Google Scholar]
- Kalman M, Kanai J, Antal S, Fulop Z. Histological alterations in the fetal mouse cerebellum after neutron irradiation: a light and electron microscopic study. Int J Neurosci. 1985;28(3–4):235–247. doi: 10.3109/00207458508985391. [DOI] [PubMed] [Google Scholar]
- Kawata M, Sano Y. Histological and cytological studies on the liquor contacting peptidergic neurons in the preoptic nucleus of the Japanese eel (Anguilla japonica) Arch Histol Jpn. 1979;42(3):221–234. doi: 10.1679/aohc1950.42.221. [DOI] [PubMed] [Google Scholar]
- Lam CS, Marz M, Strahle U. gfap and nestin reporter lines reveal characteristics of neural progenitors in the adult zebrafish brain. Dev Dyn. 2009;238(2):475–486. doi: 10.1002/dvdy.21853. [DOI] [PubMed] [Google Scholar]
- Leghissa S. Microscopic structure and cytoarchitecture of the optic tectum of teleost fish. Z Anat Entwicklungsgesch. 1955;118(5):427–463. [PubMed] [Google Scholar]
- Meek J. A Golgi-electron microscopic study of goldfish optic tectum. I. Description of afferents, cell types, and synapses. J Comp Neurol. 1981a;199(2):149–173. doi: 10.1002/cne.901990202. [DOI] [PubMed] [Google Scholar]
- Meek J. A Golgi-electron microscopic study of goldfish optic tectum. II. Quantitative aspects of synaptic organization. J Comp Neurol. 1981b;199(2):175–190. doi: 10.1002/cne.901990203. [DOI] [PubMed] [Google Scholar]
- Meek J. Functional anatomy of the tectum mesencephali of the goldfish. An explorative analysis of the functional implications of the laminar structural organization of the tectum. Brain Res. 1983;287(3):247–297. doi: 10.1016/0165-0173(83)90008-5. [DOI] [PubMed] [Google Scholar]
- Meek J, Schellart NA. A Golgi study of goldfish optic tectum. J Comp Neurol. 1978;182(1):89–122. doi: 10.1002/cne.901820107. [DOI] [PubMed] [Google Scholar]
- Nevin LM, Robles E, Baier H, Scott EK. Focusing on optic tectum circuitry through the lens of genetics. BMC Biol. 2010;8:126. doi: 10.1186/1741-7007-8-126. [DOI] [PMC free article] [PubMed] [Google Scholar]
- Romeskie M, Sharma SC. The goldfish optic tectum: a Golgi study. Neuroscience. 1979;4(5):625–642. doi: 10.1016/0306-4522(79)90139-8. [DOI] [PubMed] [Google Scholar]
- Rosoklija G, Mancevski B, Ilievski B, Perera T, Lisanby SH, Coplan JD, Duma A, Serafimova T, Dwork AJ. Optimization of Golgi methods for impregnation of brain tissue from humans and monkeys. J Neurosci Methods. 2003;131(1–2):1–7. doi: 10.1016/j.jneumeth.2003.06.001. [DOI] [PubMed] [Google Scholar]
- Sathyanesan AG, Joy KP. A micromorphological and histoenzymological study on the third ventricular ependyma of the teleost Clarias batrachus (L.) Z Mikrosk Anat Forsch. 1978;92(4):700–722. [PubMed] [Google Scholar]
- Schroeder DM, Vanegas H. Cytoarchitecture of the tectum mesencephali in two types of siluroid teleosts. J Comp Neurol. 1977;175(3):287–300. doi: 10.1002/cne.901750304. [DOI] [PubMed] [Google Scholar]
- Shioda S, Honma Y, Yoshie S, Hosoya Y. Scanning electron microscopy of the third ventricular wall in the lamprey, Lampetra japonica. Arch Histol Jpn. 1977;40(1):41–49. doi: 10.1679/aohc1950.40.41. [DOI] [PubMed] [Google Scholar]
- Sukardi H, Ung CY, Gong Z, Lam SH. Incorporating zebrafish omics into chemical biology and toxicology. Zebrafish. 2010;7(1):41–52. doi: 10.1089/zeb.2009.0636. [DOI] [PubMed] [Google Scholar]
- Vanegas H. Basic relationships for visual information processing in optic tectum of fish. Acta Cient Venez. 1974;25(3):98–106. [PubMed] [Google Scholar]
- Vanegas H, Amat J, Essayag-Millan E. Postsynaptic phenomena in optic tectum neurons following optic nerve stimulation in fish. Brain Res. 1974;77(1):25–38. doi: 10.1016/0006-8993(74)90802-6. [DOI] [PubMed] [Google Scholar]
- Vascotto SG, Beckham Y, Kelly GM. The zebrafish's swim to fame as an experimental model in biology. Biochem Cell Biol. 1997;75(5):479–485. [PubMed] [Google Scholar]
- Westerfield M. The Zebrafish Book. Eugene: University of Oregon Press; 2007. [Google Scholar]


