

Abstract
Anaplastic thyroid carcinoma (ATC) accounts for over 50% of thyroid cancer mortality and is generally refractory to conventional treatment. Based on recent studies, we hypothesized that ATC metabolism can be targeted to improve response to chemo-radiotherapy. Eight established and authenticated ATC cell lines were sequenced at 140 sites contained within 26 commonly mutated genes to identify novel potential therapeutic targets. Cellular proliferation, energy and reducing potential stores were measured under conditions of specific nutrient deprivation. Tumor metabolism was evaluated using hyperpolarized 13C magnetic resonance imaging (MRI) in a murine orthotopic xenograft model of ATC. Sensitivity to chemotherapeutic agents and radiation (XRT) was assayed using cytotoxicity assays. We identified mutations in BRAF, NRAS and KIT but failed to identify generalized novel targets for therapeutic intervention. ATC cell lines exhibited a mesenchymal phenotype and generalized dependence on glucose for energy, reducing potential and survival. Glycolytic inhibition using 2-deoxyglucose (2-DG) sensitized ATC cells to conventional chemotherapy and external beam radiation. In vivo, 2-DG induced a transient, but significant reduction in ATC metabolic activity.
Generalized dependence of ATC cells on glucose catabolism makes them susceptible to the sensitizing effects of 2-DG for radiation therapy and chemotherapy. Under in vivo conditions, 2-DG can inhibit ATC metabolism. However, the modest magnitude and transient nature of this effect suggest the need for anti-metabolic agents with more favorable pharmacodynamics to achieve therapeutic effects.
Introduction
Anaplastic thyroid carcinoma (ATC) is a rare and aggressive cancer of the thyroid with extremely poor prognosis. While ATC only comprises 1.7% of all thyroid cancers in the U.S., it accounts for over 50% of thyroid carcinoma-related deaths.(1–3) Cellular de-differentiation, local-regional invasion and distant metastasis are characteristic features of ATC.(2) Despite the use of multimodality treatment combining surgery, external beam radiation and chemotherapy, the median survival rate (5 months) has improved little over the last few decades. Poor outcomes associated with ATC can be attributed in part to tumor cell resistance to both conventional and targeted chemotherapeutic strategies. Treatment failure and high rates of local-regional and distant metastasis make the development of effective chemotherapeutic agents an urgent necessity.
One hallmark of rapidly proliferating tumor cells is the shift from mitochondrial respiration to aerobic glycolysis (Warburg effect).(4) Although aerobic glycolysis is inefficient from an energetic perspective, it can fulfill the biomass requirements associated with rapid proliferation.(5) The distinct metabolism of tumor cells makes targeting of metabolic pathways a promising approach for therapeutic interventions. Metabolic agents targeted toward glucose catabolism (2-deoxyglucose (2-DG), lonidamine, bromopyruvate), lactate transport (MCT inhibitors), mitochondrial respiration (metformin) and generalized protein synthesis (mTOR inhibitors) have been described, with varied effectiveness in a variety of solid tumors.(6–13)
The metabolic activity of ATC remains poorly understood. However, indirect evidence suggests that, like other solid tumors, ATC exhibits high rates of glucose uptake and catabolism as indicated by over-expression of glucose transporters and increased 18fluoro-2-deoxyglucose (FDG)- positron emission tomography (PET) avidity.(14, 15) Using established experimental paradigms, we sought to the evaluate metabolic profile in a comprehensive panel of ATC cell lines in order to determine optimal metabolic targeting strategies aimed at improving the effectiveness of conventional chemotherapeutic agents and external beam radiation. We further assessed the potential of metabolic targeting in vivo using an orthotopic ATC xenograft model and hyperpolarized 13C MRI.
Materials & Methods
Cells
A total of eight previously isolated and described ATC cell lines were used for this study. Cell lines were obtained from an established cell bank in the laboratory of Dr. Jeffrey N Myers (University of Texas MD Anderson Cancer Center) under approved institutional protocols. All cell lines were tested and authenticated using short tandem repeat analysis within 6 months of use for the current project.(16) Cells were maintained in either RPMI of MEM growth media supplemented with glutamine, pyruvate, penicillin/streptomycin and 10% fetal bovine serum. For proliferation and survival experiments, a baseline growth profile was obtained in DMEM containing 25mM D-glucose (GLC) and 4mM glutamine (GLN) in order to standardize conditions across cell lines. Cell phenotypes were further established using a combination of bright field imaging (standard growth conditions), immune-fluorescence and Western blotting for expression of E-cadherin (BD Biosciences, CA) and vimentin (Dako Cytomation, CA). Sequencing analysis of 140 mutational hot spots in 26 genes was performed as previously described (Supplementary table 1).(17)
Chemicals
2-deoxyglucose and glutamine were purchased from Sigma-Aldrich, (St. Louis, MO). D-glucose was purchased from ICN Biomedical (Irvine, CA). Cisplatin was obtained from APP Pharmaceuticals (Schaumburg, IL).
Metabolic studies
Intracellular ATP levels and cellular reducing potential were measured as previously described.(18, 19) Proliferation and starvation experiments were carried out for 24–72 hours in media supplemented with glucose and glutamine. At the end of the experimental period relative cell number was ascertained using total DNA content as a surrogate for cell number.
Cytotoxicity studies
Drug and XRT toxicity was assayed using clonogenic assays. ATC cells were irradiated using a high dose-rate 137Cs unit (4.5 Gy/min) to the indicated dose. Cells were incubated with drugs of interest for 24 hours, allowed to recover for 10–14 days, then fixed and stained using a 1% formalin/crystal violet solution. Colonies were counted and surviving fractions were determined based upon the plating efficiency of the non-irradiated control group.
Orthotopic ATC tumors
Male athymic nude mice (8–12 weeks) were purchased from the National Cancer Institute (Bethesda, MD), maintained in a pathogen-free facility and fed irradiated mouse chow and autoclaved, reverse osmosis treated water. The animal facility was approved by the American Association for the Accreditation of Laboratory Animal Care and met all current regulations and standards of the U.S. Department of Agriculture, U.S. Department of Health and Human Services and the National Institutes of Health. All procedures were approved by the Institutional Animal Care and Use Committee of The University of Texas M.D. Anderson Cancer Center. U-HTH83 luciferase expressing cells (2.5×10⁵/mouse) were injected into the right thyroid lobe under direct visualization as previously described.(20) Control and 2-DG treated (500mg/kg administered intraperitoneal) thyroid tumors were imaged at 2 and 24 hours post treatment. Following completion of imaging experiments, all animals were sacrificed and tumors were harvested for histologic evaluation.
Preparation of hyperpolarized [1-13C]Pyruvate
20 μL of [1-13C]pyruvic acid (Isotec) doped with 15 mM Ox63 polarizing radical (GE Healthcare) and 1.5 mM ProHance (Bracco) was polarized using a HyperSense dynamic nuclear polarization (DNP) system (Oxford Instruments). The polarizing target was frozen to ~1.4 K in a 3.35T magnetic field and irradiated at 94.136 GHz for 45–60 minutes.(21, 22) Once the solid state polarization level reached a plateau, the preparation was dissolved in 4 mL of a heated (180°C) solution containing 80 mM NaOH and 50 mM NaCl, then flushed into a vessel from which 200 μL was drawn for injection. The final solution contained 80 mM pyruvate with a nominal pH of 7.6 and temperature of 37°C.
Magnetic resonance imaging and dynamic spectroscopy
All hyperpolarized tracer data was acquired at 7T using a Biospec USR7030 system and B-GA12 imaging gradients (Bruker Biospin Corp, Billerica, MA). Anesthesia was induced and maintained using 0.5–5% isoflurane in oxygen. Animals were placed head first and supine on a sliding bed system. A surface coil (20mm outer diameter) that was tuned for 13C was placed over the thyroid. Anatomic imaging was performed using the 1H channel of a dual-tuned, actively decoupled 1H/13C volume resonator (72 mm ID; Bruker Biospin Corp). Animal positioning was confirmed using a 3-plane fast low-angle shot (FLASH) gradient-echo sequence (TE = 3.6 ms, TR = 100 ms) and the location of the tumor was observed in RARE T2-weighted axial and coronal spin-echo images (TE = 50 ms, TR = 2500 ms, with echo train length of 8, 4 cm × 3 cm FOV encoded over a 256 × 192 matrix, and 1 mm slice thickness). For 13C measurements, signal was excited using the 13C channel of the dual-tuned resonator and detected using the surface coil. Dynamic spectra were acquired using a slice-selective pulse-acquire sequence (SW = 5000Hz over 2048 points, 10° excitation and 8mm slice thickness) that was repeated every 2s for 3 min beginning just prior to injection of 200 μl of 80 mM hyperpolarized pyruvate solution via tail vein catheter. Spectra were phase-adjusted, and the area of the pyruvate and lactate spectral peaks was integrated to yield a time-intensity curve reflecting the arrival of hyperpolarized pyruvate and its conversion into hyperpolarized lactate. These curves were integrated in time to calculate the total relative amounts of hyperpolarized pyruvate and lactate observed over the course of each experiment, and a normalized measure of lactate was formed by dividing total lactate by the sum of lactate and pyruvate. Animals were also scanned at 4.7T using dedicated 1H anatomic imaging coils (35mm ID) for better depiction of disease progression.
Results
ATC cell line characterization
Eight previously isolated and described ATC cell lines were utilized in the current study. Genomic screening of 140 mutational hotspots contained within 26 genes (Supplementary Table 1) confirmed previously identified BRAF V600E mutations in 4 cell lines (U-HTH83, U-HTH104, 8505C, SW1726) and identified non-synonymous mutations in KIT (D816H) (U-HTH7) and N-RAS (Q61R) (U-HTH7). With the exception of BRAF, no other common genomic alteration was found that would suggest efficacy of currently available targeted therapeutic strategies.
Anaplastic tumors generally display an aggressive histology with both epithelial and mesenchymal features.(23–25) Of the 8 ATC cell lines evaluated here, only 1 (U-HTH83) exhibited an epithelial morphology and high expression of E-cadherin (Fig. 1). The remaining 7 cell lines had variable vimentin expression, no E-cadherin expression and a mesenchymal morphology. Given the demonstrated link between a mesenchymal phenotype and resistance to conventional chemotherapy, these findings were discouraging from a therapeutic perspective and prompted us to expand our investigation to other aspects of ATC tumor cell biology.
Figure 1. ATC cell lines exhibit predominantly mesenchymal morphology and characteristics.
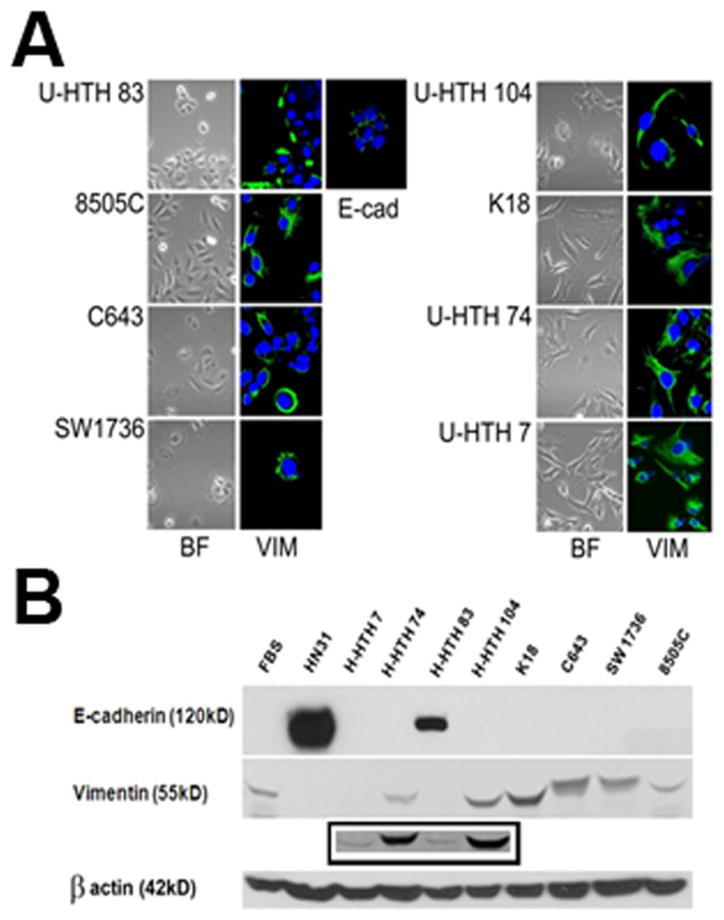
A) ATC cells were imaged using bright-field microscopy and following staining with E-cadherin (1:100) and vimentin (1:100). B) Protein lysates were analyzed for expression of E-cadherin (1:1000) and vimentin (1:1000) using Western blotting. Control lysates were used from thyroid fibroblasts (FBS) and an epithelial HNSCC cell line (HN31). Note: U-HTH 7 expressed vimentin by Western blotting though at much lower levels compared to the remaining cell lines. Inset contains longer exposure of above film.
Glucose catabolism is required for ATC cell line proliferation and survival
Under normal growth conditions (glucose and glutamine) U-HTH83 and U-HTH74 exhibited the highest proliferative rates (Fig. 2). Cell proliferation was measured under conditions of glucose or glutamine deprivation to identify the primary metabolic substrate for this tumor type. In the absence of glutamine, cell number at the 72 hr time point decreased by between 8% (U-HTH74) to 56% (C643) compared to the control condition. In the absence of glucose, corresponding decreases were larger and ranged from 24% (SW1736) to 92% (U-HTH74). Glucose but not glutamine starvation resulted in cell death between 48 and 72 hrs (Supplementary Figure 1). Together these data strongly suggest that, although glutamine is needed for ATC cell proliferation, glucose is the primary nutrient, at least under in vitro conditions.
Figure 2. Removal of glucose and glutamine results in decreased ATC cell population growth.

6 ATC lines were grown in 96 well plates at 3000 cells/well under conditions of glucose or glutamine deprivation as well as standard growth media (MEM for SW1736, 8505C, C543; RPMI for K18, U-HTH74, U-HTH83). Total DNA was assayed at indicated time points and used as a surrogate for cell number. Glucose (D-Glc) deprivation markedly reduced cell proliferation as normalized to control for all lines. Glutamine (Gln) dependence was most clearly observed in SW1736, U-HTH83, and C643. Each condition was tested in triplicate and each experiment was performed at least twice.
ATC energy levels (ATP) and intra-cellular potential are driven by the extra-cellular glucose concentration
Tumor cells can limit DNA damage induced by chemotherapeutic agents and XRT through multiple mechanisms including active efflux, protein binding of toxic compounds and inactivation of reactive oxygen species (ROS). These mechanisms are energy demanding, the former due to ATP requirements of active transport, the latter two due to the need for reducing equivalents to regenerate inactivating proteins such as glutathione.(11) As illustrated in Fig. 3, ATC intra-cellular reducing potential is driven by changes in the extra-cellular glucose concentration, and not by changes in the glutamine concentration. Although these phenomena occur under in vitro conditions, the results suggest that pharmacologic targeting of glycolysis alone could significantly alter ATC intra-cellular energy stores and reducing potential.
Figure 3. ATC intra-cellular ATP and reducing potential levels are driven by extracellular glucose.

A–D) Cells were exposed to various concentrations of glucose or glutamine in the presence or absence of 2-DG for 2hrs. Intra-cellular ATP levels were assayed using a commercially available kit. Reducing potential was assayed using a modified MTT reaction. * denotes p-value < 0.05 (by Student’s t-test) compared to the D-Glc [5mM] condition. Control condition for panel (A) represents reducing potential in the absence of both glucose and glutamine. Each condition was tested in triplicate and each experiment was performed at least twice.
To confirm this hypothesis, we used a competitive inhibitor of glucose, 2-deoxyglucose, which is taken up through glucose transporters and phosphorylated by hexokinase resulting in a non-metabolizable derivative. Administration of 2-DG decreased both intra-cellular reducing potential and ATP levels in a dose dependent manner, beginning at equimolar doses with the extra-cellular glucose concentration (Fig. 3). Based on these data we next evaluated the effects of glycolytic inhibition of ATC cell proliferation and survival in the single agent setting as well as in combination with conventional chemotherapy and XRT.
2-deoxyglucose potentiates the cytotoxic effects of chemotherapy and XRT
In the single agent setting, glycolytic inhibition using 2-DG resulted in a cytostatic effect, with IC50 values in the single mM range, consistent with our previous experience in other solid tumor types (data not shown).(18) The combination of 2-DG and cisplatin resulted in increased cell cytotoxicity compared to either agent alone (Fig. 4A).
Figure 4. 2-DG can potentiate the cytotoxic effects of cisplatin and XRT.

A) ATC cells were exposed to cisplatin and 2-DG for 24hours followed by a 7–10 day recovery period. Data are representative of multiple independent experiments with multiple ATC cell lines. ** denotes p-value < 0.05 (by Student’s t-test) compared to the 2-DG treated condition. * denotes p-value < 0.05 compared to the cisplatin treated condition. B) ATC cell lines were exposed to XRT in the absence or presence of cisplatin (CDDP) and/or 2-DG at the doses indicated. At the end of the experimental time period, colonies were stained and counted and expressed as a fraction of the control condition. ** denotes p-value < 0.05 (by Student’s t-test) compared to the 2-DG+XRT treated condition. * denotes p-value < 0.05 compared to the cisplatin+XRT treated condition. Each condition was tested in triplicate and each experiment was performed at least twice.
Baseline in vitro radio-sensitivity varied dramatically among ATC cell lines tested, with C643 as the least and U-HTH 74 as the most sensitive cell lines. The addition of cisplatin or 2-DG potentiated XRT effects with the combination exhibiting an enhanced effect (representative data shown Fig. 4B). Although the underlying sensitivity of ATC cells to each single agent (2-DG, cisplatin, XRT) varied, the combination of all both drugs with XRT resulted universally in significantly greater cell killing effects than either agent alone.
2-DG transiently decreases ATC tumor reducing potential in vivo
Previous studies have demonstrated in vivo 2-DG potentiation of chemotherapy and radiation effects in various solid tumor types.(12, 13) These studies however have had to utilize supra-physiologic doses administered in a continuous manner to achieve modest therapeutic effects. A short plasma half-life has been thought to contribute to the therapeutic limitations of 2-DG. Until now however, there has been no report of the dynamic effects of 2-DG on in vivo tumor metabolism.
Our in vitro data suggested that 2-DG would significantly affect the intra-cellular reducing potential of ATC cells. Since the pyruvate-lactate reaction representing the final step in glycolysis is modified by the intra-cellular reducing potential, we utilized hyperpolarized (HP) 13C MRI (HP-MRI) using labeled pyruvate to evaluate 2-DG effects on tumor metabolism.
ATC xenografts exhibited rapid growth, and aggressive local-regional expansion, with envelopment of critical structures including trachea and esophagus (Fig. 5). Deposition of 13C label from the pyruvate into the lactate pool was observed in dynamic spectra as a growth of signal at the resonance corresponding to C1 of lactate following injection of hyperpolarized pyruvate (Supplementary Fig. 2). A small increase in lactate signal was noted across the experimental time period (Fig. 6A), consistent with the measured increase in tumor size. Following administration of 2-DG, the net conversion of hyperpolarized pyruvate into lactate was lower in treated tumors (n=3) than in control tumors (n=4) at 2hr post treatment (p = 0.0504; Fig. 6B and C). This effect was not observed at 24 hrs post treatment, with lactate signal varying quite significantly in treated tumors at this time point (data not shown). A second measurement at week 2 demonstrated a similar trend (data not shown), although it is important to note that the second measurement was obtained in tumors that were no longer naïve to 2-DG exposure.
Figure 5. Real-time imaging of ATC xenografts.
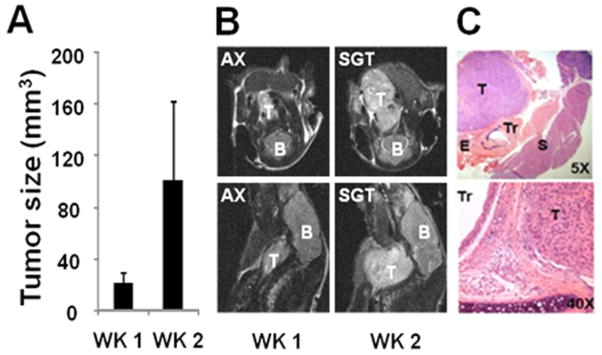
A) Tumor volume data indicating increasing tumor size during the experimental period and B) representative axial (AX) and sagittal (SGT) 4.7T MRI images (B=brain stem/brain, T=tumor). C) Representative H&E images of tumor architecture indicating relationship with adjacent structures and invasion (Tr= trachea, E=esophagus, T=tumor, S=submandibular gland).
Figure 6. 2-DG suppresses HP-MRI signal in ATC xenografts.

A) Normalized levels of hyperpolarized lactate (to total hyperpolarized carbon) from pyruvate-lactate conversion across the two week experimental period demonstrating increased net lactate signal associated with tumor growth. B) HP-lactate signal in tumor was decreased at 2hr following administration of 2-DG (500mg/kg IP) in week 1 (control tumors = 4, treated tumors = 3). C) Representative tracings of 13C signal and pyruvate-lactate conversion in control (CNT) and 2-DG (500mg/kg) treated tumors at 2 hr post treatment (2-DG).
Discussion
Despite its low prevalence, anaplastic thyroid cancer remains one of the most difficult cancers to treat. The high rate of local-regional invasion and distant metastasis makes advanced disease at time of presentation common and limits therapeutic options. The use of multimodality treatment strategies has failed to substantially improve clinical outcomes to date.(2) One explanation for this failure is the presence of extensive microscopic disease at the time of presentation, which fails to be addressed either surgically or with XRT. Novel therapeutic agents must be identified in order to improve treatment effectiveness and reduce the morbidity and mortality associated with ATC.
Multiple conventional and targeted therapeutic agents have been used in the pre-clinical setting (cell lines and mouse xenografts) to variable effect.(2, 20, 26–28) In clinical studies, conventional agents such as cisplatin or doxorubicin have demonstrated some effect with respect to disease progression but failed to significantly alter overall survival. Targeted agents such as gefitinib and sorafenib have similarly modest effects when combined with XRT and conventional chemotherapy.(1–3, 26, 28, 29) We analyzed 26 commonly mutated genes to identify putative targets for existing molecular agents. With the exception of the BRAF V600E mutation, no other mutational events were common among the 8 cell lines tested. Additionally, the majority of cell lines tested exhibited a mesenchymal phenotype known to correlate with resistance to conventional chemotherapeutic agents. In light of these data, we sought to evaluate an alternative strategy which has received increasing attention in recent years: anti-metabolic targeting.
Under in vitro growth conditions, ATC cell lines require both glucose and glutamine for maximal proliferation, but glucose is essential for maintenance of intra-cellular ATP, reducing equivalents and survival. Inhibition of glucose catabolism using 2-DG decreased energy levels and improved the cytotoxicity of cisplatin and XRT. Other studies have demonstrated that such effects can be reproduced in pre-clinical animal models, but only using prolonged administration of supra-physiologic doses of 2-DG.(6, 12) Because these treatment regimens cannot be utilized in the patient population, no clinical applications for 2-DG have been identified despite 30 years of investigation.
One major limitation of 2-DG is its presumed poor in vivo pharmacodynamic profile. Extrapolation from plasma kinetic data has suggested that 2-DG effects in vivo are short lasting and preclude persistent metabolic inhibition of tumors.(13) To date, it has not been possible to directly measure the magnitude and duration of 2-DG effects on tumor metabolism in vivo. This is largely because the primary metabolic imaging modality currently available 18fluoro-2-DG-PET is incompatible with 2-DG treatment.
To evaluate the effects of 2-DG on ATC tumor metabolism we used real-time MRI in the context of an orthotopic xenograft murine model. HP-MRI has been used in recent years to improve disease staging and to guide therapeutic interventions.(30) Pyruvate-lactate conversion represents the ultimate step of aerobic glycolysis. This reaction is controlled in part by the availability of reducing equivalents. Changes in the rate of conversion indirectly reflect the reducing potential of tumors. This is important for two reasons. First, reducing equivalents are essential for cellular energy and biomass production. Second, reducing equivalents are utilized by cells to neutralize reactive oxygen species and prevent DNA damage. Since reactive oxygen species are the primary mechanism by which XRT induces cell death, the reducing potential of tumors is not only important for tumor growth but essential for tumor radiosensitivity.
Consistent with its in vitro effects, 2-DG administration resulted in a significant decrease in ATC xenograft reducing potential as demonstrated by decreased HP-MRI signal. Importantly however, the magnitude of the decrease was limited (~30%) and short lived (<24hr). Together, these data demonstrate experimentally for the first time that: 1) 2-DG does in fact inhibit solid tumor metabolism, 2) the magnitude of this inhibition is small and 3) its effective duration is limited. In light of these results, there is a clear need for improved chemistry of anti-glycolytic agents designed to improve in vivo effective half-life. There exist 2-DG derivatives whose altered chemistry results in increased inhibition of hexokinase activity.(7) To address the short in vivo half life of 2-DG pro-drugs are being described with improved pharmacodynamics.(9) It is likely that these developments will advance glycolytic inhibition from an in vitro phenomenon to a clinical reality in the next few years.
Based on our initial data, we believe that HP-MRI is a promising method to evaluate the pharmacodynamic profile of next generation anti-glycolytic agents. Integration of this imaging platform with real-time capability, will be essential to the development of an iterative process of drug design and optimization which combines in vitro biochemical assays with preclinical animal models of disease. Ongoing studies in our laboratory are aimed at establishing the validity of this paradigm in the context of ATC.
Conclusions
Anaplastic thyroid carcinoma (ATC) cells possess few targetable biologic pathways, and exhibit a mesenchymal phenotype associated with resistance to conventional agents. Generalized dependence on glucose catabolism makes them susceptible to the effects of anti-glycolytic agents. In order to translate the effects observed in vitro however, newer anti-glycolytic compounds with increased effective half-life and potency will be required. The use of HP-MRI represents an essential tool for monitoring the in vivo effectiveness of such novel therapeutic agents and can greatly aid in their design and clinical testing in this and other solid tumors.
Supplementary Material
ATC cells were maintained sub-confluent, plated and starved of glucose or glutamine for 24–72h. Representative images were obtained at all time points. Cells death was prominent in all tested cell lines after 48–72 hours of glucose starvation.
Hyperpolarized signal values were recorded for a total of 100seconds. Changes in chemical composition were recorded spectrally and expressed in parts per million (ppm), with the peak at 171ppm corresponding to hyperpolarized [1-13C]-pyruvate and the peak at 183ppm corresponding to lactate. Control= untreated tumor; 2-DG= 2-DG (500mg/kg) treated tumor.
List of mutational hotspots utilized in genomic analysis.
Acknowledgments
Grant support: This research is supported in part by the National Institutes of Health through National Research Science Award Research Training Grant (NCI) T32 CA060374 (Vlad C. Sandulache), NIH Mentored Career Development Award K08 DE18061 (Stephen Y. Lai), the NIH Cancer Center Support Grant P30 CA016672 (M.D. Anderson Cancer Center) and the NCI Small Animal Imaging Resource Program U24 CA126577 (M.D. Anderson Cancer Center). The content is solely the responsibility of the authors and does not necessarily represent the official views of the National Cancer Institute or the National Institutes of Health.
The authors would like to thank Dr. Matthew Merrit, PhD for his review of and suggestions for the manuscript.
References
- 1.Bhatia A, Rao A, Ang KK, Garden AS, Morrison WH, Rosenthal DI, et al. Anaplastic thyroid cancer: Clinical outcomes with conformal radiotherapy. Head Neck. 2010;32:829–36. doi: 10.1002/hed.21257. [DOI] [PubMed] [Google Scholar]
- 2.Smallridge RC, Copland JA. Anaplastic thyroid carcinoma: pathogenesis and emerging therapies. Clin Oncol (R Coll Radiol) 2010;22:486–97. doi: 10.1016/j.clon.2010.03.013. [DOI] [PMC free article] [PubMed] [Google Scholar]
- 3.Tsimberidou AM, Vaklavas C, Wen S, Hong D, Wheler J, Ng C, et al. Phase I clinical trials in 56 patients with thyroid cancer: the M. D. Anderson Cancer Center experience. J Clin Endocrinol Metab. 2009;94:4423–32. doi: 10.1210/jc.2009-0743. [DOI] [PMC free article] [PubMed] [Google Scholar]
- 4.Warburg O. On the origin of cancer cells. Science. 1956;123:309–14. doi: 10.1126/science.123.3191.309. [DOI] [PubMed] [Google Scholar]
- 5.Vander Heiden MG, Cantley LC, Thompson CB. Understanding the Warburg effect: the metabolic requirements of cell proliferation. Science. 2009;324:1029–33. doi: 10.1126/science.1160809. [DOI] [PMC free article] [PubMed] [Google Scholar]
- 6.Maschek G, Savaraj N, Priebe W, Braunschweiger P, Hamilton K, Tidmarsh GF, et al. 2-deoxy-D-glucose increases the efficacy of adriamycin and paclitaxel in human osteosarcoma and non-small cell lung cancers in vivo. Cancer Res. 2004;64:31–4. doi: 10.1158/0008-5472.can-03-3294. [DOI] [PubMed] [Google Scholar]
- 7.Lampidis TJ, Kurtoglu M, Maher JC, Liu H, Krishan A, Sheft V, et al. Efficacy of 2-halogen substituted D-glucose analogs in blocking glycolysis and killing “hypoxic tumor cells”. Cancer Chemother Pharmacol. 2006;58:725–34. doi: 10.1007/s00280-006-0207-8. [DOI] [PubMed] [Google Scholar]
- 8.Mohanti BK, Rath GK, Anantha N, Kannan V, Das BS, Chandramouli BA, et al. Improving cancer radiotherapy with 2-deoxy-D-glucose: phase I/II clinical trials on human cerebral gliomas. Int J Radiat Oncol Biol Phys. 1996;35:103–11. doi: 10.1016/s0360-3016(96)85017-6. [DOI] [PubMed] [Google Scholar]
- 9.Priebe WFI, Skora S, Conrad CA, Madden T. Blocking glycolysis with 2-deoxy-D-glucose prodrugs to target brain tumors: a novel concept. Molecular Cancer Therapeutics. 2009:8. [Google Scholar]
- 10.Sandulache VC, Ow TJ, Pickering CR, Frederick MJ, Zhou G, Fokt I, et al. Glucose, not glutamine, is the dominant energy source required for proliferation and survival of head and neck squamous carcinoma cells. Cancer. 2011;117:2926–38. doi: 10.1002/cncr.25868. [DOI] [PMC free article] [PubMed] [Google Scholar]
- 11.Simons AL, Ahmad IM, Mattson DM, Dornfeld KJ, Spitz DR. 2-Deoxy-D-glucose combined with cisplatin enhances cytotoxicity via metabolic oxidative stress in human head and neck cancer cells. Cancer Res. 2007;67:3364–70. doi: 10.1158/0008-5472.CAN-06-3717. [DOI] [PMC free article] [PubMed] [Google Scholar]
- 12.Simons AL, Fath MA, Mattson DM, Smith BJ, Walsh SA, Graham MM, et al. Enhanced response of human head and neck cancer xenograft tumors to cisplatin combined with 2-deoxy-D-glucose correlates with increased 18F-FDG uptake as determined by PET imaging. Int J Radiat Oncol Biol Phys. 2007;69:1222–30. doi: 10.1016/j.ijrobp.2007.07.2343. [DOI] [PMC free article] [PubMed] [Google Scholar]
- 13.Singh D, Banerji AK, Dwarakanath BS, Tripathi RP, Gupta JP, Mathew TL, et al. Optimizing cancer radiotherapy with 2-deoxy-d-glucose dose escalation studies in patients with glioblastoma multiforme. Strahlenther Onkol. 2005;181:507–14. doi: 10.1007/s00066-005-1320-z. [DOI] [PubMed] [Google Scholar]
- 14.Kim YW, Do IG, Park YK. Expression of the GLUT1 glucose transporter, p63 and p53 in thyroid carcinomas. Pathol Res Pract. 2006;202:759–65. doi: 10.1016/j.prp.2006.07.006. [DOI] [PubMed] [Google Scholar]
- 15.Schonberger J, Ruschoff J, Grimm D, Marienhagen J, Rummele P, Meyringer R, et al. Glucose transporter 1 gene expression is related to thyroid neoplasms with an unfavorable prognosis: an immunohistochemical study. Thyroid. 2002;12:747–54. doi: 10.1089/105072502760339307. [DOI] [PubMed] [Google Scholar]
- 16.Zhao M, Sano D, Pickering CR, Jasser SA, Henderson YC, Clayman GL, et al. Assembly And Initial Characterization Of A Panel Of 85 Genomically Validated Cell Lines From Diverse Head And Neck Tumor Sites. Clin Cancer Res. 2011;17:7248–64. doi: 10.1158/1078-0432.CCR-11-0690. [DOI] [PMC free article] [PubMed] [Google Scholar]
- 17.Stemke-Hale K, Gonzalez-Angulo AM, Lluch A, Neve RM, Kuo WL, Davies M, et al. An integrative genomic and proteomic analysis of PIK3CA, PTEN, and AKT mutations in breast cancer. Cancer Res. 2008;68:6084–91. doi: 10.1158/0008-5472.CAN-07-6854. [DOI] [PMC free article] [PubMed] [Google Scholar]
- 18.Sandulache VC, Ow TJ, Pickering CR, Frederick MJ, Zhou G, Fokt I, et al. Glucose, not glutamine, is the dominant energy source required for proliferation and survival of head and neck squamous carcinoma cells. Cancer. 2011;117:2926–38. doi: 10.1002/cncr.25868. [DOI] [PMC free article] [PubMed] [Google Scholar]
- 19.Sandulache VC, Skinner HD, Ow TJ, Zhang A, Xia X, Luchak JM, et al. Individualizing antimetabolic treatment strategies for head and neck squamous cell carcinoma based on TP53 mutational status. Cancer. 2012;118:711–21. doi: 10.1002/cncr.26321. [DOI] [PMC free article] [PubMed] [Google Scholar]
- 20.Gule MK, Chen Y, Sano D, Frederick MJ, Zhou G, Zhao M, et al. Targeted therapy of VEGFR2 and EGFR significantly inhibits growth of anaplastic thyroid cancer in an orthotopic murine model. Clin Cancer Res. 2011;17:2281–91. doi: 10.1158/1078-0432.CCR-10-2762. [DOI] [PMC free article] [PubMed] [Google Scholar]
- 21.Golman K, in’t Zandt R, Thaning M. Real-time metabolic imaging. Proc Natl Acad Sci U S A. 2006;103:11270–5. doi: 10.1073/pnas.0601319103. [DOI] [PMC free article] [PubMed] [Google Scholar]
- 22.Ardenkjaer-Larsen JH, Fridlund B, Gram A, Hansson G, Hansson L, Lerche MH, et al. Increase in signal-to-noise ratio of > 10,000 times in liquid-state NMR. Proc Natl Acad Sci U S A. 2003;100:10158–63. doi: 10.1073/pnas.1733835100. [DOI] [PMC free article] [PubMed] [Google Scholar]
- 23.Brabant G, Hoang-Vu C, Cetin Y, Dralle H, Scheumann G, Molne J, et al. E-cadherin: a differentiation marker in thyroid malignancies. Cancer Res. 1993;53:4987–93. [PubMed] [Google Scholar]
- 24.Hoffmann S, Maschuw K, Hassan I, Reckzeh B, Wunderlich A, Lingelbach S, et al. Differential pattern of integrin receptor expression in differentiated and anaplastic thyroid cancer cell lines. Thyroid. 2005;15:1011–20. doi: 10.1089/thy.2005.15.1011. [DOI] [PubMed] [Google Scholar]
- 25.Husmark J, Heldin NE, Nilsson M. N-cadherin-mediated adhesion and aberrant catenin expression in anaplastic thyroid-carcinoma cell lines. Int J Cancer. 1999;83:692–9. doi: 10.1002/(sici)1097-0215(19991126)83:5<692::aid-ijc21>3.0.co;2-1. [DOI] [PubMed] [Google Scholar]
- 26.Kim S, Prichard CN, Younes MN, Yazici YD, Jasser SA, Bekele BN, et al. Cetuximab and irinotecan interact synergistically to inhibit the growth of orthotopic anaplastic thyroid carcinoma xenografts in nude mice. Clin Cancer Res. 2006;12:600–7. doi: 10.1158/1078-0432.CCR-05-1325. [DOI] [PMC free article] [PubMed] [Google Scholar]
- 27.Liu D, Xing M. Potent inhibition of thyroid cancer cells by the MEK inhibitor PD0325901 and its potentiation by suppression of the PI3K and NF-kappaB pathways. Thyroid. 2008;18:853–64. doi: 10.1089/thy.2007.0357. [DOI] [PMC free article] [PubMed] [Google Scholar]
- 28.Voigt W, Kegel T, Weiss M, Mueller T, Simon H, Schmoll HJ. Potential activity of paclitaxel, vinorelbine and gemcitabine in anaplastic thyroid carcinoma. J Cancer Res Clin Oncol. 2005;131:585–90. doi: 10.1007/s00432-005-0673-0. [DOI] [PubMed] [Google Scholar]
- 29.Voigt W, Bulankin A, Muller T, Schoeber C, Grothey A, Hoang-Vu C, et al. Schedule-dependent antagonism of gemcitabine and cisplatin in human anaplastic thyroid cancer cell lines. Clin Cancer Res. 2000;6:2087–93. [PubMed] [Google Scholar]
- 30.Kurhanewicz J, Vigneron DB, Brindle K, Chekmenev EY, Comment A, Cunningham CH, et al. Analysis of cancer metabolism by imaging hyperpolarized nuclei: prospects for translation to clinical research. Neoplasia. 2011;13:81–97. doi: 10.1593/neo.101102. [DOI] [PMC free article] [PubMed] [Google Scholar]
Associated Data
This section collects any data citations, data availability statements, or supplementary materials included in this article.
Supplementary Materials
ATC cells were maintained sub-confluent, plated and starved of glucose or glutamine for 24–72h. Representative images were obtained at all time points. Cells death was prominent in all tested cell lines after 48–72 hours of glucose starvation.
Hyperpolarized signal values were recorded for a total of 100seconds. Changes in chemical composition were recorded spectrally and expressed in parts per million (ppm), with the peak at 171ppm corresponding to hyperpolarized [1-13C]-pyruvate and the peak at 183ppm corresponding to lactate. Control= untreated tumor; 2-DG= 2-DG (500mg/kg) treated tumor.
List of mutational hotspots utilized in genomic analysis.