

Abstract
Type 2 Diabetes (T2D) is characterized by relative insulin insufficiency, caused when peripheral tissues such as liver, muscle, and adipocytes have a decreased response to insulin. One factor that elevates the risk for insulin resistance and T2D is obesity. In obese patients without T2D and initially in people who develop T2D, pancreatic β-cells are able to compensate for insulin resistance by increasing β-cell mass, effected by increased proliferation and hypertrophy, as well as increased insulin secretion per β-cell. In patients that go on to develop T2D, however, this initial period of compensation is followed by β-cell failure due to decreased proliferation and increased apoptosis. The forkhead box transcription factor FoxM1 is required for β-cell replication in mice after four weeks of age, during pregnancy, and after partial pancreatectomy. We investigated whether it is also required for β-cell proliferation due to diet-induced obesity.
Keywords: Obesity, pancreas, diabetes, FoxM1
Type 2 diabetes (T2D) results from a relative deficit of insulin, generally due to a blunted response to insulin signaling in peripheral tissues. The risk for developing T2D is exacerbated by weight gain and the metabolic changes that accompany a high-energy diet, which include elevated blood glucose with a resulting increase in insulin levels as well as increased circulating free fatty acids (FFA). In adult humans, every 5% weight gain is associated with an approximate 20% increase in the risk of insulin resistance [1]. In the U.S., men and women gain an average of approximately 0.5–1 pound per year between the ages of 25–55 years, and thereafter lose weight [2], although this statistic masks a substantial weight gain in a large proportion of the population. Over a ten year period, 38% of men and 37% of women between the ages of 25 and 44 gain between five and 15 pounds; 10% of men and 15% of women gain between 15 and 25 pounds, and 3.5% of men and 6.5% of women gain more than 25 pounds [2]. A disturbing trend that likely contributes to high obesity rates is that those people who are overweight at baseline are more likely to gain weight within ten years than their lean counterparts [2, 3].
INSULIN RESISTANCE DURING OBESITY
Insulin, produced by the pancreatic β-cells, instructs peripheral tissues to absorb glucose after feeding. Normally, binding of insulin to its receptor results in tyrosine phosphorylation of the insulin receptor substrates 1 and 2 (IRS1/2) [4, 5], which form complexes with and can phosphorylate associated proteins, resulting in activation of multiple downstream pathways [6]. For example, IRS is bound to and can activate phosphoinositide 3-kinase (PI3K). PI3K then phosphorylates the cell membrane phospholipid, phosphatidylinositol (4,5) bisphosphate (PIP2), converting it to phosphatidylinositol (3,4,5)-trisphosphate (PIP3) [7]. PIP3 and other targets of IRS in turn activate a variety of downstream targets with tissue-specific effects. Insulin-responsive tissues include adipose tissue, muscle, liver, and β-cells themselves. Obesity modifies how these peripheral tissues respond to insulin, with white adipose tissue, liver, and muscle playing major roles in the development of insulin resistance (see Fig. 1 for summary of the effects of obesity on insulin signaling).
Fig. 1.

The effects of obesity-induced impaired insulin signaling. Red arrows indicate the ultimate effect of impaired insulin signaling in a given cell type, while red circles indicate initiating events that do not occur because of impaired insulin signaling. A) Impaired insulin signaling in adipocytes increases FFA release during the fed state, decreases energy storage, and decreases adiponectin release, the latter of which causes further decreases in peripheral tissue insulin sensitivity. B) In muscle (as in other cell types), impaired insulin signaling leads to decreased translocation of Glut4 to the plasma membrane, decreasing glucose uptake and increasing blood glucose levels. C) Elevated insulin signaling in hepatocytes leads to increased fat storage, which causes insulin resistance. Impaired insulin signaling in hepatocytes also leads to an increase in gluconeogenic gene expression, glucose release, and ultimately increased blood glucose levels. D) In β-cells, impaired insulin signaling results in decreased expression of proliferative and anti-apoptotic genes, contributing to reduced β-cell mass.
In adipocytes (Fig. 1A), the Src-homology 2 (SH2)-containing adaptor protein Shc is bound to the insulin receptor and is activated upon insulin binding. Shc in turn complexes with and activates growth receptor bound factor 2 (Grb2) and the guanine nucleotide exchange factor Son of Sevenless (Sos), resulting in Ras phosphorylation and activation [8]. Activated Ras then phosphorylates and activates mitogen-activated protein kinase (MAPK), which in turn upregulates the expression of sterol regulatory element binding protein 1c and 2 (SREBP1c/2) [9]. SREBP1c/2 upregulate fatty acid synthase (FAS), thus enhancing the storage of energy as fat and increasing adipose tissue [10–12]. Additionally, insulin signaling through the IRS normally represses the expression of lipases, including hormone-sensitive lipase (HSL), which promote lipolysis [13, 14]. Thus, reduced levels of insulin during fasting states promote the release of FFA into the bloodstream [15]; increased stores of fat in the obese mean that more FFA are released during fasting, elevating circulating FFA levels [16]. Increased circulating FFA contribute to insulin resistance by impairing insulin signaling, most likely by increasing oxidative stress and increasing inhibitory serine phosphorylation of IRS1/2 [17, 18]. In a vicious cycle, insulin resistance contributes to increased levels of FFA in the fed state, since low levels of insulin signaling normally instruct the body to release FFA because blood glucose levels are low. Adipose tissue also contributes to insulin resistance by releasing altered levels of hormones and cytokines that modulate metabolism, such as adiponectin and TNF-α (reviewed by Schinner et al., 2005) [19]. Adiponectin generally sensitizes the body to insulin [20, 21] and is reduced in response to obesity [22]; in addition to its role in promoting adiposity, SREBP1c also transactivates adiponectin [23].
In muscle, (Fig. 1B) PIP3 recruits 3-phosphoinositide dependent kinase 1/2 (PDK1/2), atypical protein kinase C (aPKC), and the serine-threonine kinase Akt [also known as protein kinase B (PKB)], to the membrane, after which PDK1/2 phosphorylates aPKC and Akt [24]. Phosphorylated aPKC and Akt stimulate translocation of the glucose transporter Glut4 to the plasma membrane, which allows increased glucose entry [25]. Impaired insulin signaling in muscle ultimately results in diminished levels of Glut4 at the cell surface and reduced glucose uptake in response to insulin. In hepatocytes (Fig. 1C), signaling through the insulin pathway normally increases activated Akt and aPKC through PDK1/2. Akt in turn phosphorylates the transcription factor FoxO1, which induces its translocation from the nucleus to the cytoplasm, thus inhibiting its transcriptional activity [26, 27]. In the nucleus, FoxO1 transactivates the promoters of glucose-6-phosphatase (G6Pase) [28] and phosphoenolpyruvate carboxykinase (PEPCK) [29], both of which are gluconeogenic enzymes; thus, insulin signaling normally inhibits gluconeogenesis, but impaired insulin signaling leads to aberrant hepatic glucose production and output and increased blood glucose levels. In addition to their other roles in the response to insulin signaling, in the hepatocyte, aPKC activates transcription of SREBP1c, while Akt stimulates processing of SREBP1c, which is required for its activity [30, 31]. As in adipocytes, SREBP1c transactivates FAS and promotes fat storage within the liver, which substantially reduces overall insulin sensitivity [32, 33]; increased fat storage in the liver is likely a contributing event in the development of T2D.
β-CELL RESPONSE TO OBESITY
Increased insulin resistance elevates blood glucose levels, both because peripheral tissues no longer take up as much glucose and because the liver releases abnormally high amounts of glucose. In response, β-cells produce more insulin, both by secreting more insulin per β-cell and by increasing β-cell mass. β-cell proliferation is the primary method by which β-cell mass increases during obesity, stimulated by increased blood insulin and glucose concentrations (reviewed by Sachdeva et al., 2009) [34].
As in peripheral tissues, insulin signaling in β-cells leads to increased levels of PIP3, activating Akt through PDK1/2 [35, 36]. Akt in turn positively regulates β-cell mass by activating the cell cycle regulators Cyclin D1 (CcnD1), CcnD2, p21Cip1 and Cyclin-dependent kinase 4 (Cdk4) [37] as well as regulating several anti-apopotic genes [38]. Insulin signaling also stimulates β-cell replication and inhibits apoptosis via IRS-mediated activation of the MAPK pathway through Grb2 [39–41]. Impaired insulin signaling in β-cells leads to increased apoptosis and decreased proliferation (Fig. 1D). Although β-cell mass expansion and increased insulin secretion can compensate for elevated insulin demand during the initial stages of insulin-resistance-induced glucose intolerance, studies in diabetic patients and in rodents suggest that diabetes results when β-cells can no longer proliferate or secrete enough insulin to compensate for insulin resistance.
Although the effects of glucose are difficult to distinguish from those of elevated insulin levels associated with hyperglycemia, some lines of evidence support a role for elevated glucose itself or glucose metabolism contributing to increased β-cell mass. First, β-cell replication is increased in hyperglycemic-euinsulinemic clamped rodents [42, 43]. Second, mice heterozygous for glucokinase, a key enzyme in glucose metabolism, fail to increase β-cell proliferation in the face of high fat diet (HFD)-induced obesity [44]. Third, mice deficient for both Insulin 1 and 2 (Ins1/2) are hyperglycemic and have increased β-cell mass and proliferation compared to controls [45, 46].
Recent genome-wide association studies have identified several single nucleotide polymorphisms (SNPs) near cell cycle genes that are linked to both T2D and gestational diabetes mellitus (GDM), supporting a role for β-cell replication failure in diabetes [47–50]. Loci near SNPs linked to both T2D and GDM include CDK5 regulatory subunit-associated protein 1-like 1 (CDKAL1) and cyclin-dependent kinase inhibitor 2A and B (CDKN2A and CDKN2B), while cell division cycle 123 homolog (CDC123) is linked to T2D only. Studies in mice have also confirmed that inactivation of genes that promote cell cycle progression can lead to diabetes, whereas inactivating mutations in cell cycle inhibitors are protective against β-cell failure. Cdk4−/− mice are viable, but they display reduced β-cell area and develop diabetes by two months of age [51]. Conversely, mice deficient in either cell cycle inhibitor p27Kip1−/− or p16Ink4a−/− recover β-cell mass more swiftly after treatment with the β-cell toxin streptozotocin than do control mice [52, 53].
In non-diabetic humans, β-cell volume density, a measure of insulin-positive area compared to total area, positively correlates with weight [54, 55]. However, in overweight patients with T2D, β-cell volume density is reduced by between 50–75% compared to correspondingly overweight non-diabetic patients [56, 57]. Additionally, β-cell volume density inversely correlates with the number of years betwen diagnosis of T2D and the time of analysis [56]. An increase in β-cell replication in overweight non-diabetic patients but not overweight diabetic patients has been reported by the Rosenberg laboratory [58], while the Butler laboratory reported a lack of increased β-cell replication in obese patients compared to controls. Both laboratories report an increase in apparent neogenic β-cell mass, defined as insulin-positive cells within or adjacent to pancreatic ducts in obese non-diabetic, lean diabetic, and obese diabetic patients, compared to lean non-diabetics. Both labs also reported an increase in β-cell apoptosis in diabetic patients compared to non-diabetic patients [57, 58], suggesting that a combination of increased β-cell death and reduced β-cell proliferation contribute to reduced β-cell volume in patients with T2D. The correlation between β-cell number, body weight, and the onset of diabetes suggests that in T2D, β-cell failure occurs after an initial compensatory phase of β-cell expansion. Limitations in human studies, however, prohibit a clear conclusion; therefore, examination of β-cell compensation and failure has mainly relied on rodent models.
RODENT MODELS OF OBESITY
Mice deficient for leptin (Lepob/ob) or the leptin receptor (Leprdb/db) exhibit identical phenotypes when on the same genetic background. Both mutations cause enormous weight gain due to hyperphagia and reduced energy expenditure. The weight of Lepob/ob mice and Leprdb/db mice reaches a plateau of around 60–70 grams (g) compared to around 30–40 g in wildtype mice [59, 60]. Lepob/ob and Leprdb/db mice on a C57Bl/KSJ background exhibit increases in β-cell mass between three- and five-fold before the onset of diabetes with increases in β-cell replication as early as two weeks of age [60–62].
The inbred Zucker diabetic fatty rat line (ZDF) and the outbred Zucker fatty rat line (ZF) also have homozygous mutations in the leptin receptor [63]. ZDF and ZF rats both gain more weight than Zucker lean control rats (ZLC) and display insulin resistance, but ZDF rats develop overt diabetes around ten weeks of age while ZF rats remain euglycemic [64]. At five to seven weeks of age, the β-cell mass of both ZF and ZDF rats is approximately two-fold higher than that of ZLC rats. By twelve weeks, the β-cell mass of ZF rats increases to four-fold that of ZLC rats, while no further expansion of β-cell mass occurs in ZDF rats. As in overweight diabetic humans versus non-diabetic humans, ZDF rats display increased numbers of apoptotic β-cells with continued elevated β-cell proliferation, suggesting that apoptosis contributes to the reduced β-cell mass observed in diabetic humans and rodents.
Obesity can also be induced in certain strains of rodents by feeding them a diet rich in calories, fat, and carbohydrates, leading to glucose intolerance, insulin resistance, and β-cell mass expansion followed by β-cell failure. C57Bl/6J mice and mice on certain mixed genetic backgrounds gain weight on HFD, usually by an additional 20–25% compared to mice on a chow diet [44, 65–68]. These mice exhibit glucose intolerance despite normal levels of secreted insulin, suggesting insulin resistance. C57Bl/6J, C57Bl/6J-X129Sv hybrid, and C57Bl/6J-XDBA/2J hybrid strains of wildtype mice maintained on HFD for between 20 and 52 weeks increase their β-cell mass by approximately 2.25-fold [44, 67, 68], with β-cell proliferation increasing from between three- and four-fold, at least in young mice [44, 68]. At twelve months of age, proliferation decreases three-fold in C57Bl/6J mice fed HFD beginning at six weeks of age compared to those fed a chow diet, and premature β-cell senescence is also increased in HFD-fed mice [68]. Further demonstrating the requirement for β-cell replication in adaptation to HFD-induced insulin resistance, mice lacking S-phase kinase-associated protein 2 (Skp2), a component of a ubiquitin ligase complex that degrades p27Kip1 to promote cell cycle progression, fail to increase their β-cell mass on HFD and exhibit diminished β-cell proliferation [69]. Skp2−/− mice develop overt diabetes after twelve weeks on HFD. Overall, rodent models support the hypothesis that obesity leads to peripheral insulin resistance, leading to a compensatory increase in β-cell mass, and followed by an ultimate depletion of β-cells due to apoptosis that correlates with the onset of diabetes. However, some contradictions with human data exist. Evidence for increased proliferation due to obesity in humans remains controversial [57, 58], and no evidence for increased neogenesis due to obesity exists in rodents. Studies in both human and rodents, however, support a role for increased β-cell apoptosis in the development of T2D.
β-CELL REPLICATION DECREASES WITH AGE
β-cell mass expansion fails for reasons other than obesity and insulin resistance. The capacity for β-cell replication is severely blunted with age [52]. Aging mice demonstrate an impaired response to a variety of β-cell injuries or other proliferative stimuli as early as seven months of age, with virtually no replicative capacity regardless of stimulus by 14 months of age. Injury models and proliferative stimuli examined included HFD, partial pancreatectomy (PPx), streptozotocin, and the glucagon like peptide 1 (GLP-1) analog exendin-4 [70, 71]. Decreased β-cell proliferation correlates with increased nuclear accumulation of cell cycle inhibitors such as p16Ink4a and p27Kip1 [52, 72]. Diminished proliferation of β-cells in older animals suggests that the β-cell failure observed in T2D may occur because of a combination of the natural decrease in β-cell replication and increase in apoptosis with age along with a need for increased β-cell mass. Indeed, the risk for both T2D and GDM increases with age [73, 74], and β-cell replication inversely correlates with age in non-diabetic humans [57].
FOXM1 REGULATES PROLIFERATION
Since the capacity for proliferation is essential to maintain β-cell mass and to compensate for insulin resistance, studying factors important for β-cell mass expansion is essential for advancing the treatment of diabetes. One such factor is the forkhead box transcription factor FoxM1, which promotes progression through the cell cycle by regulating genes important for the G1/S and G2/M transitions as well as genes required for karyokinesis and cytokinesis. During G1, FoxM1 activates transcription of Skp2, cell division cycle 25 homolog A (Cdc25a), kinase-interacting stathmin (KIS), and Cdk subunit 1 (Cks1). During G2, FoxM1 regulates Cdc25b, CyclinB (Ccnb), and Aurora-A kinase. FoxM1-regulated genes important for mitosis include Polo-like kinase 1 (Plk1), Aurora-B kinase, Survivin, and Cenp-A and –B [75, 76].
Foxm1 expression is limited to proliferating cells, exhibiting broad activation in the developing embryo but more limited expression in the adult [77]. FoxM1 is essential for survival, as mice with a global inactivating mutation of Foxm1 die during embryogenesis due to heart, liver, and vasculature abnormalities associated with severely impaired proliferation [78, 79]. However, cell type-specific inactivation of Foxm1 reveals that the requirement for FoxM1 differs among various tissues. For example, mice with a deletion of Foxm1 in early liver progenitors using Cre recombinase under the control of the Alpha-fetoprotein enhancer and the albumin promoter and enhancer (Afpp-Cre) also die during embryogenesis due to defects in liver morphogenesis [79], while mice with a late Foxm1 deletion solely in differentiated hepatocytes using an Albumin-Cre transgene survive normally but display polyploid hepatocytes and a reduced capacity for liver regeneration [80]. Furthermore, mice with an early deletion of Foxm1 specifically in the lung epithelium exhibit only postnatal defects [81], while mice with Foxm1 deleted in smooth muscle cells die shortly after birth due to defects in blood vessel and esophagus formation [82]. Many models of tumor formation and cancer have demonstrated the necessity of FoxM1 in tumor progression (reviewed by Laoukuli et al., 2007) [83]. Thus, FoxM1 is essential for cell division in multiple mature tissues as well as in a limited number of developing tissues.
ROLE OF FOXM1 IN β-CELL PROLIFERATION
In the embryo, Foxm1 is expressed in almost all pancreatic endocrine cells, but by nine weeks of age, Foxm1 expression seems to be limited to a subset of endocrine cells [84]. This expression pattern correlates with the decreased β-cell proliferative capacity observed with advancing age. At least in young mice, Foxm1 expression is reactivated in the islet during the proliferative peak of β-cells during pregnancy and after PPx [85, 86].
Our lab has previously demonstrated that FoxM1 is required for β-cell mass expansion after approximately four weeks of age. Mice with Foxm1 deleted throughout the pancreatic epithelium beginning at embryonic day (E) 9.5, using the pancreatic-duodenal homeobox 1 (Pdx1) promoter driving Cre recombinase expression (Pdx1-Cre) [87] display reduced β-cell mass compared to littermate controls, by approximately 25% at four weeks and by approximately 50% by nine weeks of age [84]. β-cell mass does not increase in Pdx1-Cre;Foxm1flox/flox mice after three to four weeks of age, while in littermate controls β-cell mass almost doubles within the same timeframe. Reduced β-cell mass in Pdx1-Cre;Foxm1flox/flox mice is linked to decreased β-cell proliferation, which is diminished by approximately 75% at four weeks of age. Male but not female Pdx1-Cre;Foxm1flox/flox mice display impaired glucose intolerance at six weeks of age despite a similar β-cell mass reduction in both genders.
FoxM1 is also required for β-cell mass expansion after PPx and during pregnancy [85, 86]. As a result, β-cell mass fails to regenerate in Pdx1-Cre;Foxm1floxP/flox female mice following PPx, while control females undergo significant β-cell proliferation and expansion. Similarly, during pregnancy, β-cell proliferation does not increase in Pdx1-Cre;Foxm1flox/flox mice beyond that of virgin mutants, despite a three-fold increase in β-cell proliferation at gestational day (GD) 15.5 in pregnant controls. This reduced β-cell replication leads to GDM in Pdx1-Cre;Foxm1flox/flox mice.
Although necessary for β-cell proliferation in all circumstances examined thus far after four weeks of age, FoxM1 is not required for embryonic β-cell replication, demonstrated by normal β-cell mass in Pdx1-Cre;Foxm1flox/flox mice at birth [84, 85]. Recently, the importance of neogenesis in adult β-cell mass expansion has been explored [88]. Reactivation of Neurogenin3 (Ngn3), a transcription factor required for endocrine cell development embryonically, can occur under some circumstances in the adult. Newly formed β-cells in adults derived from these reactivated endocrine progenitors are capable of proliferation; this initial proliferation, similar to proliferation of perinatal β-cells, does not require FoxM1 [84–86].
Loss of FoxM1 leads to decreased β-cell proliferation due to altered expression of cell cycle regulators. As in other tissues affected by deletion of Foxm1, cell cycle regulators are differentially expressed in the islets of Pdx1-Cre;Foxm1flox/flox mice. The cell cycle inhibitor p27Kip1 is increased in Pdx1-Cre;Foxm1flox/flox islet nuclei [84], and these mice fail to exhibit normal down-regulation of p27Kip1 during pregnancy [86]. Similarly, the cell cycle inhibitor Menin (Men1) is also increased in the islets of pregnant Pdx1-Cre;Foxm1flox/flox mice compared to control mice. Overall, FoxM1 is required for β-cell mass expansion during periods of glycemic stress.
FOXM1 REGULATION
Humans possess three isoforms of FOXM1, FOXM1A, B, and C, which are differential splice forms from a single locus. FOXM1C is the most transcriptionally active isoform in humans, while FOXM1B is most similar to murine FoxM1, for which only one isoform exists [89–91]. Foxm1 is regulated both transcriptionally and post-translationally (Fig. 2). Foxm1 transcript levels increase from the beginning of S-phase through mitosis and are sharply reduced at the beginning of G1 [83]. Currently, the only known regulator of Foxm1 expression is c-Myc [92].
Fig. 2.

Model of FoxM1 regulation. A) FoxM1 contains an N-terminal repressor domain (NRD), a forkhead DNA binding domain, a transactivation domain (TAD), and a less-well characterized fourth region. Known mouse FoxM1 phosphorylation sites and their kinases are noted. B) Foxm1 expression and activity are tightly regulated. Foxm1 expression peaks in late G1, and is maintained through mitosis. FoxM1 activity is slightly delayed compared to its RNA expression, due to posttranslational regulation. FoxM1 cytoplasmic/nuclear shuttling is controlled by MAPK phosphorylation. Autorepression by the NRD is relieved by Chk2 phosphorylation, and the recruitment of coactivators is regulated by Cdk1/2 phosphorylation. Because Chk2 and Cdk1/2 are primarily nuclear proteins, phosphorylation of FoxM1 by these factors likely occurs in the nucleus, although this has not been confirmed. The order of phosphorylation events and whether multiple phosphorylation events are required for FoxM1 activity are currently unknown, and whether nuclear FoxM1 binds to DNA before phosphorylation by Chk2 and Cdk1/2 is unclear. N-terminal phosphorylation, dependent on the APC cofactor Cdh1, targets FoxM1 for proteosomal degradation. Phosphatases involved in FoxM1 dephosphorylation are currently unknown.
FoxM1 activity, though following a similar time course to Foxm1 expression during the cell cycle, is slightly delayed, owing to posttranslational regulation [83]. FoxM1 activity is regulated at multiple levels (Fig. 2). Firstly, FoxM1 is excluded from the nucleus until phosphorylated by MAPK [91]. FoxM1 contains an N-terminal repressor domain (NRD), which physically interacts with and represses its C-terminal transactivation domain [75, 93]; this repressor activity is relieved when FoxM1 protein is phosphorylated by the Checkpoint homolog Chk2. Recruitment of transcriptional co-factors such as CREB-binding protein (CBP/p300) is dependent on phosphorylation by Cdk1/2 [94]. FoxM1 is also rapidly degraded at the end of mitosis. This degradation is controlled by N-terminal phosphorylation dependent on the anaphase promoting complex (APC) cofactor Cdh1, indicating proteasomal involvement [95]. Regulation of FoxM1 at multiple levels is crucial because of its vital role in cell cycle regulation. FoxM1 activity is observed in malignant tumor cells, and the absence of FoxM1 leads to defects in regeneration and coupling of the cell cycle to chromosomal segregation.
A ROLE FOR FOXM1 IN β-CELL MASS EXPANSION DUE TO DIET-INDUCED OBESITY?
Because β-cell proliferation is the primary method by which β-cell mass expansion is achieved during periods of obesity, and because FoxM1 plays a critical role in β-cell mass expansion in response to other proliferative stimuli, we postulated that FoxM1 is also required for the β-cell mass expansion induced by weight gain. In order to test this hypothesis, Pdx1-Cre;Foxm1flox/flox C57Bl/6J or mixed background female mice were fed HFD for eight or twelve weeks, respectively, and their glucose homeostasis, β-cell mass, and β-cell proliferation were assessed in comparison to control mice. C57Bl/6Jx129SvJxDBA control mice on HFD did not exhibit increased β-cell mass compared to controls on chow diet. Additionally, Foxm1 mutants on a C57Bl/6J background displayed no significant difference in β-cell mass compared to control mice, but mice deficient for Foxm1 in the pancreas displayed more severe glucose intolerance than control mice. This data suggests that FoxM1 may play a role in β-cell function as well as proliferation.
MATERIALS AND METHODS
Animals and genotype analysis
The derivation of Foxm1flox and Pdx1-Cre mice has been reported previously [87]. All mice were maintained on a C57Bl/6J background or a mixed C57Bl/6Jx129SvJxDBA background. Genotyping was performed by PCR analysis using genomic DNA isolated from the ears of weanling mice. Littermate Foxm1flox/flox, Foxm1flox/+ and Pdx1-Cre;Foxm1flox/+ mice were used as controls. Mice were weaned at three weeks and placed on a high fat diet (59% fat by calorie content, Bioserv, Frenchtown, NJ, USA) or chow diet (25% fat by calorie content, LabDiet) at four weeks of age for eight or twelve weeks. All procedures involving mice were conducted in accordance with protocols approved by the Vanderbilt Institutional Animal Care and Use Committee under the supervision of the Division of Animal Care.
Blood glucose measurements
Blood glucose was measured using a Freedom Freestyle glucometer and test strips. For IPGTT, mice were fasted overnight for 16 hours, then injected with 2 g/kg glucose, and blood glucose was measured prior to injection and then at 15, 30, 60, 90, and 120 minutes post-injection.
Tissue processing and immunostaining
Tissues were fixed in 4% paraformaldehyde (PFA) dissolved in 1X phosphate-buffered saline (PBS) overnight at 4°C and embedded in paraffin before sectioning at 5 μm. Antibodies included guinea pig anti-insulin (1:1000; Linco/Millipore, Billerica, MA, USA), mouse anti-Ki67 (1:500, BD Bioscience, San Jose, CA, USA) rat anti-BrdU (1:400; Accurate Chemical & Scientific, Westerbury, NY, USA), Cy2-conjugated anti-guinea pig IgG (1:1000; Jackson Laboratories, Bar Harbor, ME, USA), Cy3-conjugated anti-rabbit IgG (1:1000, Jackson), Cy3-conjugated anti-mouse IgG (1:1000; Jackson) Cy3-conjugated anti-rat IgG (1:1000, Jackson), and horseradish-peroxidase-conjugated anti-guinea pig IgG (1:1000, Jackson). Slides were dewaxed and rehydrated through a xylene and ethanol series, after which sodium citrate microwave antigen retrieval was performed. Sections were blocked with 5% normal donkey serum and 1% bovine serum albumin in PBS, after which they were incubated in primary antibodies overnight at 4°C, and then for two hours at room temperature with secondary antibodies. For immunohistochemistry, antibodies were visualized using a DAB peroxidase substrate, and tissue was counterstained with eosin. BrdU immunostaining was performed as previously described [85].
β-cell mass and proliferation measurements
0.8 mg/ml bromo-deoxyuridine (BrdU) (Sigma-Aldrich) was administered via drinking water in a light-tight bottle, replaced every 4th day, for two weeks before mouse sacrifice. Entire pancreata were weighed and fixed flat longitudinally overnight in 4% PFA and embedded in paraffin, then sectioned at 5 μm. For β-cell mass measurements, seven to ten slides approximately 250 μm apart were immunostained for insulin, then scanned at 5X using a Nikon Supercool Scan 9000 slide scanner (Melville, NY, USA). Images were analyzed using MetaMorph software (Molecular Devices, Sunnyvale, CA, USA). The insulin-positive percent area of each pancreas was calculated and multiplied by pancreas weight to obtain β-cell mass.
For β-cell proliferation measurements, two to three slides approximately 750 μm apart were immunostained for insulin and either BrdU or Ki67. At least 2500 cells were counted per animal. Images were captured at 400X using an Olympus BX41 microscope with a digital camera using Magnafire software (Optronics, Goleta, California), and cells were counted using MetaMorph. Percent proliferating β-cells was calculated by dividing the number of insulin/BrdU or insulin/Ki67 double-positive cells by the total number of insulin-positive cells.
Quantitative reverse transcriptase PCR
Islet RNA was isolated and qRT-PCR was performed as previously described [85].
Statistical analysis
Data was analyzed using unpaired t-test or two-way ANOVA with Bonferonni’s posttests, as appropriate, using either Microsoft Excel 2004 or GraphPAD Prism 5.01. p-values <0.05 were considered significant.
RESULTS
To determine if Foxm1 is upregulated in islets in response to HFD, four-week old male C57Bl/6J mice were placed on HFD. After eight weeks on HFD, islets were collected; gene expression was examined using quantitative RT-PCR (qPCR). Preliminary data suggest that Foxm1 and two FoxM1 target genes, Plk-1 and Aurora-B kinase, are upregulated in islets from HFD-fed mice (Fig. 3). We next examined whether FoxM1 is required for β-cell proliferation and β-cell mass expansion in response to HFD. Since male but not female Foxm1flox/flox;Pdx1-Cre mice are already diabetic without additional β-cell stress, we analyzed C57Bl/6Jx129SvJxDBA Foxm1flox/flox;Pdx1-Cre females placed on HFD at four weeks of age.
Fig. 3.

qRT-PCR on isolated islets suggests that Foxm1 and target genes Polo-like kinase and Aurora B kinase are upregulated in islets of male C57Bl/6J mice on HFD for 8 weeks (n=1–2).
No difference in weight was observed between controls and mutants fed chow diet, or between controls and mutants fed HFD. Controls and mutants both gained more weight on HFD than on chow diet (Fig. 4A). Consistent with previous studies, at four weeks of age, before initiation of HFD, no difference was observed in glucose tolerance between controls and Foxm1 mutants on HFD (data not shown). By eight weeks of age, both controls and mutants displayed glucose intolerance, which was more severe in Foxm1 mutants (Fig. 4B). However, by twelve weeks of age, the difference between controls and mutants was no longer apparent (data not shown). To determine if the initial difference observed was due to an inability of Foxm1 mutant β-cells to proliferate, β-cell mass and BrdU incorporation was examined. β-cell mass was reduced by approximately 40% in Foxm1 mutant females on chow diet or on HFD compared to littermate controls, although this difference was not significant for mice on chow diet (Fig. 4C). β-cell mass did not, however, significantly increase in either control or mutant mice on HFD compared to animals of the same genotype fed chow, although the control mice on HFD trended higher than control mice on chow. Despite a lack of change in β-cell mass, β-cell BrdU incorporation was significantly reduced in HFD-fed mutants compared to HFD-fed controls (Fig. 4D).
Fig. 4.

Effects of HFD on C57/Bl6x129SvJxCBA Pdx1-Cre;Foxm1flox/flox female mice or controls. A) Both controls and mutants gain significantly more weight on HFD than on chow by sixteen weeks of age, but exhibit no differences compared to each other whether on chow diet or HFD (n=10–12). B) At eight weeks of age, both controls and mutants on HFD exhibited glucose intolerance compared to animals of the same genotype (n=10–12). Glucose intolerance in Foxm1 mutants was more severe than in controls. C) At sixteen weeks of age, Foxm1 mutants on chow diet exhibited β-cell mass approximately 60% of control mice on chow. At this timepoint, no increase in β-cell mass was observed in either controls or Foxm1 mutants on HFD compared to animals of the same genotype on chow (p=0.051; n=5–6). D) β-cell proliferation was significantly reduced in Foxm1 mutants compared to controls on HFD (n=5–6; *p<0.001, **p<0.01, ***p<0.005 Chow vs HFD; §p<0.05, §§p<0.01, Foxm1 mutant vs control).
Because the exacerbated glucose intolerance in Foxm1 mutant females observed at eight weeks of age improved subsequently, Foxm1flox/flox;Pdx1-Cre mice were backcrossed onto a C57Bl/6J background, since these mice are more susceptible to metabolic stress. Intraperitoneal glucose tolerance tests (IPGTTs) were performed at four, eight, and twelve weeks of age (Fig. 5). No difference was observed between control and mutants before HFD, but by eight weeks of age, Foxm1 mutants again displayed more severe glucose intolerance than controls, which again was no longer significant by twelve weeks of age.
Fig. 5.

Intraperitoneal glucose tolerance tests for C57Bl/6J Pdx1-Cre;Foxm1flox/flox or control female mice fed HFD. IPGTT at four (A), eight (B), or twelve (C) weeks of age. (D) At eight weeks of age, both controls and mutants on HFD exhibited glucose intolerance compared to animals of the same genotype on chow diet at eight weeks of age during the entire course of the IPGTT, as measured by area under the curve (AUC, p=0.004), but not at twelve weeks of age (p=0.10; n=3).
β-cell mass and proliferation were analyzed in these mice at twelve weeks of age, and consistent with the lack of metabolic phenotype at this age, no differences were observed in β-cell mass between controls and Foxm1 mutants on HFD (Fig. 6A). β-cell proliferation was analyzed using co-immunostaining for Ki67 and insulin; no significant difference was observed between controls and mutant in the percentage of replicating β-cells.
Fig. 6.
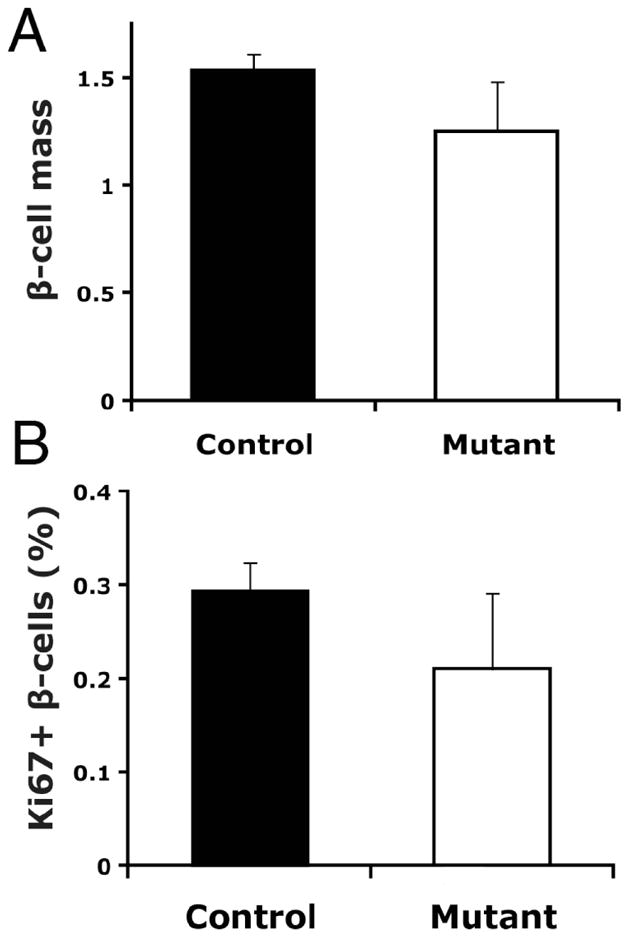
β-cell mass and proliferation in C57Bl/6J Foxm1 mutant and control female mice on HFD. A) β-cell mass was not significantly reduced in Foxm1 mutants at twelve weeks of age (p=0.11). B) The percentage of β-cells positive for the proliferation marker Ki67 was not significantly different between Foxm1 controls and mutants at twelve weeks of age (n=3).
DISCUSSION
Recent genome-wide association screens have identified several SNPs that contribute to susceptibility to Type 2 diabetes, some of which are near cell proliferation and cell cycle control genes. Thus, differences in the ability of mature adult β-cells to reenter the cell cycle in the setting of peripheral insulin resistance likely contribute to the etiology of Type 2 diabetes. Multiple second messenger signaling pathways have been shown to induce β-cell replication in rodent islets. For example, PPx induces IRS2 and Akt phosphorylation in β-cells [96], and both pregnancy and obesity, with their associated insulin resistance, induce β-cell replication through activation of the PI3K/Akt pathway and the Ras/MAPK pathway [35, 36, 39, 40, 97–99]. Our laboratory has demonstrated that FoxM1 is required for β-cell mass expansion during normal postnatal growth, pregnancy, and after PPx, suggesting that FoxM1 is a downstream target of multiple stimulatory pathways. We thus proposed that, regardless of the stimulus, mature β-cell replication ultimately requires FoxM1 activity. We therefore investigated whether β-cell proliferation in response to HFD is dependent on FoxM1 and whether FoxM1 is essential for β-cell mass expansion resulting from obesity.
In this study, consistent with our previously published results, Pdx1-Cre;Foxm1flox/flox females on a mixed genetic background displayed reduced β-cell mass compared to controls, which was true on both regular chow or HFD. However, despite an increase in Foxm1 expression and upregulation of known FoxM1 target genes in response to HFD treatment, no difference in β-cell proliferation or β-cell mass was observed between HFD-fed control and Pdx1-Cre;Foxm1flox/flox females when fully backcrossed onto the susceptible C57Bl/6J strain, and no larger difference in β-cell mass was noted between chow-fed and HFD-fed females on a mixed background, although there was a larger difference in β-cell proliferation in HFD-fed females on the mixed background. Longer HFD treatment may therefore be required to reveal a role for FoxM1 in β-cell mass expansion in response to this stimulus. Alternatively, FoxM1 may not function downstream of diet induced obesity to mediate β-cell mass expansion, and additional pathways may exist that operate independently of FoxM1 resulting in the same endpoint of increased β-cell replication in response to this particular stimulus. These compensatory pathways may be similar to those in the embryo, which does not require FoxM1 for β-cell proliferation or β-cell mass expansion.
Despite minor or no changes in β-cell mass and proliferation, Foxm1 mutant females exhibited more severely impaired glucose tolerance compared with controls after four weeks on HFD, implying that FoxM1 may indirectly or directly regulate genes involved in β-cell function. Because exacerbated glucose intolerance was observed in Foxm1 mutants compared to controls at eight weeks but not twelve weeks of age, future studies will examine β-cell mass prior to eight weeks of age. In addition, islet perifusion studies will be performed to determine whether FoxM1 is involved in the regulation of β-cell function. Taken together, our results demonstrate that FoxM1 is a critical transcription factor in the β-cell for replication and/or function. Additionally, the Attie laboratory recently compared islet gene expression from Lepob/ob diabetes-resistant and diabetes-susceptible strains of mice, revealing increased Foxm1 expression in the diabetes resistant strain as well as in obese humans [100] (and personal communication Dr. Dawn Davis) suggesting that alterations in Foxm1 expression and/or activity could contribute to diabetes susceptibility in humans as well.
Acknowledgments
We would like to thank the members of the Gannon lab for helpful discussions throughout the course of this work. Islets were isolated with the help of Anastasia Golovin of the Vanderbilt Islet Procurement and Analysis Core (DRTC P60 DK20593). RNA quality was assessed by the Vanderbilt Microarray Shared Resource, supported by the Vanderbilt Ingram Cancer Center (P30 CA68485), the Vanderbilt Digestive Disease Center (P30 DK58404), and the Vanderbilt Vision Center (P30 EY08126). M.L.G. was funded by the Integrated Biological Systems Training in Oncology training grant 5T32 CA119925. M.G. was supported by NIH/NIDDK (RO1 DK071052). P60.
Footnotes
This is an open access article licensed under the terms of the Creative Commons Attribution Non-Commercial License (http://creativecommons.org/licenses/by-nc/3.0/) which permits unrestricted, non-commercial use, distribution and reproduction in any medium, provided the work is properly cited.
References
- 1.Everson SA, Goldberg DE, Helmrich SP, et al. Weight gain and the risk of developing insulin resistance syndrome. Diabetes Care. 1998;21(10):1637–43. doi: 10.2337/diacare.21.10.1637. [DOI] [PubMed] [Google Scholar]
- 2.Williamson DF. Descriptive epidemiology of body weight and weight change in U.S. adults. Ann Intern Med. 1993;1:119, 646–9. doi: 10.7326/0003-4819-119-7_part_2-199310011-00004. [DOI] [PubMed] [Google Scholar]
- 3.Lewis CE, Jacobs DR, Jr, McCreath H, et al. Weight gain continues in the 1990s: 10-year trends in weight and overweight from the CARDIA study. Coronary Artery Risk Development in Young Adults. Am J Epidemiol. 2000;151(12):1172–81. doi: 10.1093/oxfordjournals.aje.a010167. [DOI] [PubMed] [Google Scholar]
- 4.Sun XJ, Rothenberg P, Kahn CR, et al. Structure of the insulin receptor substrate IRS-1 defines a unique signal transduction protein. Nature. 1991;352(6330):73–7. doi: 10.1038/352073a0. [DOI] [PubMed] [Google Scholar]
- 5.White MF, Maron R, Kahn CR. Insulin rapidly stimulates tyrosine phosphorylation of a Mr-185,000 protein in intact cells. Nature. 1985;318(6042):183–6. doi: 10.1038/318183a0. [DOI] [PubMed] [Google Scholar]
- 6.Backer JM, Myers MG, Jr, Shoelson SE, et al. Phosphatidylinositol 3′-kinase is activated by association with IRS-1 during insulin stimulation. EMBO J. 1992;11(9):3469–79. doi: 10.1002/j.1460-2075.1992.tb05426.x. [DOI] [PMC free article] [PubMed] [Google Scholar]
- 7.Auger KR, Serunian LA, Soltoff SP, Libby P, Cantley LC. PDGF-dependent tyrosine phosphorylation stimulates production of novel polyphosphoinositides in intact cells. Cell. 1989;57(1):167–75. doi: 10.1016/0092-8674(89)90182-7. [DOI] [PubMed] [Google Scholar]
- 8.Paez-Espinosa V, Carvalho CR, Alvarez-Rojas F, et al. Insulin induces tyrosine phosphorylation of Shc and stimulates Shc/GRB2 association in insulin-sensitive tissues of the intact rat. Endocrine. 1998;8(2):193–200. doi: 10.1385/ENDO:8:2:193. [DOI] [PubMed] [Google Scholar]
- 9.Nadeau KJ, Leitner JW, Gurerich I, Draznin B. Insulin regulation of sterol regulatory element-binding protein-1 expression in L-6 muscle cells and 3T3 L1 adipocytes. J Biol Chem. 2004;279:34380–7. doi: 10.1074/jbc.M403596200. [DOI] [PubMed] [Google Scholar]
- 10.Kim JB, Spiegelman BM. ADD1/SREBP1 promotes adipocyte differentiation and gene expression linked to fatty acid metabolism. Genes Dev. 1996;10:1096–107. doi: 10.1101/gad.10.9.1096. [DOI] [PubMed] [Google Scholar]
- 11.Kim JB, Sarraf P, Wright M, et al. Nutritional and insulin regulation of fatty acid synthetase and leptin gene expression through ADD1/SREBP1. J Clin Invest. 1998 Jan 1;101(1):1–9. doi: 10.1172/JCI1411. [DOI] [PMC free article] [PubMed] [Google Scholar]
- 12.Boizard M, Le Liepvre X, Lemarchand P, Foufelle F, Ferre P, Dugail I. Obesity-related overexpression of fatty-acid synthase gene in adipose tissue involves sterol regulatory element-binding protein transcription factors. J Biol Chem. 1998;273(44):29164–71. doi: 10.1074/jbc.273.44.29164. [DOI] [PubMed] [Google Scholar]
- 13.Belfrage P, Jergil B, Stralfors P, Tornqvist H. Hormone-sensitive lipase of rat adipose tissue: identification and some properties of the enzyme protein. FEBS Lett. 1977;75(1):259–64. doi: 10.1016/0014-5793(77)80099-9. [DOI] [PubMed] [Google Scholar]
- 14.Tsuji Y, Kaburagi Y, Terauchi Y, et al. Subcellular localization of insulin receptor substrate family proteins associated with phosphatidylinositol 3-kinase activity and alterations in lipolysis in primary mouse adipocytes from IRS-1 null mice. Diabetes. 2001;50(6):1455–63. doi: 10.2337/diabetes.50.6.1455. [DOI] [PubMed] [Google Scholar]
- 15.Rizack MA. An Epinephrine-sensitive Lipolytic Activity in Adipose Tissue. The Journal of Biological Chemistry. 1961;1961:657–62. [PubMed] [Google Scholar]
- 16.Boden G. Obesity and free fatty acids. Endocrinol Metab Clin North Am. 2008;37(3):635–46. viii–ix. doi: 10.1016/j.ecl.2008.06.007. [DOI] [PMC free article] [PubMed] [Google Scholar]
- 17.Cusi K, Maezono K, Osman A, et al. Insulin resistance differentially affects the PI 3-kinase- and MAP kinase-mediated signaling in human muscle. J Clin Invest. 2000;105(3):311–20. doi: 10.1172/JCI7535. [DOI] [PMC free article] [PubMed] [Google Scholar]
- 18.Evans JL, Goldfine ID, Maddux BA, Grodsky GM. Are oxidative stress-activated signaling pathways mediators of insulin resistance and beta-cell dysfunction? Diabetes. 2003;52(1):1–8. doi: 10.2337/diabetes.52.1.1. [DOI] [PubMed] [Google Scholar]
- 19.Schinner S, Scherbaum WA, Bornstein SR, Barthel A. Molecular mechanisms of insulin resistance. Diabet Med. 2005;22(6):674–82. doi: 10.1111/j.1464-5491.2005.01566.x. [DOI] [PubMed] [Google Scholar]
- 20.Kubota N, Terauchi Y, Yamauchi T, et al. Disruption of adiponectin causes insulin resistance and neointimal formation. J Biol Chem. 2002;277(29):25863–6. doi: 10.1074/jbc.C200251200. [DOI] [PubMed] [Google Scholar]
- 21.Maeda N, Shimomura I, Kishida K, et al. Diet-induced insulin resistance in mice lacking adiponectin/ACRP30. Nat Med. 2002;8(7):731–7. doi: 10.1038/nm724. [DOI] [PubMed] [Google Scholar]
- 22.Arita Y, Kihara S, Ouchi N, et al. Paradoxical decrease of an adipose-specific protein, adiponectin, in obesity. Biochem Biophys Res Commun. 1999;257(1):79–83. doi: 10.1006/bbrc.1999.0255. [DOI] [PubMed] [Google Scholar]
- 23.Seo JB, Moon HM, Noh MJ, et al. Adipocyte determination- and differentiation-dependent factor 1/sterol regulatory element-binding protein 1c regulates mouse adiponectin expression. J Biol Chem. 2004;279(21):22108–17. doi: 10.1074/jbc.M400238200. [DOI] [PubMed] [Google Scholar]
- 24.Alessi DR. Discovery of PDK1, one of the missing links in insulin signal transduction. Colworth Medal Lecture. Biochem Soc Trans. 2001;29(Pt 2):1–14. doi: 10.1042/0300-5127:0290001. [DOI] [PubMed] [Google Scholar]
- 25.Tremblay F, Lavigne C, Jacques H, Marette A. Defective insulin-induced GLUT4 translocation in skeletal muscle of high fat-fed rats is associated with alterations in both Akt/protein kinase B and atypical protein kinase C (zeta/lambda) activities. Diabetes. 200;50(8):1901–10. doi: 10.2337/diabetes.50.8.1901. [DOI] [PubMed] [Google Scholar]
- 26.Brunet A, Bonni A, Zigmond MJ, et al. Akt promotes cell survival by phosphorylating and inhibiting a Forkhead transcription factor. Cell. 1999;96(6):857–68. doi: 10.1016/s0092-8674(00)80595-4. [DOI] [PubMed] [Google Scholar]
- 27.Paradis S, Ruvkun G. Caenorhabditis elegans Akt/PKB transduces insulin receptor-like signals from AGE-1 PI3 kinase to the DAF-16 transcription factor. Genes Dev. 1998;12(16):2488–98. doi: 10.1101/gad.12.16.2488. [DOI] [PMC free article] [PubMed] [Google Scholar]
- 28.Nakae J, Kitamura T, Silver DL, Accili D. The forkhead transcription factor Foxo1 (Fkhr) confers insulin sensitivity onto glucose-6-phosphatase expression. J Clin Invest. 2001;108(9):1359–67. doi: 10.1172/JCI12876. [DOI] [PMC free article] [PubMed] [Google Scholar]
- 29.Altomonte J, Richter A, Harbaran S, et al. Inhibition of Foxo1 function is associated with improved fasting glycemia in diabetic mice. Am J Physiol Endocrinol Metab. 2003;285(4):E718–28. doi: 10.1152/ajpendo.00156.2003. [DOI] [PubMed] [Google Scholar]
- 30.Du X, Kristiana I, Wong J, Brown AJ. Involvement of Akt in ER-to-Golgi transport of SCAP/SREBP: a link between a key cell proliferative pathway and membrane synthesis. Mol Biol Cell. 2006;17(6):2735–45. doi: 10.1091/mbc.E05-11-1094. [DOI] [PMC free article] [PubMed] [Google Scholar]
- 31.Yellaturu CR, Deng X, Cagen LM, et al. Insulin enhances post-translational processing of nascent SREBP-1c by promoting its phosphorylation and association with COPII vesicles. J Biol Chem. 2009;284(12):7518–32. doi: 10.1074/jbc.M805746200. [DOI] [PMC free article] [PubMed] [Google Scholar]
- 32.Matsumoto M, Ogawa W, Akimoto K, et al. PKC-lambda in liver mediates insulin-induced SREBP-1c expression and determines both hepatic lipid content and overall insulin sensitivity. J Clin Invest. 2003;112(6):935–44. doi: 10.1172/JCI18816. [DOI] [PMC free article] [PubMed] [Google Scholar]
- 33.Sajan MP, Standaert ML, Rivas J, et al. Role of atypical protein kinase C in activation of sterol regulatory element binding protein-1c and nuclear factor kappa B (NFkappaB) in liver of rodents used as a model of diabetes, and relationships to hyperlipidaemia and insulin resistance. Diabetologia. 2009;52(6):1197–207. doi: 10.1007/s00125-009-1336-5. [DOI] [PMC free article] [PubMed] [Google Scholar]
- 34.Sachdeva MM, Stoffers DA. Minireview: Meeting the demand for insulin: molecular mechanisms of adaptive postnatal beta-cell mass expansion. Mol Endocrinol. 2009 Jun;23(6):747–58. doi: 10.1210/me.2008-0400. [DOI] [PMC free article] [PubMed] [Google Scholar]
- 35.Okada T, Liew CW, Hu J, et al. Insulin receptors in beta-cells are critical for islet compensatory growth response to insulin resistance. Proc Natl Acad Sci U S A. 2007;104(21):8977–82. doi: 10.1073/pnas.0608703104. [DOI] [PMC free article] [PubMed] [Google Scholar]
- 36.Kandel ES, Hay N. The regulation and activities of the multifunctional serine/threonine kinase Akt/PKB. Exp Cell Res. 1999;253(1):210–29. doi: 10.1006/excr.1999.4690. [DOI] [PubMed] [Google Scholar]
- 37.Fatrai S, Elghazi L, Balcazar N, et al. Akt induces beta-cell proliferation by regulating cyclin D1, cyclin D2, and p21 levels and cyclin-dependent kinase-4 activity. Diabetes. 2006;55(2):318–25. doi: 10.2337/diabetes.55.02.06.db05-0757. [DOI] [PubMed] [Google Scholar]
- 38.Wrede CE, Dickson LM, Lingohr MK, Briaud I, Rhodes CJ. Protein kinase B/Akt prevents fatty acid-induced apoptosis in pancreatic beta-cells (INS-1) J Biol Chem. 2002;277(51):49676–84. doi: 10.1074/jbc.M208756200. [DOI] [PubMed] [Google Scholar]
- 39.Skolnik EY, Lee CH, Batzer A, et al. The SH2/SH3 domain-containing protein GRB2 interacts with tyrosine-phosphorylated IRS1 and Shc: implications for insulin control of ras signalling. EMBO J. 1993;12(5):1929–36. doi: 10.1002/j.1460-2075.1993.tb05842.x. [DOI] [PMC free article] [PubMed] [Google Scholar]
- 40.Skolnik EY, Batzer A, Li N, et al. The function of GRB2 in linking the insulin receptor to Ras signaling pathways. Science. 1993;260(5116):1953–5. doi: 10.1126/science.8316835. [DOI] [PubMed] [Google Scholar]
- 41.Kefas BA, Heimberg H, Vaulont S, et al. AICA-riboside induces apoptosis of pancreatic beta cells through stimulation of AMP-activated protein kinase. Diabetologia. 2003;46(2):250–4. doi: 10.1007/s00125-002-1030-3. [DOI] [PubMed] [Google Scholar]
- 42.Bonner-Weir S, Deery D, Leahy JL, Weir GC. Compensatory growth of pancreatic beta-cells in adult rats after short-term glucose infusion. Diabetes. 1989 Jan;38(1):49–53. doi: 10.2337/diab.38.1.49. [DOI] [PubMed] [Google Scholar]
- 43.Topp BG, McArthur MD, Finegood DT. Metabolic adaptations to chronic glucose infusion in rats. Diabetologia. 2004;47(9):1602–10. doi: 10.1007/s00125-004-1493-5. [DOI] [PubMed] [Google Scholar]
- 44.Terauchi Y, Takamoto I, Kubota N, et al. Glucokinase and IRS-2 are required for compensatory beta cell hyperplasia in response to high-fat diet-induced insulin resistance. J Clin Invest. 2007;117(1):246–57. doi: 10.1172/JCI17645. [DOI] [PMC free article] [PubMed] [Google Scholar]
- 45.Duvillie B, Cordonnier N, Deltour L, et al. Phenotypic alterations in insulin-deficient mutant mice. Proc Natl Acad Sci U S A. 1997;94(10):5137–40. doi: 10.1073/pnas.94.10.5137. [DOI] [PMC free article] [PubMed] [Google Scholar]
- 46.Duvillie B, Currie C, Chrones T, et al. Increased islet cell proliferation, decreased apoptosis, and greater vascularization leading to beta-cell hyperplasia in mutant mice lacking insulin. Endocrinology. 2002;143(4):1530–7. doi: 10.1210/endo.143.4.8753. [DOI] [PubMed] [Google Scholar]
- 47.Zeggini E, Scott LJ, Saxena R, et al. Meta-analysis of genome-wide association data and large-scale replication identifies additional susceptibility loci for type 2 diabetes. Nat Genet. 2008;40(5):638–45. doi: 10.1038/ng.120. [DOI] [PMC free article] [PubMed] [Google Scholar]
- 48.Zeggini E, Weedon MN, Lindgren CM, et al. Replication of genome-wide association signals in UK samples reveals risk loci for type 2 diabetes. Science. 2007;316(5829):1336–41. doi: 10.1126/science.1142364. [DOI] [PMC free article] [PubMed] [Google Scholar]
- 49.Scott LJ, Mohlke KL, Bonnycastle LL, et al. A genome-wide association study of type 2 diabetes in Finns detects multiple susceptibility variants. Science. 2007;316(5829):1341–5. doi: 10.1126/science.1142382. [DOI] [PMC free article] [PubMed] [Google Scholar]
- 50.Lauenborg J, Grarup N, Damm P, et al. Common type 2 diabetes risk gene variants associate with gestational diabetes. J Clin Endocrinol Metab. 2009;94(1):145–50. doi: 10.1210/jc.2008-1336. [DOI] [PubMed] [Google Scholar]
- 51.Rane SG, Dubus P, Mettus RV, et al. Loss of Cdk4 expression causes insulin-deficient diabetes and Cdk4 activation results in beta-islet cell hyperplasia. Nat Genet. 1999;22(1):44–52. doi: 10.1038/8751. [DOI] [PubMed] [Google Scholar]
- 52.Krishnamurthy J, Ramsey MR, Ligon KL, et al. p16INK4a induces an age-dependent decline in islet regenerative potential. Nature. 2006;443(7110):453–7. doi: 10.1038/nature05092. [DOI] [PubMed] [Google Scholar]
- 53.Georgia S, Bhushan A. p27 Regulates the transition of beta-cells from quiescence to proliferation. Diabetes. 2006;55(11):2950–6. doi: 10.2337/db06-0249. [DOI] [PubMed] [Google Scholar]
- 54.Ferrannini E, Camastra S, Gastaldelli A, et al. beta-cell function in obesity: effects of weight loss. Diabetes. 2004;3:S26–33. doi: 10.2337/diabetes.53.suppl_3.s26. [DOI] [PubMed] [Google Scholar]
- 55.Kloppel G, Lohr M, Habich K, Oberholzer M, Heitz PU. Islet pathology and the pathogenesis of type 1 and type 2 diabetes mellitus revisited. Surv Synth Pathol Res. 1985;4(2):110–25. doi: 10.1159/000156969. [DOI] [PubMed] [Google Scholar]
- 56.Rahier J, Guiot Y, Goebbels RM, Sempoux C, Henquin JC. Pancreatic beta-cell mass in European subjects with type 2 diabetes. Diabetes Obes Metab. 2008;4:32–42. doi: 10.1111/j.1463-1326.2008.00969.x. [DOI] [PubMed] [Google Scholar]
- 57.Butler AE, Janson J, Bonner-Weir S, Ritzel R, Rizza RA, Butler PC. Beta-cell deficit and increased beta-cell apoptosis in humans with type 2 diabetes. Diabetes. 2003 Jan;52(1):102–10. doi: 10.2337/diabetes.52.1.102. [DOI] [PubMed] [Google Scholar]
- 58.Hanley SC, Austin E, Assouline-Thomas B, et al. Beta-Cell Mass Dynamics and Islet Cell Plasticity in Human Type 2 Diabetes. Endocrinology. 2010;151(4):1462–72. doi: 10.1210/en.2009-1277. [DOI] [PubMed] [Google Scholar]
- 59.Breslow MJ, Min-Lee K, Brown DR, Chacko VP, Palmer D, Berkowitz DE. Effect of leptin deficiency on metabolic rate in ob/ob mice. Am J Physiol. 1999;276(3 Pt 1):E443–9. doi: 10.1152/ajpendo.1999.276.3.E443. [DOI] [PubMed] [Google Scholar]
- 60.Coleman DL. Obese and diabetes: two mutant genes causing diabetes-obesity syndromes in mice. Diabetologia. 1978;14(3):141–8. doi: 10.1007/BF00429772. [DOI] [PubMed] [Google Scholar]
- 61.Chua S, Jr, Liu SM, Li Q, Yang L, Thassanapaff VT, Fisher P. Differential beta cell responses to hyperglycaemia and insulin resistance in two novel congenic strains of diabetes (FVB- Lepr (db)) and obese (DBA- Lep (ob)) mice. Diabetologia. 2002;45(7):976–90. doi: 10.1007/s00125-002-0880-z. [DOI] [PubMed] [Google Scholar]
- 62.Wang Q, Brubaker PL. Glucagon-like peptide-1 treatment delays the onset of diabetes in 8 week-old db/db mice. Diabetologia. 2002;45(9):1263–73. doi: 10.1007/s00125-002-0828-3. [DOI] [PubMed] [Google Scholar]
- 63.Phillips MS, Liu Q, Hammond HA, et al. Leptin receptor missense mutation in the fatty Zucker rat. Nat Genet. 1996;13(1):18–9. doi: 10.1038/ng0596-18. [DOI] [PubMed] [Google Scholar]
- 64.Pick A, Clark J, Kubstrup C, et al. Role of apoptosis in failure of beta-cell mass compensation for insulin resistance and beta-cell defects in the male Zucker diabetic fatty rat. Diabetes. 1998;47(3):358–64. doi: 10.2337/diabetes.47.3.358. [DOI] [PubMed] [Google Scholar]
- 65.Winzell MS, Ahren B. The high-fat diet-fed mouse: a model for studying mechanisms and treatment of impaired glucose tolerance and type 2 diabetes. Diabetes. 2004;3:S215–9. doi: 10.2337/diabetes.53.suppl_3.s215. [DOI] [PubMed] [Google Scholar]
- 66.Qiu L, List EO, Kopchick JJ. Differentially expressed proteins in the pancreas of diet-induced diabetic mice. Mol Cell Proteomics. 2005;4(9):1311–8. doi: 10.1074/mcp.M500016-MCP200. [DOI] [PubMed] [Google Scholar]
- 67.Hull RL, Kodama K, Utzschneider KM, Carr DB, Prigeon RL, Kahn SE. Dietary-fat-induced obesity in mice results in beta cell hyperplasia but not increased insulin release: evidence for specificity of impaired beta cell adaptation. Diabetologia. 2005;48(7):1350–8. doi: 10.1007/s00125-005-1772-9. [DOI] [PubMed] [Google Scholar]
- 68.Sone H, Kagawa Y. Pancreatic beta cell senescence contributes to the pathogenesis of type 2 diabetes in high-fat diet-induced diabetic mice. Diabetologia. 2005;48(1):58–67. doi: 10.1007/s00125-004-1605-2. [DOI] [PubMed] [Google Scholar]
- 69.Zhong L, Georgia S, Tschen SI, Nakayama K, Bhushan A. Essential role of Skp2-mediated p27 degradation in growth and adaptive expansion of pancreatic beta cells. J Clin Invest. 2007;117(10):2869–76. doi: 10.1172/JCI32198. [DOI] [PMC free article] [PubMed] [Google Scholar]
- 70.Tschen SI, Dhawan S, Gurlo T, Bhushan A. Age-dependent decline in beta-cell proliferation restricts the capacity of beta-cell regeneration in mice. Diabetes. 2009;58(6):1312–20. doi: 10.2337/db08-1651. [DOI] [PMC free article] [PubMed] [Google Scholar]
- 71.Rankin MM, Kushner JA. Adaptive beta-cell proliferation is severely restricted with advanced age. Diabetes. 2009;58(6):1365–72. doi: 10.2337/db08-1198. [DOI] [PMC free article] [PubMed] [Google Scholar]
- 72.Hinault C, Hu J, Maier BF, Mirmira RG, Kulkarni RN. Differential expression of cell cycle proteins during ageing of pancreatic islet cells. Diabetes Obes Metab. 2008;4:136–46. doi: 10.1111/j.1463-1326.2008.00947.x. [DOI] [PubMed] [Google Scholar]
- 73.Selvin E, Coresh J, Brancati FL. The burden and treatment of diabetes in elderly individuals in the U. S Diabetes Care. 2006;29(11):2415–9. doi: 10.2337/dc06-1058. [DOI] [PubMed] [Google Scholar]
- 74.International Diabetes Federation. Global strategic plan to raise the awareness of diabetes. Brussels: 2003. [Google Scholar]
- 75.Laoukili J, Alvarez M, Meijer LA, et al. Activation of FoxM1 during G2 requires cyclin A/Cdk-dependent relief of autorepression by the FoxM1 N-terminal domain. Mol Cell Biol. 2008;28(9):3076–87. doi: 10.1128/MCB.01710-07. [DOI] [PMC free article] [PubMed] [Google Scholar]
- 76.Wierstra I, Alves J. FOXM1, a typical proliferation-associated transcription factor. Biol Chem. 2007;388(12):1257–74. doi: 10.1515/BC.2007.159. [DOI] [PubMed] [Google Scholar]
- 77.Korver W, Roose J, Clevers H. The winged-helix transcription factor Trident is expressed in cycling cells. Nucleic Acids Res. 1997;25(9):1715–9. doi: 10.1093/nar/25.9.1715. [DOI] [PMC free article] [PubMed] [Google Scholar]
- 78.Korver W, Schilham MW, Moerer P, et al. Uncoupling of S phase and mitosis in cardiomyocytes and hepatocytes lacking the winged-helix transcription factor Trident. Curr Biol. 1998;8(24):1327–30. doi: 10.1016/s0960-9822(07)00563-5. [DOI] [PubMed] [Google Scholar]
- 79.Krupczak-Hollis K, Wang X, Kalinichenko VV, et al. The mouse Forkhead Box m1 transcription factor is essential for hepatoblast mitosis and development of intrahepatic bile ducts and vessels during liver morphogenesis. Dev Biol. 2004;276(1):74–88. doi: 10.1016/j.ydbio.2004.08.022. [DOI] [PubMed] [Google Scholar]
- 80.Wang X, Kiyokawa H, Dennewitz MB, Costa RH. The Forkhead Box m1b transcription factor is essential for hepatocyte DNA replication and mitosis during mouse liver regeneration. Proc Natl Acad Sci U S A. 2002;99(26):16881–6. doi: 10.1073/pnas.252570299. [DOI] [PMC free article] [PubMed] [Google Scholar]
- 81.Kalin TV, Wang IC, Meliton L, et al. Forkhead Box m1 transcription factor is required for perinatal lung function. Proc Natl Acad Sci U S A. 2008 Dec 9;105(49):19330–5. doi: 10.1073/pnas.0806748105. [DOI] [PMC free article] [PubMed] [Google Scholar]
- 82.Ustiyan V, Wang IC, Ren X, et al. Forkhead box M1 transcriptional factor is required for smooth muscle cells during embryonic development of blood vessels and esophagus. Dev Biol. 2009;336(2):266–79. doi: 10.1016/j.ydbio.2009.10.007. [DOI] [PMC free article] [PubMed] [Google Scholar]
- 83.Laoukili J, Stahl M, Medema RH. FoxM1: at the crossroads of ageing and cancer. Biochim Biophys Acta. 2007;1775(1):92–102. doi: 10.1016/j.bbcan.2006.08.006. [DOI] [PubMed] [Google Scholar]
- 84.Zhang H, Ackermann AM, Gusarova GA, et al. The FoxM1 transcription factor is required to maintain pancreatic beta-cell mass. Mol Endocrinol. 2006 Aug;20(8):1853–66. doi: 10.1210/me.2006-0056. [DOI] [PubMed] [Google Scholar]
- 85.Ackermann Misfeldt A, Costa RH, Gannon M. Beta-cell proliferation, but not neogenesis, following 60% partial pancreatectomy is impaired in the absence of FoxM1. Diabetes. 2008;57(11):3069–77. doi: 10.2337/db08-0878. [DOI] [PMC free article] [PubMed] [Google Scholar]
- 86.Zhang H, Zhang J, Pope CF, et al. Gestational diabetes resulting from impaired beta-cell compensation in the absence of FoxM1, a novel downstream effector of placental lactogen. Diabetes. 2010;59(1):143–52. doi: 10.2337/db09-0050. [DOI] [PMC free article] [PubMed] [Google Scholar]
- 87.Gu G, Dubauskaite J, Melton DA. Direct evidence for the pancreatic lineage: NGN3+ cells are islet progenitors and are distinct from duct progenitors. Development. 2002;129(10):2447–57. doi: 10.1242/dev.129.10.2447. [DOI] [PubMed] [Google Scholar]
- 88.Xu X, D’Hoker J, Stange G, et al. Beta cells can be generated from endogenous progenitors in injured adult mouse pancreas. Cell. 2008 Jan 25;132(2):197–207. doi: 10.1016/j.cell.2007.12.015. [DOI] [PubMed] [Google Scholar]
- 89.Ye H, Kelly TF, Samadani U, Lim L, Rubio S, Overdier DG, et al. Hepatocyte nuclear factor 3/fork head homolog 11 is expressed in proliferating epithelial and mesenchymal cells of embryonic and adult tissues. Mol Cell Biol. 1997;17(3):1626–41. doi: 10.1128/mcb.17.3.1626. [DOI] [PMC free article] [PubMed] [Google Scholar]
- 90.Leung TW, Lin SS, Tsang AC, et al. Over-expression of FoxM1 stimulates cyclin B1 expression. FEBS Lett. 2001;507(1):59–66. doi: 10.1016/s0014-5793(01)02915-5. [DOI] [PubMed] [Google Scholar]
- 91.Ma RY, Tong TH, Cheung AM, Tsang AC, Leung WY, Yao KM. Raf/MEK/MAPK signaling stimulates the nuclear translocation and transactivating activity of FOXM1c. J Cell Sci. 2005;118(Pt 4):795–806. doi: 10.1242/jcs.01657. [DOI] [PubMed] [Google Scholar]
- 92.Blanco-Bose WE, Murphy MJ, Ehninger A, et al. C-Myc and its target FoxM1 are critical downstream effectors of constitutive androstane receptor (CAR) mediated direct liver hyperplasia. Hepatology. 2008;48(4):1302–11. doi: 10.1002/hep.22475. [DOI] [PubMed] [Google Scholar]
- 93.Park HJ, Wang Z, Costa RH, Tyner A, Lau LF, Raychaudhuri P. An N-terminal inhibitory domain modulates activity of FoxM1 during cell cycle. Oncogene. 2008 Mar 13;27(12):1696–704. doi: 10.1038/sj.onc.1210814. [DOI] [PMC free article] [PubMed] [Google Scholar]
- 94.Major ML, Lepe R, Costa RH. Forkhead box M1B transcriptional activity requires binding of Cdk-cyclin complexes for phosphorylation-dependent recruitment of p300/CBP coactivators. Mol Cell Biol. 2004;24(7):2649–61. doi: 10.1128/MCB.24.7.2649-2661.2004. [DOI] [PMC free article] [PubMed] [Google Scholar]
- 95.Laoukili J, Alvarez-Fernandez M, Stahl M, Medema RH. FoxM1 is degraded at mitotic exit in a Cdh1-dependent manner. Cell Cycle. 2008;7(17):2720–6. doi: 10.4161/cc.7.17.6580. [DOI] [PubMed] [Google Scholar]
- 96.Jetton TL, Liu YQ, Trotman WE, Nevin PW, Sun XJ, Leahy JL. Enhanced expression of insulin receptor substrate-2 and activation of protein kinase B/Akt in regenerating pancreatic duct epithelium of 60 %-partial pancreatectomy rats. Diabetologia. 2001;44(11):2056–65. doi: 10.1007/s001250100011. [DOI] [PubMed] [Google Scholar]
- 97.Lingohr MK, Buettner R, Rhodes CJ. Pancreatic beta-cell growth and survival--a role in obesity-linked type 2 diabetes? Trends Mol Med. 2002;8(8):375–84. doi: 10.1016/s1471-4914(02)02377-8. [DOI] [PubMed] [Google Scholar]
- 98.Leturque A, Burnol AF, Ferre P, Girard J. Pregnancy-induced insulin resistance in the rat: assessment by glucose clamp technique. Am J Physiol. 1984;246(1 Pt 1):E25–31. doi: 10.1152/ajpendo.1984.246.1.E25. [DOI] [PubMed] [Google Scholar]
- 99.Yen SS. Endocrine regulation of metabolic homeostasis during pregnancy. Clin Obstet Gynecol. 1973;16(3):130–47. doi: 10.1097/00003081-197309000-00009. [DOI] [PubMed] [Google Scholar]
- 100.Keller MP, Choi Y, Wang P, et al. A gene expression network model of type 2 diabetes links cell cycle regulation in islets with diabetes susceptibility. Genome Res. 2008;18(5):706–16. doi: 10.1101/gr.074914.107. [DOI] [PMC free article] [PubMed] [Google Scholar]