Abstract
In this article, we investigate the Surface-Enhanced Raman Scattering (SERS) efficiency of methylene blue (MB) molecules deposited on gold nanostripes which, due to their fabrication by electron beam lithography and thermal evaporation, present various degrees of crystallinity and nanoscale surface roughness (NSR). By comparing gold nanostructures with different degrees of roughness and crystallinity, we show that the NSR has a strong effect on the SERS intensity of MB probe molecules. In particular, the NSR features of the lithographic structures significantly enhance the Raman signal of MB molecules, even when the excitation wavelength lies far from the localized surface plasmon resonance (LSPR) of the stripes. These results are in very good agreement with numerical calculations of the SERS gain obtained using the discrete dipole approximation (DDA). The influence of NSR on the optical near-field response of lithographic structures thus appears crucial since they are widely used in the context of nano-optics or/and molecular sensing.
I. Introduction
The mechanisms at the origin of Surface-Enhanced Raman Scattering (SERS) are now, to a certain extent, rather well established.1,2 After almost twenty years of debate, it is nowadays admitted that the major part of the enhancement arises from the amplification of the electromagnetic (EM) field near a metal surface. This so-called “electromagnetic mechanism” involves the excitation of localized surface plasmon resonances (LSPR) which entails an enhancement of the absorption and scattering cross sections of subwavelength particles occurring in the visible or near-infrared regions for silver and gold metals.
In the SERS enhancement process, the particles may be considered to act as antennæ for the molecules since the particles enhance both the in-coming EM fields and also the out-going Raman shifted radiation. Under some specific conditions, this Raman enhancement factor (EF) can be expressed as EF = |Eloc/E0|4 where E0 is the incident field and Eloc is the local field at the molecule.3 An additional chemical contribution to the enhancement process has also been invoked arising from resonant molecule/metal charge transfer complex.4,5 Recently, A. T. Zayak et al. quantified this contribution for benzenethiol molecule chemisorbed on gold substrates and connected a strong modification of Raman spectra to changes in the electronic structure of the metal-adsorbate interface;6 but if the SERS effect is understood as the cooperative effect of both mechanisms, there is a strong predominance of the electromagnetic mechanism.7
Among the great variety of systems that have been used as SERS substrates, like roughened electrodes,8,9 colloids,10 metal islands films,11 nanospheres lithography,12 or arrays of lithographically designed particles,13−20 the latter appears to be the most suitable to study the influence of localized surface plasmon resonances on the enhancement factor. For example, regular arrays of nearly identical metal nanoparticles obtained by electron beam lithography (EBL) have received considerable attention in the past two decades, mainly for their ability to support very narrow LSPR, and for the ease with which the LSPR wavelength can be tuned (through the change of the particle’s material, size and shape).21 In these structures, the Raman enhancement factor (EF), typically of about 105, is distributed almost equally over all particles.22 Thanks to the improvements in the uniformity of EBL nanoparticle-based SERS substrates, it was possible to verify experimentally the validity of the EM enhancement model in SERS and tackle basic aspects of the SERS effect (optimal spectral position of the LSPR, SERS polarization dependence, ...).23,24
On substrates consisting of particles with a large size and distance distributions (e.g., colloids or metal island films), the EF was found to originate mainly from specific local areas called “hot spots”.25−27 A closer analysis of this kind of substrates revealed that hot spots are located within the gap of aggregates of closely spaced particles.25,28 The strong electromagnetic coupling taking place between such close spaced particles leads to giant inhomogeneous EM fields within the gap.29 These fields are considered to be responsible for the huge SERS effect, with EF of the order of 108 to 109, thus opening the route to single molecule detection by SERS.3,30
Although EBL structures appear to be suitable substrates for fundamental SERS investigations, a crucial aspect has often been overlooked concerning this kind of samples: the fabrication technique (thermal evaporation and the lift off process itself) generates nanometer scale surface roughness (NSR) which is likely to play a role in the optical response of the as-fabricated structures. The poor degree of crystallinity and the surface roughness contrast with the single-crystalline nature of the particles fabricated by chemical synthesis.31 The presence of NSR features can be critical since they may change the near-field distribution of the EM field, which cannot be witnessed by simple far-field measurements.32−34 This aspect has rarely been addressed, though being of key importance in the context of nano-optics or molecular sensing applications.35−37
Colloidal particles displaying irregular surface protrusions have been recently investigated in SERS. It was shown that the rougher the gold particles are, the higher the SERS activity is, demonstrating the important role of NSR on the near-field optical response.38−41 This boost of the SERS signal was assigned to the presence of hot-spots on the particles surface, rather than to an increase of the surface area due to corrugation.42 However, these experiments were performed on colloidal particles in solution or deposited as a single layer on a dielectric substrate;43 and one knows that this kind of SERS-active substrates often leads to particle aggregation with large size distribution and broad plasmon resonances, thus preventing any detailed and systematic approaches for an in-depth analysis of the influence of NSR on SERS.
To our knowledge, this issue has not been investigated in detail on EBL structures, despite its important implications in plasmonics. The purpose of this article is then to study how SERS can be modified by the presence of roughness and/or protrusions located at the surface of lithographically designed structures. Choosing fabricated arrays of gold stripes with subwavelength widths for their optical response is quite simple.44 If the polarization of the incident radiation is set perpendicular to the stripes (i.e., transverse polarization), a localized resonance can be observed in the visible to the near-infrared spectral range, while under longitudinal polarization no localized resonance is excited; no propagating surface plasmon polariton can be launched due to our excitation scheme. Thus, any SERS effect obtained with a longitudinal polarization cannot be assigned to resonant plasmon excitation.
In order to study the influence of NSR on the SERS activity of the particles, the surface roughness and crystallinity parameters were modified through thermal annealing. As the annealing temperature is increased (up to 200 °C in our case), the grain size increases and the surface roughness decreases. The comparison of the experiments carried out on annealed and nonannealed EBL stripes raised four important questions: (i) Is the SERS intensity significantly governed by the NSR located on the particles? (ii) Can we quantitatively estimate the impact of NSR when the excitation wavelength is set within the plasmon resonance of the structures? (iii) Do the NSR features give rise to a SERS activity for an off resonance excitation? (iv) What is the amount of off resonance hot spots enhancement and how does it depend on the incident wavelength?
After a short description of the experimental and numerical techniques, we begin the discussion by describing the optical properties of the different samples investigated in this work. Next we turn to the comparison of the SERS activity of stripes arrays with different NSR and crystallinity parameters. We then move to the impact of NSR on the SERS intensity, by changing the excitation polarization and wavelength. We systematically compared the experimental results to numerical calculations based on the discrete dipole approximation DDA technique.45,46 We finally conclude on the importance of surface roughness of EBL structures in SERS experiments.
II. Experimental Section
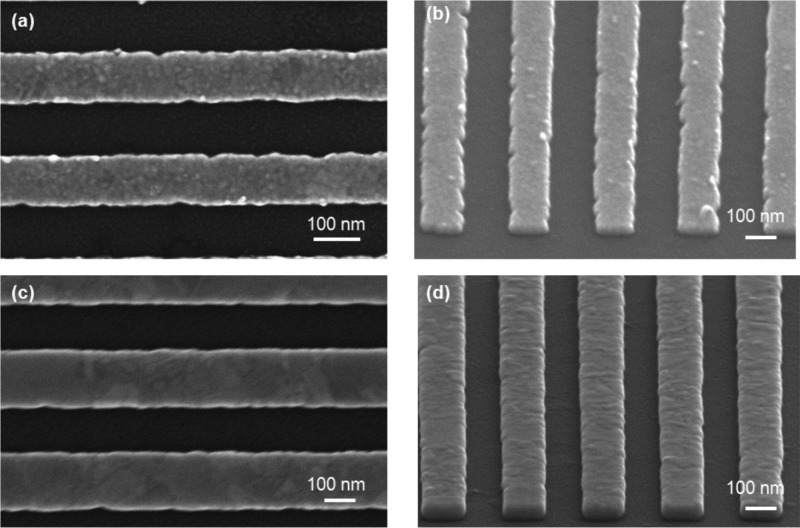
The 100 × 100 μm2 stripe arrays are produced by electron beam lithography through a classical lift-off process. A 90 nm thick layer of PMMA (poly methyl methacrylate) is spin-casted onto a transparent ITO (indium tin oxide) coated glass substrate. After chemical development of the exposed areas, thermal evaporation of gold and the lift-off procedure follow. Typical scanning electron microscope (SEM) images of an array of stripes investigated in this article are depicted in Figure 1. One can notice that the lift-off process is likely to induce rough edged structures. The stripes are 100 μm long, their width was varied in the range of 120 to 250 nm, and their height (40 nm) is kept constant over the different arrays. Typical scanning electron microscope (SEM) images of a stripes array investigated in this work are depicted in Figure 1.
Figure 1.
SEM images of gold nanostripes: (a) and (b) nonannealed and (c) and (d) annealed for 5 min at 200 °C. Characteristics of the stripes shown in these images are as follows: height h = 40 nm, width w = 120 nm, length 100 μm. The SEM images (b) and (d) have been tilted with an angle of 60 degrees, allowing to give an improved perspective of the NSR features.
Electromagnetic coupling between the single stripes could have significant influence on the extinction-spectra47−49 and optical near-fields. This is avoided by selecting a grating constant of 300 nm.49 After fabrication, the stripes clearly show a grainy surface with grain sizes in the range ca. 20–30 nm as a result of the thermal gold deposition process (see Figure 1a and b). As the stripe width is much larger than the grain size, we presume that nanostripes have the same surface roughness parameters regardless of their width. After optional annealing of the samples at 200 °C for 5 min, we observe a clear change in surface morphology, with crystalline grains ranging from ca. 30 to 100 nm (see for instance Figure 1c, d and Figure SI.1), with a RMS of approximately 1.5 nm (estimated from the AFM image of a gold film, Figure SI.2). Note that upon our annealing conditions, the stripes do not present any significant modification of their width.
The LSPR of the samples are probed by far–field extinction microspectroscopy in the range of 500–900 nm. The spectrometer is coupled to an upright optical microscope equipped with a 50× objective (numerical aperture N.A. = 0.35). The investigated area is of approximately 80 μm in diameter, which is smaller than the array dimensions (100 × 100 μm).
To record the SERS spectra, we used a confocal Raman microspectrometer (Labram HR800 Jobin-Yvon) fed with two laser lines, namely 633 and 785 nm. The objective used in this backscattering setup is a ×50 (NA = 0.75). The Raman spectra are recorded in the spectral range of 400–1750 cm–1, with an acquisition time varying from 5 to 30 s.
A ×10–5 M aqueous solution of methylene blue (MB) was used for the SERS measurement. The samples are dipped in this solution for 5 min, rinsed with ethanol, and blow dried with nitrogen. Note that MB molecules are weakly fluorescent, absorbing and emitting at 630 and 670 nm, respectively. So for the 633 nm excitation, a resonant effect with the MB molecules is expected to boost the Raman signal. We maintained the laser power quite low (50 μW) to avoid any photobleaching of MB molecules.
The Discrete Dipole Approximation (DDA) method45 was used to model the far-field extinction spectra and to map the local field yielded by the stripes. This approximation is one of the several discretization methods available for solving Maxwell equations, with given boundary conditions; the electromagnetic response of the nanostripes is represented by that of a cubic array of polarizable point dipoles, called the target. To allow for a quantitative comparison between experiments and calculations, the calculations were performed on targets constituted of smooth (with idealized rectangular cross section) and rough gold stripes. To obtain the target for modeling the rough gold stripes, more than 200 000 random numbers n(yj, zk), ranging from −2.5 to 2.5, were generated giving a RMS value of 2.8. The polarizable point dipoles of the upper stripe surface, which are at a constant x0 value for a smooth stripe, are filled by point dipoles of coordinates less or equal to the constant value x0+n(yj, zk). The random features generated this way mimic the experimental ones imaged by AFM. Computations were performed using the DDSCAT7.0 software,46 which enables us to calculate efficiency factors, Qext = Cext/πaeff, where Cext is the extinction cross section and aeff is the effective radius of the stripe unit cell. The unit cell (110 nm width, 120 nm length, 40 nm height) is reproduced infinitely using periodic boundary conditions. It is also possible to retrieve the electromagnetic near-field of the structures. The interaction between the stripe and the substrate is taken into account in the computation, which makes the comparisons between experimental and calculated extinction spectra more reliable.46 The excitation is set to be a plane wave of the desired wavelength, impinging first the ITO slab (gold stripes) and then gold stripes (ITO slab) to model far-field (SERS) measurements. According to experimental data, the stripe height is set to a mean value of 40 nm.
III. Results and Discussion
We consider two sets of gold nanostripe arrays of varying widths. Both sets are fabricated with identical parameters, but set A is annealed (reduced nanoscale roughness) whereas set B is not. Figure 2a depicts typical extinction spectra of a nonannealed (B1) and an annealed (A1) stripe array with nearly identical transversal plasmon resonances, which both are characterized by a pronounced extinction peak for excitation polarized perpendicular to the stripe axis (see also the Figure SI3 displaying the extinction spectra of all stripe arrays of set B).
Figure 2.
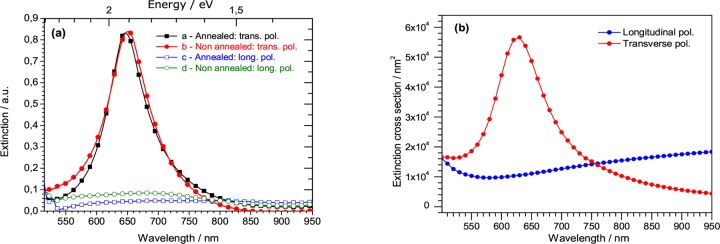
(a) Extinction spectra of the samples A1 and B1 in perpendicular (transverse) and parallel (longitudinal) polarizations; (b) DDA calculation of the extinction cross section of a smooth unit cell reproduced infinitely using periodic boundary conditions (width: 110 nm, length: 120 nm; height: 40 nm), in both polarizations. Note that the extinction cross section is indicated in nm2 per unit cell (length 120 nm).
In contrast, when the electric field is set parallel to the stripes (longitudinal polarization), the extinction spectrum shows the same features as expected for a smooth, thin gold film. The annealing process results in a blue shift of the LSPR wavelength of ca. 20–30 nm, together with a reduction of the full-width at half-maximum of the spectra and a higher extinction, as recently shown by J. C. Tinguely et al.50 Therefore, in order to compare the SERS efficiency on equivalent stripes before and after annealing, pairs of stripes from set A and B must be selected in such a way that the plasmon resonance wavelength and the optical extinction of the array before annealing is nearly identical to those of the other array after the annealing process, which is well fulfilled for array A1 (annealed, width 150 nm) and B1 (not annealed, width 120 nm) (see Figure 2a).
For qualitative comparison, we plot in Figure 2b the DDA-simulated extinction spectrum of a smooth target (width 110 nm; height 40 nm) in transversal and parallel polarizations. In the calculation, the unit cell length of the stripe has been chosen to 110 nm, which allows us to match the LSPR wavelength (located at ca. 640 nm) and the band profile between experiments and DDA computations. This is necessary due to incertainties in the dielectric functions of gold and ITO.
We now turn to the optical near-field properties. The purpose is to show the influence of the NSR features of the EBL samples on the SERS efficiency by comparing measurements on annealed (“smooth”) gold stripes (set A) and nonannealed (“rough”) ones (set B) (details of the geometrical parameters of samples investigated in this work are given in Supporting Information (SI) Table 1). Figure 3 presents typical SERS spectra of MB adsorbed on gold stripes A1 and B1, respectively, for a laser polarization set perpendicular (transverse) and parallel (longitudinal) to the stripes (both plasmon resonances are close to the 633 nm laser line). No Raman signal was observed out of the stripe arrays. The 1618 cm–1 Raman peak used to estimate the SERS intensity is assigned to a C–N stretch. Note that the SERS signal is accompanied by a broad background attributed to the fluorescence (possibly modified by the LSPR) of MB molecules.24
Figure 3.
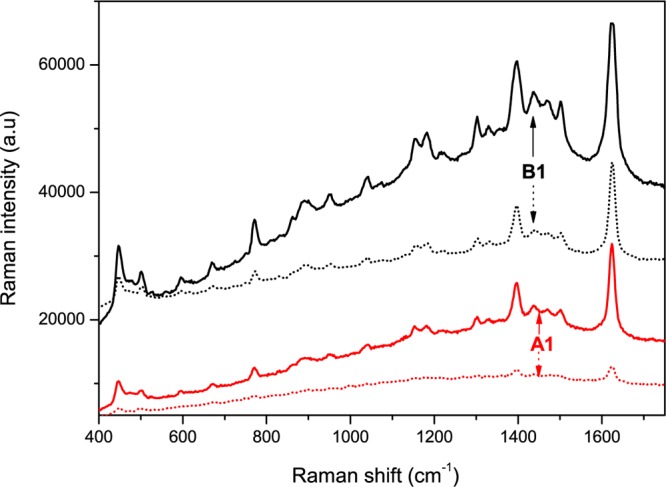
SERS of MB molecules (concentration 10–5 M) on samples A1 (red spectra) and B1 (black spectra) in longitudinal (dot lines) and transverse (solid line) polarizations. Excitation: 633 nm; acquisition time: 5 s; back scattering configuration. Note that the SERS spectra are vertically shifted for more clarity.
Two main observations can be pointed out: (i) in transverse polarization, the SERS signal of MB is more intense on the nonannealed array (B1) than that of the annealed one (A1). The decrease of the SERS signal after the annealing process has been systematically observed for all the samples studied in this work (see the SERS spectra of the different samples in the Figure SI.4). This result is also in agreement with previous results we recently published, using gold circular dots as SERS-substrates.50(ii) When the incident polarization is parallel to the stripes, the MB SERS signal almost disappears on the sample A1 as expected since no LSPR is excited, while a strong unexpected SERS signal appears in the case of the nonannealed sample B1.
In order to confirm and explain these experimental results, we compare them to the optical near-field enhancements calculated at an incident wavelength of 633 nm for a rough and smooth stripe. Figure 4a displays the distribution of the near-field enhancement EF = |Eloc/Einc|4 on a unit cell length of a smooth stripe excited with a transverse polarization.
Figure 4.
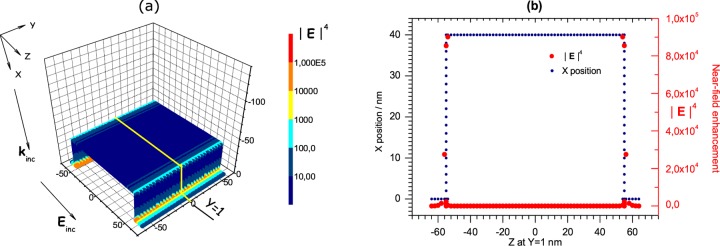
Smooth target: (a) Mapping of the near-field enhancement on a unit cell length of a 110 nm wide stripe; (b) Transverse section profile corresponding to the 3D mapping (a) of the NF enhancement in transverse polarization.
As expected, the three-dimensional mapping of the optical near-field (Figure 4a) shows variations only in the cross-sectional area perpendicular to the stripe and is constant along the stripe length. However, one interesting observation is that the enhancement is mainly located on the side of the stripe at the ITO/gold interface, as previously observed on silver nanocubes using the same illumination conditions.51 A transverse cross section (Figure 4b) allows for the quantification of the enhancement along a line: almost no enhancement on top of the stripe and a maximum value of EF of 9 × 10⁴ at the ITO/stripe interface.
In the case of the rough target, the mapping of the electromagnetic distribution clearly reveals a strong variation over the surface of the stripe (Figures 5a and 5b). Compared to the case of a smooth stripe, the electric field on a rough stripe is significantly enhanced on its top and reduced on its sides. The presence of the NSR indeed gives rise to an near-field enhancement exceeding EF = 2 × 10⁵ for a cross-section located at Z ∼ 10 nm and Y = −1 nm (Figure 5b). So the calculation of the local fields distribution enabled us to (i) understand the higher SERS signals observed for MB molecules on nonannealed samples and (ii) suggest that the enhancement of the Raman scattering is due to both the dipolar LSPR excitation and also the hot-spots created by the NSR features on top of the stripes.
Figure 5.
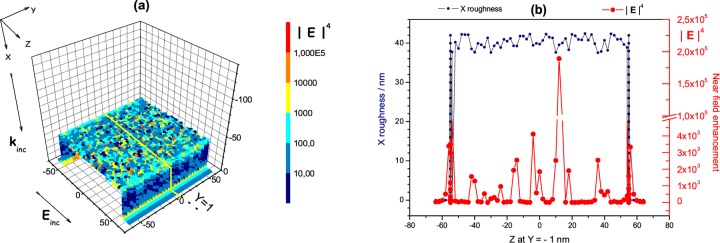
Rough target: (a) Mapping of the near-field enhancement on a unit cell length of a 110 nm wide stripe; (b) Transverse section profile corresponding to the 3D mapping (a) of the NF enhancement in transverse polarization. The dash-dotted line indicates the average height i.e. the height of the smooth surface.
As a direct consequence of the NSR features, the near-field enhancement is no longer expected to follow the extinction spectrum. To highlight this, and taking into account that the SERS intensity reflects the near-field enhancement, we compared the value of the extinction of the different samples at 633 nm (the excitation wavelength) with the integrated intensity of the 1618 cm–1 Raman band of MB molecules (Figure 6). For samples from set A, we observe SERS intensities which are proportional to the excitation strength of the transversal plasmon resonance (red circular dots in Figure 6). For samples from set B, no correlation between the SERS intensity and the extinction values can be spotted, which we attribute to the fact that the near-field enhancement, partially arising from the NSR features, is in this case not fully connected to the dipolar plasmon resonance sustained by the stripe.
Figure 6.
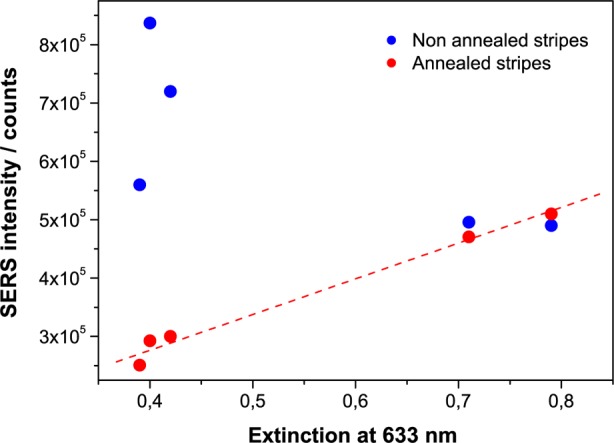
Optical extinction measured at 633 nm for samples of sets A and B (horizontal axis), compared to the SERS integrated intensity (excitation at 633 nm) of the 1618 cm–1 Raman peak of MB molecules (vertical axis). In the case of the annealed samples (set A - red dots), the SERS intensity is proportional to the excitation strength of the transversal plasmon resonance, in contrast with the nonannealed samples (set B - blue dots).
An important feature of the stripes is the strong polarization dependence of the plasmon resonance and related near-field enhancement. In theory, we can only expect some enhancement if the dipolar LSPR is excited. If the polarization is changed from transversal to parallel to the stripes, the near-fields are not enhanced but, contrarily, are reduced due to the absorption of gold. In the case of the annealed stripes A1, a strong decrease of the SERS signal is observed when the incident polarization is set along the stripes length, as expected (Figure 3). Note that the residual SERS signal of MB observed can be assigned to the fact that the stripes A1, after the annealing process, are not perfectly smooth (Figure 1c and d but only show reduced roughness. In contrast, for the stripes B1, the cross-sectional nonuniformities and the larger surface roughness cause greater deviations from the ideal behavior, including 3-dimensional field variations. Although in the absence of LSPR excitation, a significant SERS signal is still observed in longitudinal polarization (Figure 3), in accordance with DDA calculations of the near-field distribution (Figure 7). In the simulations, the enhancements arising from the NSR features under longitudinal polarization remain quite moderate, reaching locally EF = 103.
Figure 7.
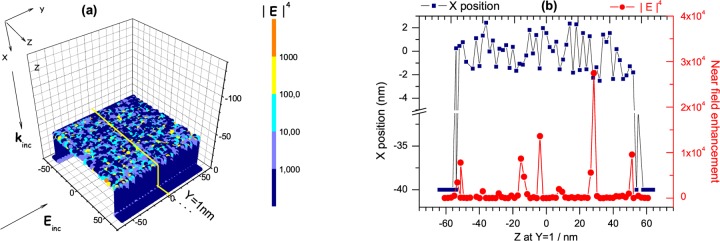
Rough target: (a) Mapping of the near-field enhancement on a unit cell length of a 110 nm wide stripe; (b) Transverse section profile corresponding to the 3D mapping (a) of the NF enhancement in longitudinal polarization. The dash-dotted line indicates the average height, i.e., the height of the smooth surface (please note the linear scale for the field enhancement).
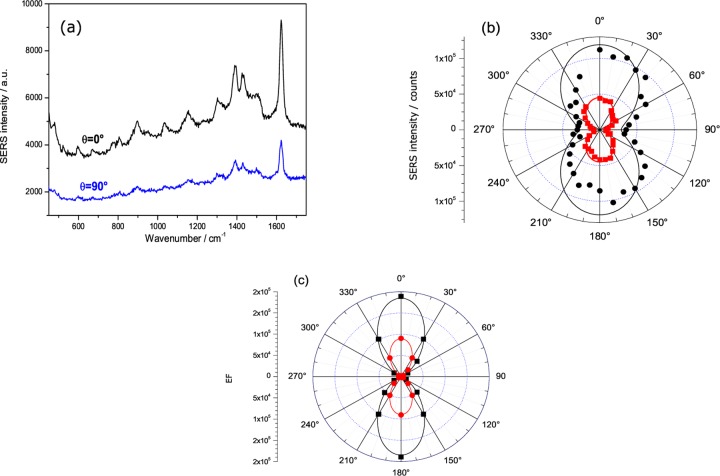
In order to quantify the contribution of the NSR features versus the dipolar LSPR character of the stripes on the SERS effect, we performed SERS measurements at 633 nm, under different polarization angles for samples A1 and B1 (Figure 8). In both cases, the intensity of the SERS spectra strongly varies with the excitation polarization angle θ, as displayed in Figure 8a, showing that SERS is maximum for a polarization perpendicular to the stripes and minimum for a polarization parallel to the stripes. In the case of the annealed sample A1 (Figure 8b), the SERS intensities have been fitted by a cos2θ law: the SERS signal remarkably follows the far-field dipolar LSPR character of the stripes (see also Figure SI.5 displaying the polar graph of the extinction spectrum of the sample). This cos2θ dependence suggests that SERS emission enhancement is independent of the excitation polarization.52−54 In the case of the sample B1, the plot of ISERS(θ) clearly deviates from expectations: the SERS intensity does not follow anymore the cos2θ behavior due to the contribution of nonresonant enhancement from the roughness features. The plot of ISERS(θ) for sample B1 can be compared to the one of an evaporated gold film, for which the SERS signal of MB molecules originates solely from the NSR features (generated by the thermal evaporation process), and is independent of the incident angle of polarization (see Figure SI.2).
Figure 8.
(a): SERS signal of MB molecules on stripes B1 at λexc = 633 nm, for two incident angles of θ = 0 degree (transverse polarization) and θ = 90 degrees (longitudinal polarization); (b): Polar graph of the SERS intensity of MB molecules: for sample A1 (red dots), the data are fitted with a cos2θ curve. In the case of sample B1 (black dots), the SERS intensity deviates from the cos2θ law. The experimental data are fitted by the function I(θ) = 9 × 10⁴ cos2θ + 2.9105; (c) Calculation of the optical near-field enhancement EF(θ) on a smooth (red circular dots) and a roughened target (black square), using the DDA method.
The SERS intensities ISERS(θ) have been compared with the calculation of the optical near-field enhancement EF(θ) on a smooth and a roughened target, using the DDA method (Figure 8c). Both polar calculated curves show a cos4 θ dependence, instead of a cos2 θ dependence for the experimental data. This cos4 θ dependence is explained by the fact that, in the calculations, we assume, for the sake of simplicity, a |E|4 enhancement.55 Nevertheless, the polarization dependence of the calculated electromagnetic enhancement is in qualitative agreement with the experimental SERS intensities. The calculated enhancement factor EF is systematically lower for the ideal stripe compared to the roughened target, whatever the incident angle of polarization is (the field enhancement EF cos4θ, for the roughened target, does not fall to zero – the minimum is ca. 3 × 10³ for θ = 90 degrees).
This first set of SERS and extinction experiments clearly indicates that important deviations are observed between the far-field and the near-field response in the case of the nonannealed rough nanostripes of set B. This is in accordance with recent observations on colloidal SERS substrates.56 Strong SERS enhancement was observed from gold aggregates, at excitation wavelengths far from the LSPR, with a maximum of enhancement observed in the red part of the visible range, in contrast to the plasmon band peaking in the blue spectral range. Assuming that, in the present case, the SERS signal of MB partially originates from hot-spots due to surface roughness on top of the stripes, the SERS intensity should show little dependence on the far-field LSP resonance according to the observations on gold nanoparticle aggregates.
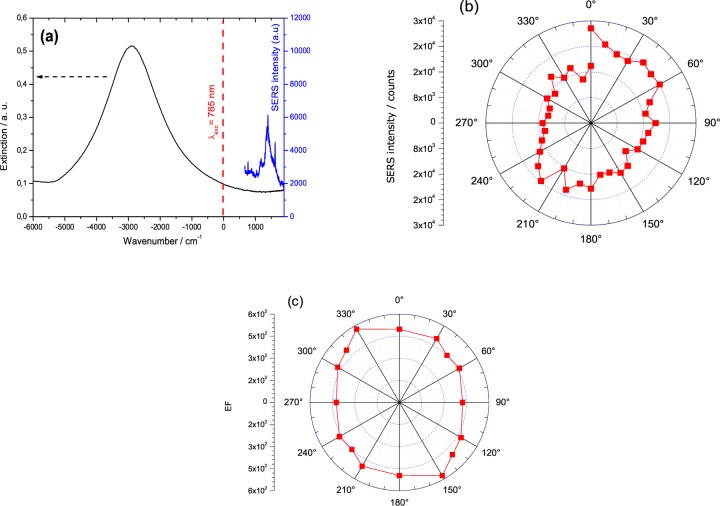
In order to validate this assumption and analyze the influence of the excitation wavelength on the optical near-field enhancement, we performed SERS experiments on samples A1 and B1 using a 785 nm laser line as excitation source, which is far from the LSPR wavelength. For the annealed stripe A1, we could not detect any SERS signal for this excitation condition, regardless of the polarization. In contrast, for array B1, SERS signal of MB molecules was obtained although the excitation was lying off any LSPR (Figure 9a). Note that for all the arrays of set B, we did observe a SERS signal of MB molecules with the 785 nm excitation; for arrays from set A, a low SERS signal could be obtained only on the stripes with the larger widths and LSPR closer to the 785 nm (see Figure SI.6). The observation of a SERS signal off LSPR is in accordance with the mapping of the optical near-field enhancement at 785 nm (see Figure SI.7). As for the excitation at 633 nm, it clearly reveals a strong variation in the cross-sectional area perpendicular and parallel to the stripe. The EM field is mainly enhanced where the roughness lies, while it is minimum on the sides of the structure (similar to the mapping at 633 nm (Figure 5), with maxima close to EF = 105 (see the section profiles in the Figure SI.7). The weak correlation between near-field enhancement and resonant excitation of the transverse plasmon mode is further supported by SERS measurements with different polarization angles of the excitation for the sample B1. As shown in Figure 9b, the intensity of the SERS spectra is almost independent of the incident polarization angles for sample B1, contrasting with the cos2θ dependence for the 633 nm excitation. This experimental SERS result is in quite good qualitative agreement with the DDA calculated polar graph of the enhancement factor EF, displaying no dependence with the polarization of the exciting light. An interesting and remarkable feature is the elliptic shape observed for both polar graphs of Figure 9b and 9c, with similar aspect ratio ISERS0°/ISERS∼ 1.3 which point toward a small residual nonresonant contribution of the EM enhancement of the transverse plasmon mode.
Figure 9.
(a) Extinction spectrum of sample B1 and SERS signal of MB molecules at λexc = 785 nm; (b) Polar graph of the SERS intensity of MB for sample B1 at 785 nm; (c) DDA calculation of the optical near-field enhancement EFmax vs the incident angle, at 785 nm, in the case of a roughened target.
Since the SERS intensity is not systematically correlated to the far-field extinction spectrum for the nonannealed samples, one can wonder where is located the region of the maximum enhancement. We thus calculated the enhancement factor as a function of the incident wavelength, as shown in Figure 10, for four incident wavelengths 633, 785, 900, and 1000 nm in both transverse and longitudinal polarizations. The calculations show that, as the excitation wavelength is red-shifted, the enhancement factor increases, reaching a maximum in the near-infrared range (ca. 800–900 nm), similar to the finding in ref (57). A physical insight has been proposed to understand the presence of a maximum for the enhancement factor in regions where extinction is the lowest, in the case of trimers of gold particles. It was shown that destructive interferences arising from plasmon excitation of coupled particles at 820 nm may not manifest themselves in the far-field spectrum, although resulting in a high SERS signal.57 Further studies are needed to find out if this argument can be extended to random NSR features on lithographically designed nanoparticles.
Figure 10.
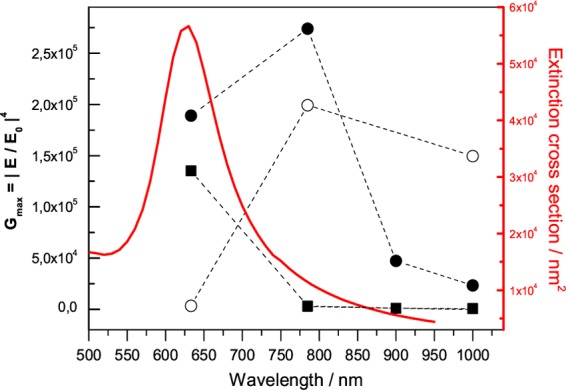
Extinction calculated cross section of a roughened target (red curve), together with the near-field enhancement: for a smooth stripe in transverse polarization (black square); for a roughened target in transverse polarization (black circle), in longitudinal polarization (empty circle). In the case of the smooth target, the NF enhancement remarkably follows the far-field extinction cross section. On the other hand, the NF enhancement is maximum in the red part of the visible spectral range for the roughened target, in both polarizations.
IV. Conclusion
In this study, the SERS efficiency of MB molecules was investigated on nonannealed and annealed lithographic gold stripes. We showed that the SERS intensity is not tightly linked to the far-field response of the nonannealed stripes. This mismatch between the far-field and near-field response is attributed to a significant contribution of the NSR features to the SERS intensities. The annealing process of the stripes, which decreases the NSR, results in a weakening of the SERS signal of the adsorbed molecules. The SERS intensity remarkably follows the far-field dipolar response on the annealed structures, which is not the case for the nonannealed samples. A remarkable result is the observation of a SERS signal off any LSPR excitation, for nonannealed samples, with a nearly complete loss of polarization anisotropy inherent to ideal stripe structures. All our results are in agreement with the results of the DDA calculations. The results further suggest that the SERS effect can be more pronounced in the red part of the visible range, far from the plasmon resonance of the structures under study.
Acknowledgments
We acknowledge the financial support from the European Science Foundation (ESF) for the activity entitled “New Approaches to Biochemical Sensing with Plasmonic Nanobiophotonics (PLASMON-BIONANOSENSE)” and the “Austrian Science Fund (FWF) under Project No. P21235-N20”.
Supporting Information Available
Further experiments on the stripes (AFM, SERS, results of thermal annealing, and the modeling of the optical properties). This material is available free of charge via the Internet at http://pubs.acs.org.
The authors declare no competing financial interest.
Supplementary Material
References
- Moskovits M. Surface-Enhanced Spectroscopy. Rev. Mod. Phys. 1985, 57, 783–826. [Google Scholar]
- Moskovits M. Persistent Misconceptions Regarding SERS. Phys. Chem. Chem. Phys. 2013, 15, 5301–5311. [DOI] [PubMed] [Google Scholar]
- Le Ru E. C.; Etchegoin P. G.. Principles of surface-enhanced Raman spectroscopy and related plasmonic effects; Elsevier: Amsterdam, 2009. [Google Scholar]
- Otto A. Surface Enhanced Scattering of Adsorbates. J. Raman Spectrosc. 1991, 22, 743–752. [Google Scholar]
- Aussenegg F. R.; Lippitsch M. E. On Raman Scattering in Molecular Complexes Involving Charge Transfer. Chem. Phys. Lett. 1978, 59, 214–216. [Google Scholar]
- Zayak A. T.; Hu Y. S.; Choo H.; Bokor J.; Cabrini S.; Schuck P. J.; Neaton J. B. Chemical Raman Enhancement of Organic Adsorbates on Metal Surfaces. Phys. Rev. Lett. 2011, 106, 083003–083006. [DOI] [PubMed] [Google Scholar]
- Le Ru E .C.; Blackie E.; Meyer M.; Etchegoin P. G. Surface Enhanced Raman Scattering Enhancement Factors: A Comprehensive Study. J. Phys. Chem. C 2007, 111, 13794–13803. [Google Scholar]
- Fleischmann M.; Hendra P. J.; McQuillan A. J. Raman Spectra of Pyridine Adsorbed at a Silver Electrode. Chem. Phys. Lett. 1974, 26, 163–166. [Google Scholar]
- Jeanmaire D. L.; Van Duyne R. P. Surface Raman Spectroelectrochemistry Part I. Heterocyclic, Aromatic, and Aliphatic Amines Adsorbed on the Anodized Silver Electrode. J. Electroanal. Chem. 1977, 84, 1–20. [Google Scholar]
- Creighton A. J.; Blatchford C. G.; Grant A. M. Plasma Resonance Enhancement of Raman Scattering by Pyridine Adsorbed on Silver or Gold Sol Particles of Size Comparable to the Excitation Wavelength. J. Chem. Soc. 1979, 75, 790–798. [Google Scholar]
- Liao P. F.; Bergmanh J. G.; Chemla D. S.; Wokaun A.; Melngallis J.; Hawryluk A. M.; Economou N. P. Surface-Enhanced Raman Scattering from Microlithographic Silver Particle Surfaces. Chem. Phys. Lett. 1981, 82, 355–359. [Google Scholar]
- Hulteen J. C.; Van Duyne R. P. Nanosphere Lithography: A Materials General Fabrication Process for Periodic Particle Array Surfaces. J. Vac. Sci. Technol., A 1995, 13, 1553–1558. [Google Scholar]
- Craighead H. G.; Nikklasson G. A. Characterization and Optical Properties of Arrays of Small Gold Particles. Appl. Phys. Lett. 1984, 44, 1134–1136. [Google Scholar]
- Gotschy W.; Vonmetz K.; Leitner A.; Aussenegg F. R. Thin Films by Regular Patterns of Metal Nanoparticles: Tailoring the Optical Properties by Nanodesign. Appl. Phys. B: Lasers Opt. 1996, 63, 381–384. [Google Scholar]
- Gunnarsson L.; Bjerneld E. J.; Xu H.; Petronis S.; Kasemo B.; Kall M. Interparticle Coupling Effects in Nanofabricated Substrates for Surface-Enhanced Raman Scattering. Appl. Phys. Lett. 2001, 78, 802–804. [Google Scholar]
- Félidj N.; Lau Truong S.; Aubard J.; Lévi G.; Krenn J. R.; Hohenau A.; Leitner A.; Aussenegg F. R. Gold Particle Interaction in Regular Arrays Probed by Surface Enhanced Raman Scattering. J. Chem. Phys. 2004, 120, 7141–7146. [DOI] [PubMed] [Google Scholar]
- Catalina D.; Guillot N.; Shen H.; Toury T.; Lamy de la Chapelle M. SERS Detection of Biomolecules Using Lithographed Nanoparticles Towards a Reproducible SERS Biosensor. Nanotechnology 2010, 21, 475501–475506. [DOI] [PubMed] [Google Scholar]
- Farcau C.; Astilean S. Mapping the SERS Efficiency and Hot-Spots Localization on Gold Film over Nanospheres Substrates. J. Phys. Chem. C 2010, 114, 11717–11722. [Google Scholar]
- Perney N.; Baumberg J.; Zoorob M.; Charlton M.; Mahnkopf S.; Netti C. Tuning Localized Plasmons in Nanostructured Substrates for Surface-Enhanced Raman Scattering. Optics Express 2006, 14, 847–857. [DOI] [PubMed] [Google Scholar]
- Gopinath A.; Boriskina S.; Reinhard B.; Dal Negro L. Deterministic Aperiodic Arrays of Metal Nanoparticles for Surface-Enhanced Raman Scattering (SERS). Optics Express 2009, 17, 3741–3753. [DOI] [PubMed] [Google Scholar]
- Felidj N.; Grand J.; Laurent G.; Aubard J.; Levi G.; Hohenau A.; Galler N.; Aussenegg F. R.; Krenn J. R. Multipolar Surface Plasmon Peaks on Gold Nanotriangles. J. Chem. Phys. 2008, 128, 094702–094706. [DOI] [PubMed] [Google Scholar]
- Laurent G.; Félidj N.; Truong S. L.; Aubard J.; Lévi G.; Krenn J. R.; Hohenau A.; Leitner A.; Aussenegg F. R. Imaging Surface Plasmon of Gold Nanoparticle Arrays by Far-Field Raman Scattering. Nano Lett. 2005, 5, 253–258. [DOI] [PubMed] [Google Scholar]
- Felidj N.; Aubard J.; Levi G.; Krenn J. R.; Hohenau A.; Schider G.; Leitner A.; Aussenegg F. R. Optimized Surface-Enhanced Raman Scattering on Gold Nanoparticle Arrays. Appl. Phys. Lett. 2003, 82, 3095–3097. [Google Scholar]
- Le Ru E.; Etchegoin P.; Grand J.; Felidj N.; Aubard J.; Lévi G. Mechanisms of Spectral Profile Modification in Surface-Enhanced Fluorescence. J. Phys. Chem. C 2007, 11, 16076–16079. [Google Scholar]
- Nie S.; Emory S. R. Probing Single Molecules and Single Nanoparticles by Surface-Enhanced Raman Scattering. Science 1997, 275, 1102–1106. [DOI] [PubMed] [Google Scholar]
- Emory S. R.; Nie S. Near-Field Surface-Enhanced Raman Spectroscopy on Single Silver Nanoparticles. Anal. Chem. 1997, 69, 2631–2635. [Google Scholar]
- Michaels A. M.; Jiang J.; Brus L. Ag Nanocrystal Junctions as the Site for Surface-Enhanced Raman Scattering of Single Rhodamine 6G Molecules. J. Phys. Chem. B 2000, 104, 11965–11971. [Google Scholar]
- Taylor R.; Lee T.-C.; Scherman O. A.; Esteban R.; Aizpurua J.; Huang F. M.; Baumberg J. J.; Mahajan S. Precise Subnanometer Plasmonic Junctions for SERS within Gold Nanoparticle Assemblies Using Cucurbit[n]uril Glue. ACS Nano 2011, 553878–3887. [DOI] [PubMed] [Google Scholar]
- Dieringer J. A.; Wustholz K. L.; Masiello D. J.; Camden J. P.; Kleinman S. L.; Schatz G. C.; Van Duyne R. P. Surface-Enhanced Raman Excitation Spectroscopy of a Single Rhodamine 6G Molecule. J. Am. Chem. Soc. 2009, 131, 849–854. [DOI] [PubMed] [Google Scholar]
- Le Ru E.; Grand J.; Sow I.; Somerville W.; Etchegoin P. G.; Treguer-Delapierre M.; Charron G.; Félidj N.; Lévi G.; Aubard J. A Scheme for Detecting Every Single Target Molecule with Surface-Enhanced Raman Spectroscopy. Nano Lett. 2011, 11, 5013–5019. [DOI] [PubMed] [Google Scholar]
- Carbo-Argibay E.; Rodriguez-Gonzalez B.; Gomez-Grana S.; Guerrero-Martinez A.; Pastoriza-Santos I.; Perez-Juste J.; Liz-Marzan M. The Crystalline Structure of Gold Nanorods Revisited. Evidence for Higher Index Lateral Facets. Angew. Chem., Int. Ed. 2010, 49, 9397–9400. [DOI] [PubMed] [Google Scholar]
- Kern A.; Martin O. Excitation and Reemission of Molecules Near Realistic Plasmonic Nanostructures. Nano Lett. 2011, 11, 482–487. [DOI] [PubMed] [Google Scholar]
- Kern A.; Meixner A.; Martin O. Molecule-Dependent Plasmonic Enhancement of Fluorescence and Raman Scattering Near Realistic Nanostructures. ACS Nano 2012, 6, 9828–9836. [DOI] [PubMed] [Google Scholar]
- Siegfried T.; Ekinci Y.; Martin O.; Sigg H. Engineering Metal Adhesion Layers That Do Not Deteriorate Plasmon Resonances. ACS Nano 2013, 7, 1787–1792. [DOI] [PubMed] [Google Scholar]
- Krenn J. R.; Weeber J. C.; Dereux A. In Nanophotonics with Surface Plasmons (Advances in Nano-Optics and Nano-Photonics; Shalaev V. M., Kawata S., Eds.; Elsevier: 2007. [Google Scholar]
- Sharma B.; Frontiera R. R.; Henry A.-I.; Ringe E.; Van Duyne R. P. SERS: Materials, Applications, and the Future. Mater. Today 2012, 15, 16–25. [Google Scholar]
- Wang Y.; Yan B.; Chen L. SERS Tags: Novel Optical Nanoprobes for Bioanalysis. Chem.l Rev. 2013, 113, 1391–1428. [DOI] [PubMed] [Google Scholar]
- Wang H.; Halas N. Mesoscopic Au Meatball Particles. Adv. Mater. 2008, 20, 820–825. [Google Scholar]
- Xia W.; Sha J.; Fang Y.; Lu R.; Luo Y.; Wang W. Gold Nanoparticles Assembling on Smooth Silver Spheres for Surface-Enhanced Raman Spectroscopy. Langmuir 2012, 28, 5444–5449. [DOI] [PubMed] [Google Scholar]
- Liang H.; Li Z.; Wang W.; Wu Y.; Xu H. Highy Surface-Roughened Flower-Like Silver Nanoparticles for Extremely Substrates of Surface-Enhanced Raman Scattering. Adv. Mater. 2009, 21, 4614–4618. [Google Scholar]
- Duan G.; Cai W.; Luo Y.; Li Y.; Lei Y. Hierarchical Surface Rough Ordered Au Particle Arrays and Their Surface Enhanced Raman Scattering. App. Phys. Lett. 2006, 89, 181918–181920. [Google Scholar]
- Rodriguez-Fernandez J.; Funston A.; Pérez-Juste R.; Alvarez-Pueblo R.; Liz-Marzan L.; Mulvaney P. The Effect of Surface Roughness on the Plasmonic Response of Individual Sub-Micron Gold Spheres. Phys. Chem. Chem. Phys. 2009, 1, 5909–5914. [DOI] [PubMed] [Google Scholar]
- Fang J.; Du S.; Lebedkin S.; Li Z.; Kruk R.; Kappes M.; Hahn H. Gold Mesostructures with Tailored Surface Topography and Their Self-Assembly Arrays for Surface-Enhanced Raman Spectroscopy. Nano Lett. 2010, 10, 5006–5013. [DOI] [PubMed] [Google Scholar]
- Schider G.; Krenn J. R.; Gotschy W.; Lamprecht B.; Ditlbacher H.; Leitner A.; Aussenegg F. R. Optical Properties of Ag and Au Nanowire Gratings. J. Appl. Phys. 2001, 90, 3825–3830. [Google Scholar]
- Purcell E. M.; Pennypacker C. R. Scattering and Absorption of Light by Nonspherical Dielectric Grains. Astrophys. J. 1973, 186, 705–714. [Google Scholar]
- Draine B. T.; Flatau P. J.. User Guide for the Discrete Dipole Approximation Code DDSCAT7.0. http://arxiv.org/pdf/0809.0337.pdf (accessed November 11, 2013).
- Félidj N.; Laurent G.; Aubard J.; Lévi G.; Hohenau A.; Krenn J. R.; Aussenegg F. R. Surface Enhanced Raman Scattering Arising from Multipolar Plasmon Excitation. J. Chem. Phys. 2005, 122, 011102–011105. [DOI] [PubMed] [Google Scholar]
- Lamprecht B.; Schider G.; Lechner R. T.; Ditlbacher H.; Krenn J. R.; Leitner A.; Aussenegg F. R. Metal Nanoparticle Gratings: Influence of Dipolar Particle Interaction on the Plasmon Resonance. Phys. Rev. Lett. 2000, 84, 4721–4724. [DOI] [PubMed] [Google Scholar]
- Rechberger W.; Hohenau A.; Leitner A.; Krenn J. R.; Lamprecht B.; Aussenegg F. R. Optical Properties of Two Interacting Gold Nanoparticles. Opt. Commun. 2003, 220, 137–141. [Google Scholar]
- Tinguely J. C.; Sow I.; Leiner C.; Grand J.; Hohenau A.; Felidj N.; Aubard J.; Krenn J. R. Gold Nanoparticles for Plasmonic Biosensing: The Role of Metal Crystallinity and Nanoscale Roughness. BioNanoScience 2011, 1, 128–136. [Google Scholar]
- Sherry L. J.; Chang S.-H.; Wiley B. J.; Xia Y.; Schatz G. C.; Van Duyne R. P. Localized Surface Plasmon Resonance Spectroscopy of Single Silver Nanocubes. Nano Lett. 2005, 5, 2034–2038. [DOI] [PubMed] [Google Scholar]
- Le Ru E. C.; Grand J.; Félidj N.; Aubard J.; Lévi G.; Hohenau A.; Krenn J. R; Blackie E.; Etchegoin P. G. Experimental Verification of the SERS Electromagnetic Model Beyond the E4 Approximation: Polarization Effects. J. Phys. Chem. C 2008, 112, 8117–8121. [Google Scholar]
- Fazio B.; D’Andrea C.; Bonaccorso F.; Irrera A.; Calogero G.; Vasi C.; Gucciardi P. G.; Allegrini M.; Toma A.; Chiappe D.; Martella C.; Buatier de Mongeot F. Re-radiation Enhancement in Polarized Surface-Enhanced Resonant Raman Scattering of Randomly Oriented Molecules on Self-Organized Gold Nanowires. ACS Nano 2011, 5, 5945–5956. [DOI] [PubMed] [Google Scholar]
- Wei H.; Hao F.; Huang Y.; Wang W.; Nordlander P.; Xu H. Polarization Dependence of Surface-Enhanced Raman Scattering in Gold Nanoparticle-Nanowire Systems. Nano Lett. 2008, 8, 2497–2502. [DOI] [PubMed] [Google Scholar]
- Le Ru E. C.; Etchegoin P. G. Rigorous Justification of the E4 Enhancement Factor in Surface Enhanced Raman Spectroscopy. Chem. Phys. Lett. 2006, 423, 63–66. [Google Scholar]
- Kleinman S.; Frontiera R. R.; Henry A.-I.; Dieringer J. A.; Van Duyne R. P. Creating, Characterizing, and Controlling Chemistry with SERS Hot Spots. Phys. Chem. Chem. Phys. 2013, 15, 21–36. [DOI] [PubMed] [Google Scholar]
- Kleinman S. L.; Sharma B.; Blaber M. G.; Henry A.-I.; Valley N.; Freeman R. G.; Natan M. J.; Schatz G. C.; Van Duyne R. P. Structure Enhancement Factor Relationships in Single Gold Nanoantennas by Surface-Enhanced Raman Excitation Spectroscopy. J. Am. Chem. Soc. 2013, 135, 301–308. [DOI] [PubMed] [Google Scholar]
Associated Data
This section collects any data citations, data availability statements, or supplementary materials included in this article.


