

Significance
Transcription factors (TFs) are the major regulators of gene expression. We have used a combination of computer simulations and theoretical methods to explore the atomic details for how a model TF, the lac repressor, moves on DNA in search for its specific binding site. We find that it slides along the DNA along a helical path, which allows it to probe for specific binding in a major groove. The uniqueness in the study lies in that the fully atomistic molecular dynamics model allows us to estimate the microscopic interaction energies from the TF-DNA structure and that we have developed a theoretical tool to derive macroscopic, experimentally testable, predictions for DNA residence time and sliding lengths from the microscopic interaction energies.
Keywords: facilitated diffusion, lac operon, lac repressors, gene regulation
Abstract
Transcription factors search for specific operator sequences by alternating rounds of 3D diffusion with rounds of 1D diffusion (sliding) along the DNA. The details of such sliding have largely been beyond direct experimental observation. For this purpose we devised an analytical formulation of umbrella sampling along a helical coordinate, and from extensive and fully atomistic simulations we quantified the free-energy landscapes that underlie the sliding dynamics and dissociation kinetics for the LacI dimer. The resulting potential of mean force distributions show a fine structure with an amplitude of 1 kBT for sliding and 12 kBT for dissociation. Based on the free-energy calculations the repressor slides in close contact with DNA for 8 bp on average before making a microscopic dissociation. By combining the microscopic molecular-dynamics calculations with Brownian simulation including rotational diffusion from the microscopically dissociated state we estimate a macroscopic residence time of 48 ms at the same DNA segment and an in vitro sliding distance of 240 bp. The sliding distance is in agreement with previous in vitro sliding-length estimates. The in vitro prediction for the macroscopic residence time also compares favorably to what we measure by single-molecule imaging of nonspecifically bound fluorescently labeled LacI in living cells. The investigation adds to our understanding of transcription-factor search kinetics and connects the macro-/mesoscopic rate constants to the microscopic dynamics.
Gene expression is regulated by transcription factors (TFs) that recognize specific sequences, operators, in DNA. The TFs are passively transported, yet they find their target operators faster than 3D diffusion allows in vitro (1). Theoretical efforts to reconcile the short search times with passive transport have resulted in the facilitated diffusion model, which describes the search process as alternating rounds of 3D diffusion in the cytoplasm and 1D diffusion along DNA (3). The latter means that the TF is capable of interacting sequence independently and “sliding” on or very close to the DNA helix. Single-molecule microscopy has provided evidence for facilitated diffusion in vitro (4) and recently also in vivo (5). Single-molecule studies in vitro indirectly suggest that the 1D diffusion along the DNA follows a helical trajectory. This is inferred from how the 1D-diffusion rate constant scales with the size of the sliding protein. The measurements also predict that a free-energy profile for sliding has a roughness of ∼1 kBT for several different TFs (6). Helical sliding on DNA has been explored at various levels of molecular simulation over the last decade (7–13). Although there are several lines of evidence for helical diffusion of TFs along the DNA, the atomic details of the translocation remain unknown, e.g., how hydrogen bonds change while sliding and how water and ions are displaced. These microscopic interactions will govern how the TF probes for the specific operator, how long a time the TF is nonspecifically bound to DNA, and thus how far the molecule slides before dissociating.
The lac operon has been a model system for gene regulation in bacteria for 50 y and is well characterized with respect to in vitro biochemistry, in vivo regulation, and structure (14–16). The wild-type lac operon repressor is a LacI homotetramer, a dimer of dimers, with two DNA-binding interfaces composed of two head domains each. As such, the tetramer can bind to two DNA strands simultaneously. A C-terminal truncation of one α-helix prevents tetramerization and results in LacI dimers with retained capacity for binding to one operator (5). Structure models from X-ray crystallography of LacI (16, 17) show how inducers or anti-inducers promote structural changes that modulate the affinity for the operator. There is, however, no complete structure model of LacI bound to nonoperator DNA, but an NMR ensemble of the head domain bound to an “anti-operator” indicates the structure of the head domain, how it differs from the operator-bound case, and the interactions it makes with DNA (18).
Here we use molecular dynamics (MD) simulations to reveal how dimeric LacI move along the DNA in search for the operator. We construct an atomistic structure model for dimeric LacI bound to nonoperator DNA from an existing experimental X-ray structure of the operator-bound LacI dimer and the nonspecific conformation seen in the NMR structure of the head domains. We then pull LacI in the direction of the DNA axis (steered molecular dynamics) without applying any angular forces and find that a helical path is preferred over nonhelical sliding on the DNA surface. On the basis of our findings from the axial pulling simulations we devise an umbrella-sampling method for calculating a potential of mean force (PMF) along a helical reaction coordinate and apply it to dimeric LacI bound to nonoperator DNA. We compare this to the free energy of dissociating from DNA to determine whether LacI remains in contact with DNA during the search process or whether translocation along DNA mainly occurs via macroscopic hops. We show that our simulation results agree well with experiments by connecting the free-energy differences at microscopic length scales and timescales with experimentally measurable macroscopic quantities, using Brownian dynamics simulation including rotational diffusion to bridge the mesoscopic length scales.
Results
The Nonspecifically Bound Structure.
The DNA-binding interface of the nonspecifically bound LacI dimer rapidly attained a structure close to that of the NMR-derived nonspecific structure during the targeted MD. During further equilibration without any applied forces its structure remained (rmsd of its Cα was 1.58 ± 0.20 Å) and the mutual center of mass (COM) of the head domains was located 1.33 nm from the central axis of the DNA helix during preparation. The structure of the core domains changed little between the specifically bound starting conformation and the equilibrated nonspecifically bound conformation. An asymmetry that can also be seen in the crystal structure, with the core domains tilting slightly toward one head domain, persisted during equilibration. In subsequent simulations, however, the core domains “swayed” freely (Fig. S1); hence we assume that the interface between the core and the head domains escaped any nonequilibrium configuration.
Axial COM Pulling.
When LacI was pulled one base pair axially for 100 ns on AT-DNA the COM of the head domains underwent a rotational movement corresponding to slightly less than 1/10th of a full helical turn. Keeping the reference planes, toward which the head domains were pulled, fixed at their final positions for another 100 ns allowed for LacI to complete the rotation. The mutual COM of the head domains explored a region in the plane spanned by the angle and axial position (the θx plane) that corresponds to what is expected for a helical path; in both directions, the COM movement spanned 1 bp and almost 1/10th revolution (Fig. 1B). The COM remained at 1.38 ± 0.11 nm (SD) from the DNA axis throughout the simulation, implying that LacI remained close to the DNA while traveling 1 bp.
Fig. 1.

(A) The regions explored by the head domains’ centers of mass in the pulling simulations have been repeated to illustrate the helical sliding path over many base pairs. The head domains are separated by approximately one helical turn, and hence their paths overlap. (B) Region sampled by the head domains’ mutual center of mass when a force is applied in the axial direction. In blue and red are points from dragging the head domains away from and toward a reference point on the DNA, respectively. An ideal B-DNA helix is shown as a black line for reference.
Although the pulling simulations are inherently nonequilibrium, the fact that LacI followed the DNA helix indicated this to be the dominant path for sliding, motivating further investigations of helical sliding and dissociation.
Helical Umbrella Sampling.
The free-energy profile G(x) relative to an arbitrary G0 along a reaction coordinate X is directly related to how X is populated. Application of an additional known potential U in the X direction in MD simulations can enable sampling of regions where G is high. Running simulations where slightly different U focuses the sampling to different parts of X is known as umbrella sampling and allows the calculation of the entire free-energy profile along X as a PMF (19). Because umbrella sampling can be used to directly sample energy barriers, it allows for the study of reactions that occur on timescales substantially longer than those of the simulations. Still, if the simulations are too short, they will be biased by the “memory” of the starting configuration and the first part of the data collected in this way should be omitted from analysis. Also, a proper choice of reaction coordinate is crucial for obtaining meaningful results. The result from the axial pulling experiment guided our choice of reaction coordinate and as a consequence our design of umbrella force is as follows:
i) The umbrella force should be applied only in the helical direction. This allows for orthogonal movements and makes comparison with the PMF in the radial direction possible.
ii) The tangent vector of a helical path depends on the radial distance from the helix axis; the projection of the unit tangent vector onto the helix axis decreases monotonically with distance and becomes zero in the limit of infinite distance. This is analogous to a spiral staircase being steeper near its center than on its outer rim; an infinitely wide staircase would have zero inclination on its outmost parts.
iii) The (umbrella) force must be a conservative field, i.e., the negative of the gradient of a scalar potential. If this is not the case, then the work required to reach an arbitrary point in conformational space will be path dependent.
iv) From ii and iii follows that the umbrella potential is invariant to the radial distance only exactly on the helical path; in positions away from the helical path the potential will vary with the distance to the helical axis. As a consequence, for the force to be a conservative field a radial component to the umbrella force necessarily arises (Fig. S2).
In Supporting Information, Helical Umbrella Sampling, we derive all equations necessary for implementing a harmonic helical umbrella potential and explore some of their features. The umbrella potential is U(u, r) = ku/L(r), and its force components are Fu = −2ku/L and Fr = −8πkur(θL−2πu)/L4. Here k is a force constant; u and r denote the deviation from a reference point ℧ in the helical and the radial direction, respectively; L is the r-dependent length of a full helical turn; and θ is the angular distance to a reference point.
Helical PMF.
The PMF along the helical path had a fine structure with an amplitude of ∼1 kBT. Two peaks stand out with a period of 1 bp and a height of ∼3.5 kBT relative to their immediate surroundings (Fig. 2C). The longitudinal SD—the roughness—of the PMF was 1.2 kBT for AT repeats and 0.8 kBT for GC repeats. The SD at each point given by bootstrapping was ∼1 kBT in most of the PMF. The overall features were the same for the AT and GC systems although AT repeats have been reported to bind significantly stronger to LacI (20). Specific interactions with AT result from structural rearrangements of the DNA (21) that are prevented by the periodic boundaries for the DNA in the simulations. For this reason we consider interactions with both GC and AT repeats to be representative of nonspecific interactions with DNA.
Fig. 2.

(A) The average number of H bonds to DNA for specific residues in the head domains calculated from the helical umbrella-sampling simulations. On the x axis are the residue indexes and on the y axis is how far LacI has traveled along the helix. The color bar ranges from 0 (white) to 2.5 (black). (B) The average shifted negative (±SD) of the number of hydrogen bonds between LacI and AT-DNA per umbrella window along the helix. (C) PMF (±SD) for LacI along a helical path on AT repeats (blue solid line) and GC repeats (red dashed line). (D) The average shifted negative of the number of hydrogen bonds (±SD) between LacI and AT-DNA per umbrella window in the radial direction. (E) PMF (±SD) for the dissociation of LacI from AT repeats. The dashed line is the calculated free energy for an unbound LacI molecule (Eq. S11).
In all umbrella-sampling simulations, with a total time of ∼9 μs, the head domains remained in close contact with the DNA, the COM of the former being 1.37 ± 0.14 nm (SD) from the axis of the latter. The DNA-binding interface was flexible, whereas the individual head domains were relatively rigid (Fig. S3).
Hydrogen Bonding While Sliding.
The hydrogen bonding of individual amino acids is seen in Fig. 2A. The two head domains hydrogen bond to the DNA to a similar degree, although subtle differences can be seen. The occupancy of the hydrogen bonds that are identified as part of the nonspecific binding (18) differed between neighboring umbrella windows along the helical path, which could explain some of the variation in the helical PMF (Fig. 2A). The ones characteristic of specific binding were either completely absent (Ala53) or occurring only with low occupancy in a minority of simulations (Tyr47, Asn50, and Gln54). In addition to previously identified hydrogen-bonding residues we found that Gly58 can bind for a long time, but it did so only in a minority of simulations. Met1 and Lys2 are part of the flexible N termini. Within the span of single trajectories they hydrogen bonded to several different sites on DNA, phosphate groups on both strands, and the DNA bases.
There were striking similarities between the negative of the total number of protein–DNA hydrogen bonds and the PMF along the helix (Fig. 2 B and C), but also notable differences. The number of hydrogen bonds had maxima (Nmax = 25.1) near the integer number of base pairs traveled and minima in between (Nmin = 9.9), resembling the overall shape of the PMF. Near 0.75 bp traveled, however, there were many hydrogen bonds (a minimum in Fig. 2B) but a peak in the PMF. The hydrogen bonds were calculated per window, and as there was less sampling near the peaks, the underlying statistics for the hydrogen bonds were less reliable there. Nevertheless, there were maxima ∼1 bp apart.
Interactions with Water and Ions.
Ions and water are displaced as LacI translocates on DNA, based on the helical umbrella-sampling simulations. Between the head domains the amount of water nearly reaches the background level around DNA (Fig. 3A) and there is an enrichment of ∼1 Na+ (Fig. 3B).
Fig. 3.

(A and B) Distributions of (A) water and (B) sodium around individual DNA base pairs calculated from the helical umbrella-sampling simulations. On the x axes are the base pair indexes on the DNA to which the distribution refers, and on the y axes is how far LacI has slid. To avoid double counting the waters and ions have been assigned to the nearest base pair.
During the dissociation process the water recondenses on DNA until the COM separation between the DNA and the DNA-binding interface reaches ∼2.7 nm (Fig. S4A).
Radial PMF and the Microscopic Residence Time.
The PMF as a function of the COM distance between the head domains of LacI and the DNA directly below can be seen in Fig. 2E. The PMF was virtually barrierless, inclined almost monotonically with increasing distance, and the dissociated state was ∼12 kBT above the bound state.
At a distance of ρ = 2.8 nm we consider the DNA-binding domains to be microscopically dissociated from DNA because water is recondensed at DNA and the head domains start moving independently of the DNA (Figs. S4 A and B and S5). From Eqs. S7 and S8 the mean time to reach the endpoint r = ρ from any starting distribution within the interval r0 ≤ r ≤ ρ, where r0 corresponds to LacI closely bound to DNA, can be calculated as
 |
The integrals were evaluated numerically, using the radial PMF for Gb(r), the equilibrium distribution  , the distance at the maximum in the radial PMF (2.8 nm) for ρ (Fig. 2C), and D3 = 50 μm2/s based on the Stokes–Einstein equation, yielding τd = 69 μs or, in terms of the microscopic dissociation rate constant,
  .
.
The Macroscopic Residence Time.
The next challenge is to derive properties from the microscopically simulated system that can be directly compared with experimental measurements. We start by calculating the residence time on one DNA segment including the inevitable rebinding events that is a consequence of diffusion-controlled dissociation (22), the effect being much enhanced in the case of leaving a 1D object in 3D. This involves calculating the number of rebinding events a TF makes to the same DNA segment before it reaches a distance Rc, where rebinding is uncorrelated to the microscopic dissociation event (3).
To consider both translational and rotational aspects of the diffusion process we have developed a Monte Carlo scheme for the diffusion of the repressor from the microscopically dissociated state to Rc or back to the bound state. The details of the simulation are described in Supporting Information, Stochastic Reaction-Diffusion Simulations (see also Fig. S6), but in principle the repressor displays rotational diffusion with the diffusion rate constant Dθ = 3D3/4r2 and translational diffusion away from the DNA or around the DNA with the diffusion rate constant D3. The repressor binds back to the DNA with the microscopic rate 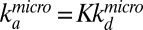 , when the repressor and DNA are at the reaction radius ρf, defined for the COM distances (ρf ∼ ρ + 3.15 nm when the head domains are oriented toward the DNA). If we use the experimentally determined equilibrium constant K = 2 × 10⁵ M−1 (23, 24) and Rc = 100 nm as in the experiments by Winter et al. (14) and assume that the reactive angle of the repressor lies in the range between π/10 and π/20 whereas the reactive angle on DNA is in the range between π/2 and π/3, we can estimate that the repressor rebinds in the range of 700 ± 180 times before reaching Rc. This implies that the macroscopic dissociation rate would be
 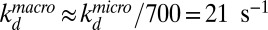 , which corresponds to a mean in vitro residence time of 48 ± 12 ms.
Sliding Length.
The 1D-diffusion coefficient depends on the variance ε2 of the underlying potential (25). In the case of a sizeable particle on a helical path (6) and a potential with fluctuations that obey a Gaussian distribution we have
 |
where b is the pitch per radian, η is the viscosity of the medium, and R and ROC are the particle’s radius and distance from the DNA axis. From our structure we get R = 4.2 nm, ROC = 4.55 nm, and b = 3.4/(2π) nm. η = 8.94 × 10⁻⁴ Pa/s for water at 300 K, and from our PMF we have ε ≈ 1 kBT, which yields D1 = 1.23(0.40−2.50) × 106(bp)2/s.
Finally, the sliding length is given by
 |
comparable to the value of ∼150 bp inferred from in vitro experiments on the tetramer conducted under conditions corresponding to those from which we have taken the in vitro parameters (14).
The in Vivo Residence Time.
We may now ask whether the macroscopic residence time on DNA based on in vitro parameters has any relevance in the intracellular situation where differences in pH, ionic strength, and cytoplasmic crowding may change the dissociation process and make the nonspecific DNA interactions significantly different. For this reason we used single-molecule in vivo imaging of fluorescently labeled LacI dimers (LacI-Venus) to estimate nonspecific residence time on chromosomal DNA in a bacterial strain where the specific operator sites were removed. The assay is based on how large a fraction of the fluorescent molecules can be seen at different exposure times. If a molecule is dissociated, it will move so fast that it cannot be observed as a diffraction-limited spot. We find that nonspecifically bound molecules are seen only for exposure times <20 ms when the inducer isopropyl β-D-1-thiogalactopyranoside (IPTG) is present. Without IPTG LacI interacts longer with DNA, presumably because of partially specific interactions that are lost upon addition of IPTG (Fig. 4A). When we consider that the repressor will interact nonspecifically with several different DNA segments before leaving a diffraction-limited region, we infer that the fully nonspecific interactions with one DNA segment typically lasted shorter than 20 ms. A lower bound for the residence time can be estimated by the recent in vivo sliding-length measurments (5), where  , which gives t > 3 ms if we consider that the in vivo diffusion constant for sliding is lower than D1 = 4 × 10⁵ bp2⋅s−1 measured in vitro (4). As a consequence the residence time determined from MD simulations is comparable to what can be estimated for in vivo conditions.
Fig. 4.

(A) Number of fluorescent LacI–Venus dimers per bacterial cell as a function of excitation-laser exposure time. (B and C) Fluorescence images taken with 10-s and 10-ms exposure time in the absence of ITPG. (D and E) The corresponding phase-constrast images.
Conclusions
When the lac repressor is pulled slowly along the DNA, it spontaneously follows a helical path along the grooves although no forces are applied to turn the molecule or to move it radially. This rules out a more unstructured sliding on the DNA surface and makes biological sense because it aligns the DNA-binding interface of the repressor to the DNA, allowing for the interrogation of hydrogen-bonding partners presented by the bases (26). The result from the pulling simulation also motivated us to characterize the free-energy landscape along the helical coordinate, using umbrella sampling. However, to know whether the repressor actually slides along the DNA before dissociation, we also need to compare the free-energy barriers for sliding 1 bp to the energy for spontaneously dissociating. When we compare the average time for microscopic dissociation, τd, with the calculated diffusion constant for sliding at 27 °C, we find that LacI is about 100 times more likely to slide 1 bp than to dissociate.
The atomistic modeling also allows us to keep track of structural features (Fig. S7) as well as individual hydrogen bonds, water molecules, and ions at the LacI–DNA interface. Ions and water are displaced as LacI slides along DNA (Fig. 3). However, they recondense at the other side of each DNA-binding domain and the sliding process is thus neutral with respect to the number of coordinated ions and water molecules. With increasing distance between LacI and DNA on the other hand, up to the reaction radius, the solvent recondenses on the DNA (Fig. S4A). The individual head domains are, apart from loops and the N-terminal tail, not particularly flexible during the sliding (Fig. S4B). Their position relative to each other is flexible, however, which indicates that the DNA-binding interface is insensitive to fluctuations in DNA structure and that LacI can slide also on (slightly) bent DNA. The link between the core and the head domains is flexible and allows large motions of the core domains, which could facilitate formation of DNA loops.
The simulations show that there are multiple ways for the side chains at the DNA-binding interface of LacI to form hydrogen bonds with DNA. In particular, we find that the hydrogen-bonding network is much more dynamic than that seen in Kalodimos et al.’s NMR ensemble (18). The dynamics of the hydrogen bonds while moving along the DNA are illustrated in Movie S1, where a number of structures from different umbrella windows have been animated. The flexibility in the hydrogen-bonding network yields a nearly flat energy landscape for sliding, which facilitates fast diffusion. The complex dynamics of the hydrogen bonds limit the quality of calculated PMFs from simulations because the conformational exploration will be slow within the individual umbrella windows. Our simulated dataset is already massive, and increasing the length of the simulations by another order of magnitude to increase sampling is unfortunately beyond what is practically feasible with the computer hardware at our disposal. The overall correspondence between our results and macro-/mesoscopic measurements in the literature is therefore an indication that we capture the important characteristics of the free-energy landscape.
The results provide constraints in terms of microscopic thermodynamics and geometry that need to be considered when modeling the search process. First of all, the relatively large free-energy penalty of dissociating from the DNA explains how and why other DNA-binding proteins hinder the passage of TFs in the search for the operator (5). Second, the helical sliding path means that the TF is in a position to recognize the specific binding site when sliding by. This increases the reaction cross-section significantly compared with diffusing in any orientation on the DNA surface.
It is remarkable that the free-energy profiles of the bound and free states meet at nearly the same level at the reaction radius in Fig. 2E; they were calculated in very different ways. Whereas the calculated potential for the bound state, i.e., inside the reaction radius, depends on the MD force field, the potential for the free state depends largely on the equilibrium binding constant obtained from experiments in vitro. The uncertainty in the equilibrium binding constant alone makes it likely that the striking agreement with the PMF at the reaction radius is partly a coincidence. In fact, the Brownian simulations of the dissociation processes suggest that the angular dependence on the LacI association to DNA is important for binding and that not all relevant rotation angles are tested before leaving DNA for an uncorrelated position. This implies that we do not expect a flat PMF at the reaction radius where the rotational degrees of freedom come into play. Instead, we expect a slight barrier in the radial reaction coordinate corresponding to a loss in entropy when the freely rotating LacI is locked into the binding configuration.
We have presented an important step toward a comprehensive understanding of TF search kinetics. The consequences will become important in the future elucidation of transcription-factor binding to the specific operator site and in the potential atomistic explanation of the low probability of binding to the operator site as recently reported (5). More generally, the results and the presented theoretical tools strongly connect macro-/mesoscopic events at the nanometer level, which enables a deeper interpretation of experimental observations.
Materials and Methods
Structure Preparation.
No experimental structure exists in the literature for the complete LacI dimer bound to nonoperator DNA. To obtain a starting structure for the simulations herein the structural information for the nonspecifically bound head domain (NS) and that for the full operator-bound LacI dimer (S) were combined as follows in a targeted-MD approach. The DNA sequence of S was replaced by the anti-operator from NS with MacroMolecule Builder (27), followed by targeted-MD simulation with harmonic position restraints applied to the DNA phosphate groups and the backbone of the helices in the head domains. Reference positions for the restraints were taken from NS and the force constant was set to 200 kJ⋅mol−1⋅nm−2. As such, the head domains were driven toward the nonspecific conformation whereas the core domains were free to relax in response to this change. The system was simulated for 50 ns under these conditions. Protonation states of amino acids were corroborated with the H++ server (28). Two new systems were created by exchanging the anti-operator with 30 bp ideal B-DNA composed of alternating A and T in the first case and G and C in the second. In both systems the DNA helix was made periodic so that its one end was bonded to the other end of the neighboring periodic copy. The molecular systems simulated from hereon were contained in a rectangular simulation box measuring 10.143 × 13.019 × 13.019 nm3, comprising 172,752 (AT) and 172,662 (GC) atoms, including 53,116 water molecules, 181 Na+, and 115 Cl−. The systems were then simulated for 20 ns without position restraints to allow for additional equilibration.
Axial Pulling Simulations.
LacI on AT repeats was used as a starting point for simulations, where LacI was pulled in the direction of the DNA axis, relative to 10 bp DNA that was immediately under LacI. Pulling forces were applied to the three α-helices of the head domains in the axial direction to avoid biasing the translocation toward a helical path. A force constant of 10,000 kJ⋅mol−1⋅nm−2 was used with one plane of reference per head domain. The planes, on which the pulling potential was centered, were slowly moved in the axial direction 0.34 nm (corresponding to 1 bp) over a period of 100 ns, after which the reference planes were held still for another 100 ns. Separate pulling simulations were done in both directions of the DNA axis.
Helical Umbrella Sampling.
With LacI kept fixed, the DNA was shifted and rotated around its DNA axis in steps of 0.01 helical revolutions to cover a total of 0.2 revolutions along the helix, corresponding to a translocation of 1 bp in each direction. Every such starting structure was resolvated in 0.154 M NaCl. Energy minimization and 20 ns of MD simulation with a Berendsen barostat (29) and a v-rescale thermostat (30) were followed to equilibrate all systems in a helical umbrella potential. In total there were 21 umbrella points for each of the two DNA sequences. All umbrella points were simulated for 200 ns under conditions identical to the equilibration simulations except that a Parrinello–Rahman barostat (31) with time constant 0.5 ps was used and the helical umbrella potential was applied to the mutual COM of the head domains’ helices. Force constants for the umbrella sampling were 2,000 kJ⋅mol−1⋅turn−2. Additional simulations were run with higher force constants (i.e., 3,000 kJ⋅mol−1⋅turn−2) around points on the reaction coordinate that were poorly sampled in the first round of simulations. The first 50 ns of every simulation were omitted to allow for further equilibration before analysis. All umbrella-sampling data were combined through weighted-histogram analysis with the g_wham tool (32) into PMFs for AT and GC repeats. SDs were estimated through bootstrapping and the histograms were weighted according to the inverse of the autocorrelation times of the underlying data. The PMFs were forced to be cyclic because the DNA sequences were periodic.
Radial Umbrella Sampling.
The energy-minimized starting structure for LacI on AT repeats was equilibrated for 200 ps, using a v-rescale thermostat with a time constant of 2 ps. Then, to equilibrate the pressure, we simulated another 200 ps, where a Parrinello–Rahman barostat was used with a time constant of 0.5 ps. Umbrella potentials that moved away from DNA at a rate of 10−4 nm/ps and with force constants of 5,000 kJ⋅mol−1⋅nm−2 were then applied to the three helices of each head domain in the direction orthogonal to the DNA axis. The reference group for the pulling was 20 bp of DNA directly below LacI. The pulling proceeded for 45 ns, after which 12 configurations were selected for the subsequent umbrella sampling simulation, where each umbrella window was simulated for 200 ns. An additional 10 simulations were run to increase sampling in poorly sampled regions. Finally, the PMF was computed with g_wham and the SD was estimated through bootstrapping, excluding the first 50 ns of each umbrella window to reduce the memory of the pulling simulation.
General Simulation Details.
All simulations were run with GROMACS software (33, 34) at 300 K and with periodic boundary condiitons. Atomic interactions were modeled with the Amber99sb force field with revised side-chain torsions (35–37) and Tip3p water (38). Electrostatics were calculated directly within a cutoff of 1.0 nm, beyond which the Particle Mesh Ewald method was used for long-range electrostatics. Van der Waals interactions were cut off at 1.0 nm and analytical corrections to energy and pressure were applied for interactions beyond that point. LacI and DNA were fully flexible except that, to reduce the degrees of freedom, virtual sites for all hydrogens (39) were used and bond stretching was constrained with the LINCS algorithm (40). Water molecules were kept rigid with SETTLE (41). These measures allowed for a time step of 4 fs in the simulations. Periodic boundary conditions were applied in all simulations.
Stochastic Reaction–Diffusion Simulation Including Brownian Rotational Diffusion.
The diffusion of LacI and its interaction with DNA are simulated in a concentric spatially discrete 2D system as described in ref. 42. In addition to radial spatial jumps the rotational diffusion of LacI around the DNA and LacI’s rotation around its own axis are described by rotational Brownian motion, where incremental angular rotations are sampled following each radial spatial jump. Binding of LacI to DNA is allowed in the innermost shell and when the angles are within both the reactive angles of the DNA and LacI. To estimate the probability, Pdiss, of LacI reaching a distance Rc rather than binding to the DNA, simulations were started with one LacI in the innermost concentric shell and simulations terminated when either the LacI bound DNA in the innermost shell or LacI jumped outward from the outermost shell.
Single-Molecule Fluorescence Imaging.
Strain JE107 [JE101Δ (lacOsym)::terminator] was grown in a microfluidic chip (43) and imaged and analyzed as described in ref. 5. The integrated power density was kept constant by increasing laser output with decreasing exposure times.
Supplementary Material
Acknowledgments
Computations were done within Swedish National Infrastructure for Computing projects 014/10-11, 025/12-15, 001/12-243, 001/12-63, and 2013/1-217. This work was supported by the European Research Council, the Swedish Foundation for Strategic Research, the Swedish Research Council, Göran Gustafssons Stiftelse, the European Molecular Biology Organization young investigator programme, and the Knut and Alice Wallenberg Foundation. A.M. was funded by the Centre for Interdisciplinary Mathematics, Uppsala University.
Footnotes
The authors declare no conflict of interest.
This article is a PNAS Direct Submission.
This article contains supporting information online at www.pnas.org/lookup/suppl/doi:10.1073/pnas.1307905110/-/DCSupplemental.
References
- 1.Riggs AD, Bourgeois S, Cohn M. The lac repressor-operator interaction. 3. Kinetic studies. J Mol Biol. 1970;53(3):401–417. doi: 10.1016/0022-2836(70)90074-4. [DOI] [PubMed] [Google Scholar]
- 2.Richter PH, Eigen M. Diffusion controlled reaction rates in spheroidal geometry. Application to repressor–operator association and membrane bound enzymes. Biophys Chem. 1974;2(3):255–263. doi: 10.1016/0301-4622(74)80050-5. [DOI] [PubMed] [Google Scholar]
- 3.Berg OG, Winter RB, von Hippel PH. Diffusion-driven mechanisms of protein translocation on nucleic acids. 1. Models and theory. Biochemistry. 1981;20(24):6929–6948. doi: 10.1021/bi00527a028. [DOI] [PubMed] [Google Scholar]
- 4.Elf J, Li GW, Xie XS. Probing transcription factor dynamics at the single-molecule level in a living cell. Science. 2007;316(5828):1191–1194. doi: 10.1126/science.1141967. [DOI] [PMC free article] [PubMed] [Google Scholar]
- 5.Hammar P, et al. The lac repressor displays facilitated diffusion in living cells. Science. 2012;336(6088):1595–1598. doi: 10.1126/science.1221648. [DOI] [PubMed] [Google Scholar]
- 6.Blainey PC, et al. Nonspecifically bound proteins spin while diffusing along DNA. Nat Struct Mol Biol. 2009;16(12):1224–1229. doi: 10.1038/nsmb.1716. [DOI] [PMC free article] [PubMed] [Google Scholar]
- 7.Sun J, Viadiu H, Aggarwal AK, Weinstein H. Energetic and structural considerations for the mechanism of protein sliding along DNA in the nonspecific BamHI-DNA complex. Biophys J. 2003;84(5):3317–3325. doi: 10.1016/S0006-3495(03)70056-3. [DOI] [PMC free article] [PubMed] [Google Scholar]
- 8.Halford SE, Marko JF. How do site-specific DNA-binding proteins find their targets? Nucleic Acids Res. 2004;32(10):3040–3052. doi: 10.1093/nar/gkh624. [DOI] [PMC free article] [PubMed] [Google Scholar]
- 9.Slutsky M, Mirny LA. Kinetics of protein-DNA interaction: Facilitated target location in sequence-dependent potential. Biophys J. 2004;87(6):4021–4035. doi: 10.1529/biophysj.104.050765. [DOI] [PMC free article] [PubMed] [Google Scholar]
- 10.Hu T, Grosberg AY, Shklovskii BI. How proteins search for their specific sites on DNA: The role of DNA conformation. Biophys J. 2006;90(8):2731–2744. doi: 10.1529/biophysj.105.078162. [DOI] [PMC free article] [PubMed] [Google Scholar]
- 11.Givaty O, Levy Y. Protein sliding along DNA: Dynamics and structural characterization. J Mol Biol. 2009;385(4):1087–1097. doi: 10.1016/j.jmb.2008.11.016. [DOI] [PubMed] [Google Scholar]
- 12.Furini S, Domene C, Cavalcanti S. Insights into the sliding movement of the lac repressor nonspecifically bound to DNA. J Phys Chem B. 2010;114(6):2238–2245. doi: 10.1021/jp906504m. [DOI] [PubMed] [Google Scholar]
- 13.Brackley CA, Cates ME, Marenduzzo D. Facilitated diffusion on mobile DNA: Configurational traps and sequence heterogeneity. Phys Rev Lett. 2012;109(16):168103. doi: 10.1103/PhysRevLett.109.168103. [DOI] [PubMed] [Google Scholar]
- 14.Winter RB, Berg OG, von Hippel PH. Diffusion-driven mechanisms of protein translocation on nucleic acids. 3. The Escherichia coli lac repressor–operator interaction: Kinetic measurements and conclusions. Biochemistry. 1981;20(24):6961–6977. doi: 10.1021/bi00527a030. [DOI] [PubMed] [Google Scholar]
- 15.Oehler S, Eismann ER, Krämer H, Müller-Hill B. The three operators of the lac operon cooperate in repression. EMBO J. 1990;9(4):973–979. doi: 10.1002/j.1460-2075.1990.tb08199.x. [DOI] [PMC free article] [PubMed] [Google Scholar]
- 16.Lewis M, et al. Crystal structure of the lactose operon repressor and its complexes with DNA and inducer. Science. 1996;271(5253):1247–1254. doi: 10.1126/science.271.5253.1247. [DOI] [PubMed] [Google Scholar]
- 17.Bell CE, Lewis M. A closer view of the conformation of the Lac repressor bound to operator. Nat Struct Biol. 2000;7(3):209–214. doi: 10.1038/73317. [DOI] [PubMed] [Google Scholar]
- 18.Kalodimos CG, et al. Structure and flexibility adaptation in nonspecific and specific protein-DNA complexes. Science. 2004;305(5682):386–389. doi: 10.1126/science.1097064. [DOI] [PubMed] [Google Scholar]
- 19.Torrie GM, Valleau JP. Nonphysical sampling distributions in Monte Carlo free-energy estimation: Umbrella sampling. J Comput Phys. 1977;23(2):187–199. [Google Scholar]
- 20.Riggs AD, Lin S, Wells RD. Lac repressor binding to synthetic DNAs of defined nucleotide sequence. Proc Natl Acad Sci USA. 1972;69(3):761–764. doi: 10.1073/pnas.69.3.761. [DOI] [PMC free article] [PubMed] [Google Scholar]
- 21.Durand M, Maurizot J-C. Interaction of lac repressor with alternating poly d (A-T) and poly d (G-C). Circular dichroism studies. Biochimie. 1980;62(7):503–507. doi: 10.1016/s0300-9084(80)80070-8. [DOI] [PubMed] [Google Scholar]
- 22.Berg OG. On diffusion-controlled dissociation. Chem Phys. 1978;30(1):47–57. [Google Scholar]
- 23.Revzin A, von Hippel PH. Direct measurement of association constants for the binding of Escherichia coli lac repressor to non-operator DNA. Biochemistry. 1977;16(22):4769–4776. doi: 10.1021/bi00641a002. [DOI] [PubMed] [Google Scholar]
- 24.deHaseth PL, Lohman TM, Record MT., Jr Nonspecific interaction of lac repressor with DNA: An association reaction driven by counterion release. Biochemistry. 1977;16(22):4783–4790. doi: 10.1021/bi00641a004. [DOI] [PubMed] [Google Scholar]
- 25.Zwanzig R. Diffusion in a rough potential. Proc Natl Acad Sci USA. 1988;85(7):2029–2030. doi: 10.1073/pnas.85.7.2029. [DOI] [PMC free article] [PubMed] [Google Scholar]
- 26.von Hippel PH. Biochemistry. Completing the view of transcriptional regulation. Science. 2004;305(5682):350–352. doi: 10.1126/science.1101270. [DOI] [PubMed] [Google Scholar]
- 27.Flores S, Sherman M, Bruns C, Eastman P, Altman R. Fast flexible modeling of RNA structure using internal coordinates. IEEE/ACM Trans Comput Biol Bioinform. 2011;8(5):1247–1257. doi: 10.1109/TCBB.2010.104. [DOI] [PMC free article] [PubMed] [Google Scholar]
- 28.Gordon JC, et al. H++: A server for estimating pKas and adding missing hydrogens to macromolecules. Nucleic Acids Res. 2005;33(Web Server issue):W368–W371. doi: 10.1093/nar/gki464. [DOI] [PMC free article] [PubMed] [Google Scholar]
- 29.Berendsen HJC, Postma JPM, Van Gunsteren WF, DiNola A, Haak JR. Molecular dynamics with coupling to an external bath. J Chem Phys. 1984;81(8):3684–3691. [Google Scholar]
- 30.Bussi G, Donadio D, Parrinello M. Canonical sampling through velocity rescaling. J Chem Phys. 2007;126(1):014101–014108. doi: 10.1063/1.2408420. [DOI] [PubMed] [Google Scholar]
- 31.Parrinello M. Polymorphic transitions in single crystals: A new molecular dynamics method. J Appl Phys. 1981;52(12):7182–7190. [Google Scholar]
- 32.Hub JS, de Groot BL, Van der Spoel D. g_wham: A free weighted histogram analysis implementation including robust error and autocorrelation estimates. J Chem Theory Comput. 2010;6(12):3713–3720. [Google Scholar]
- 33.Van Der Spoel D, et al. GROMACS: Fast, flexible, and free. J Comput Chem. 2005;26(16):1701–1718. doi: 10.1002/jcc.20291. [DOI] [PubMed] [Google Scholar]
- 34.Hess B, Kutzner C, Van der Spoel D, Lindahl E. GROMACS 4: Algorithms for highly efficient, load-balanced, and scalable molecular simulation. J Chem Theory Comput. 2008;4(3):435–447. doi: 10.1021/ct700301q. [DOI] [PubMed] [Google Scholar]
- 35.Wang J, Cieplak P, Kollman PA. How well does a restrained electrostatic potential (RESP) model perform in calculating conformational energies of organic and biological molecules? J Comput Chem. 2000;21(12):1049–1074. [Google Scholar]
- 36.Hornak V, et al. Comparison of multiple Amber force fields and development of improved protein backbone parameters. Proteins. 2006;65(3):712–725. doi: 10.1002/prot.21123. [DOI] [PMC free article] [PubMed] [Google Scholar]
- 37.Lindorff-Larsen K, et al. Improved side-chain torsion potentials for the Amber ff99SB protein force field. Proteins. 2010;78(8):1950–1958. doi: 10.1002/prot.22711. [DOI] [PMC free article] [PubMed] [Google Scholar]
- 38.Jorgensen WL, Chandrasekhar J, Madura JD, Impey RW, Klein ML. Comparison of simple potential functions for simulating liquid water. J Chem Phys. 1983;79(2):926–935. [Google Scholar]
- 39.Feenstra KA, Hess B, Berendsen HJC. Improving efficiency of large time-scale molecular dynamics simulations of hydrogen-rich systems. J Comput Chem. 1999;20(8):786–798. doi: 10.1002/(SICI)1096-987X(199906)20:8<786::AID-JCC5>3.0.CO;2-B. [DOI] [PubMed] [Google Scholar]
- 40.Hess B, Bekker H, Berendsen HJC, Fraaije JGEM. LINCS: A linear constraint solver for molecular simulations. J Comput Chem. 1997;18(12):1463–1472. [Google Scholar]
- 41.Miyamoto S, Kollman P. Settle: An analytical version of the shake and rattle algorithm for rigid water models. J Comput Chem. 1992;13(8):952–962. [Google Scholar]
- 42.Fange D, Berg OG, Sjöberg P, Elf J. Stochastic reaction-diffusion kinetics in the microscopic limit. Proc Natl Acad Sci USA. 2010;107(46):19820–19825. doi: 10.1073/pnas.1006565107. [DOI] [PMC free article] [PubMed] [Google Scholar]
- 43.Ullman G, et al. High-throughput gene expression analysis at the level of single proteins using a microfluidic turbidostat and automated cell tracking. Philos Trans R Soc Lond B Biol Sci. 2013;368(1611):20120025. doi: 10.1098/rstb.2012.0025. [DOI] [PMC free article] [PubMed] [Google Scholar]
Associated Data
This section collects any data citations, data availability statements, or supplementary materials included in this article.