Abstract
Grasslands comprise natural tropical savannah over managed temperate fields to tundra and cover one quarter of the Earth’s land surface. Plant growth, maintenance and decay result in volatile organic compound (VOCs) emissions to the atmosphere. Furthermore, biogenic VOCs (BVOCs) are emitted as a consequence of various environmental stresses including cutting and drying during harvesting. Fluxes of BVOCs were measured with a proton-transfer-reaction-mass-spectrometer (PTR-MS) over temperate mountain grassland in Stubai Valley (Tyrol, Austria) over one growing season (2008). VOC fluxes were calculated from the disjunct PTR-MS data using the virtual disjunct eddy covariance method and the gap filling method. Methanol fluxes obtained with the two independent flux calculation methods were highly correlated (y = 0.95×−0.12, R2 = 0.92). Methanol showed strong daytime emissions throughout the growing season – with maximal values of 9.7 nmol m−2 s−1, methanol fluxes from the growing grassland were considerably higher at the beginning of the growing season in June compared to those measured during October (2.5 nmol m−2 s−1). Methanol was the only component that exhibited consistent fluxes during the entire growing periods of the grass. The cutting and drying of the grass increased the emissions of methanol to up to 78.4 nmol m−2 s−1. In addition, emissions of acetaldehyde (up to 11.0 nmol m−2 s−1), and hexenal (leaf aldehyde, up to 8.6 nmol m−2 s−1) were detected during/after harvesting.
1 Introduction
Volatile organic compounds (VOCs) are emitted to the atmosphere from a variety of biogenic and anthropogenic sources with an estimated global emission of 1300 Tg C yr−1 (Goldstein and Galbally, 2007). Up to 90% of the global emissions are assumed to be of natural origin (Guenther et al., 1995). In the presence of VOCs the photochemical equilibrium between NO, NO2 and ozone can be shifted out of steady-state towards the formation of tropospheric ozone (Sillman, 1999). VOCs contribute to the formation of condensable matter and secondary organic aerosols, and thus indirectly affect cloud formation (Kulmala et al., 2004; Ramanathan et al., 2001). Moreover, secondary organic aerosols have negative effects on human health (Dockery et al., 1993). As a consequence biogenic VOCs (BVOCs) play a key role in tropospheric chemistry. However, the spatial and temporal variation of the biosphere-atmosphere exchange of organic trace gases is poorly understood as corresponding quantitative measurements are sparse.
BVOCs are emitted from processes such as growth, maintenance and decay of organic material (Goldstein and Galbally, 2007). Methanol, in particular, is released during cell wall elongation in growing plant tissues (Fall and Benson, 1996). Furthermore, VOCs are emitted as a consequence of plant stress like cutting grass (Fall et al., 1999; Karl et al., 2001) or in response to environmental stress conditions (temperature and light, ozone, water) (Loreto et al., 2006; Beauchamp et al., 2005; Sharkey and Loreto, 1993; Bertin and Staudt, 1996). The overall amount and the range of emitted VOCs is species specific (Kesselmeier, 2001) and depends on meteorological factors such as light, temperature and plant physiological and physicochemical constraints (Niinemets et al., 2004).
Long term ecosystem-scale VOC emission measurements are needed to determine and characterize VOC emissions from single events (cutting, stress events) as well as the continuous emissions during plant growth and its seasonal changes. Grasslands cover one quarter of the Earth’s land surface (Graedel and Crutzen, 1993), but long term VOC emission studies from e.g. managed grasslands are missing. Only two VOC emission studies, which cover more than one growing season have been conducted (Kirstine et al., 1998; Fukui and Doskey, 1998). However, both of these studies were performed under controlled conditions using static chambers. Brunner et al. (2007) investigated one growth period of grassland in between harvestings during one summer. The quantification of VOC emissions and their contribution to the global VOC budget requires measurements under regular environmental conditions that cover more than one growth period.
This paper reports seasonal changes of volume mixing ratios and fluxes of different VOCs from PTR-MS measurements above a temperate mountain grassland in an Austrian valley. VOC fluxes are calculated independently with the virtual disjunct eddy covariance (vDEC; Karl et al., 2002b) and gap filling (Spirig et al., 2005) methods and the results are compared. The diurnal patterns of fluxes and volume mixing ratios are presented for the months of June (representing summer) and October (representing autumn) and the differences between the two months are discussed. Grass harvesting is presented as an example of a short but intensive VOC emission burst to the atmosphere.
2 Experimental
2.1 Site description
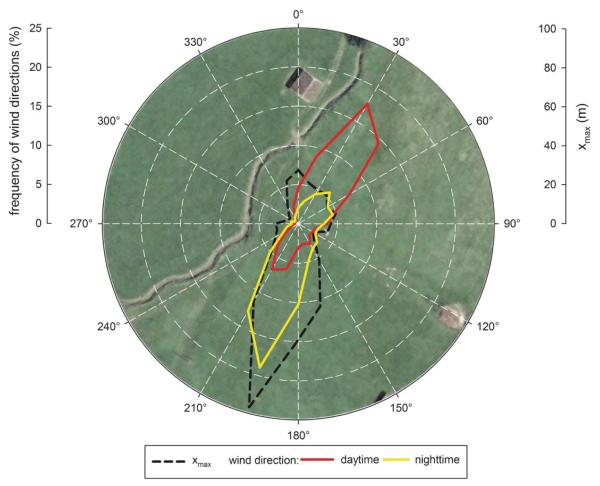
The measurements were performed over grassland in Stubai Valley (Austria) close to the village of Neustift (47° 07’N, 11° 19’E). The intensively managed meadow is located in the middle of a flat valley bottom 970 m above sea level. Its vegetation consists mainly of graminoids (Dactylis glomerata, Festuca pratensis, Phleum pratensis, Trisetum flavescens) and forbs (Ranunculus acris, Taraxacum officinale, Trifolium repens, Trifolium pratense, Carum carvi). The meadow is cut and harvested three times a year (in 2008 on the 10th of July, 10th of August and 29th of September). In 2008 three growing periods (between two cutting events) lasted from 10 April to 8 June, from 15 June to 8 August, and from 14 August to 28 September. The study site is fertilized with manure once per year, typically in autumn. The thermally induced valley wind system is reflected in the wind distribution in Fig. 1. Along the dominant daytime and nighttime wind directions the valley bottom is dominated by intensively managed meadows. Coniferous forest is the predominant vegetation on the slopes of the surrounding mountains. The maximum of the footprint function was calculated according to Hsieh et al. (2000) and is shown in Fig. 1 overlaid on an aerial picture of the study site. The footprint was larger during the night, when the wind velocities are usually weak and the atmosphere is stably stratified, than during unstable daytime conditions when higher wind velocities were encountered. The climate in Stubai valley is humid continental with alpine influences. The average annual temperature (1980–2000) was 6.5 ° C and the average annual rainfall was 852 mm. During the measurements from 22 May 2008 until 31 October 2008 (163 days) 71 days with measurable rain were registered with a total precipitation of 428.8 mm. A more detailed description of the study site, soil, vegetation and climate is given in Hammerle et al. (2008) and Wohlfahrt et al. (2008).
Fig. 1.
Polar plot of the maximum of the footprint function xmax (dashed black line) and the frequency the wind direction during daytime (red line) and nighttime (yellow line) overlaid on an aerial picture (TIRIS, http://tiris.tirol.gv.at/) of the study site.
2.2 Eddy covariance and meteorological instrumentation
The net ecosystem VOC exchange was measured using the disjunct eddy covariance (DEC) method that is based on the eddy covariance method (Baldocchi et al., 1988). The three wind components were measured by a three-dimensional sonic anemometer (R3IA, Gill Instruments, Lymington, UK); VOC volume mixing ratios by a PTR-MS instrument. Sample air was drawn from the inlet, displaced 0.1 m laterally and 0.1 m below the centre of the sensor volume of the sonic anemometer mounted at 2.5 m above ground, through 16 m heated (to 40 ° C) PFA Teflon tube of 4 mm inner diameter through a filter (1–2 μm, PTFE) to the PTR-MS at a flow rate of 8 sl min−1. The 20 Hz sonic anemometer data was stored to a hard drive of a personal computer using the EdiSol software (University of Edinburgh).
An automated weather station continuously measured incident global and photosynthetically active radiation, air and soil temperature, relative humidity, leaf wetness, rainfall, soil water content, wind speed and wind direction at the field site (Hammerle et al., 2008; Wohlfahrt et al., 2008).
2.3 PTR-MS setup and operation
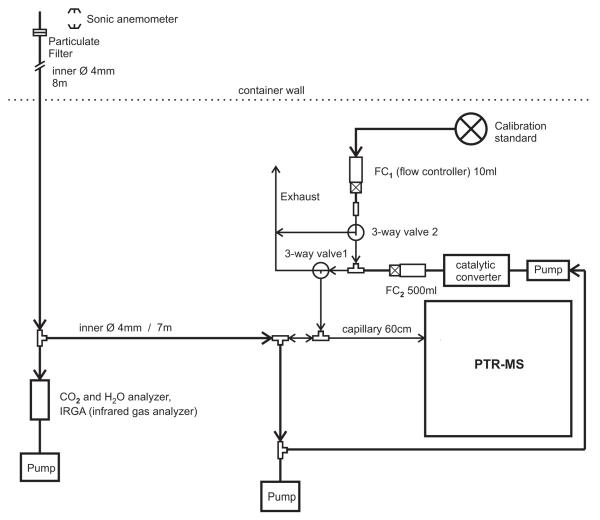
Selected VOCs (Table 1) were measured by means of a high sensitivity PTR-MS. The working principle of PTR-MS is described elsewhere (Hansel et al., 1995; Lindinger et al., 1998). The PTR-MS system was deployed in a container next to the field site. The measurement setup of the PTR-MS is illustrated in Fig. 2. Additionally to the air sampling (as described above), a pump continuously flushed 500 ml of the incoming air through a home-built catalytic converter (350 ° C) to produce VOC-free zero-air. During the last five minutes of every half-hour, zero-air was switched into the PTR-MS to determine the instrumental background (zero calibration). The instrument’s sensitivity was calibrated at ambient humidity once a week using a gas standard containing 11 VOCs in N2 (Apel Riemer Inc., USA). The flow of the gas standard was adjusted to 1 sccm, 2.5 sccm, 5 sccm and 7.5 sccm respectively, and diluted with 500 sccm scrubbed ambient air. The known calibration gas mixture was analyzed by the PTR-MS. Sensitivities were determined from linear regression of the known VOC volume mixing ratios and the respective signal intensities.
Table 1.
List of the measured masses/compounds with typical sensitivities, dwell times (tdwell) and the time-frame in which they were measured.
| m/z | likely compounds | typical sensitivity | t dwell | time-frame |
|---|---|---|---|---|
| 32 | — | 0.1 s | full growing season | |
| 37 | water cluster | – | 0.1 s | 10 July 2008–6 November 2008 |
| 33 | methanol* | 11.4ncps/ppbv1 | 0.5s | full growing season |
| 45 | acetaldehyde* | 16.8 ncps/ppbv1 | 0.2 s | full growing season |
| 59 | acetone* | 16.4 ncps/ppbv1 | 0.2 s | full growing season |
| 99 | hexenal | 3.7 ncps/ppbv2 | 0.2s | full growing season |
| 81 | monoterpene (frag.)*, hexenal (frag.) | 2.8 ncps/ppbv1 | 0.2s | full growing season |
| 57 | hexenal (frag.) | – | 0.2 s | full growing season |
| 137 | monoterpenes* | 1.2 ncps/ppbv1 | 0.2s | full growing season |
| 143 | hexenyl acetate | – | 0.1 s | 23 May 2008–6 November 2008 |
| 101 | hexenol, hexanal | – | 0.1 s | 23 May 2008–6 November 2008 |
| 83 | hexenol, hexanal (frag.) hexenyl acetate (frag.) | – | 0.1 s | 23 May 2008–6 November 2008 |
| 85 | pentenone | - | 0.1 s | 23 May 2008–6 November 2008 |
| 87 | pentenol, MBO, MBA | - | 0.1 s | 23 May 2008–6 November 2008 |
| 69 | isoprene* MBO, MBA (frag.) pentenol (frag.) | 6.8 ncps/ppbv1 | 0.1 s | 23 May 2008–6 November 2008 |
Compound used for gas calibration.
Typical value for the sensitivity was obtained during a gas calibration before the second hay harvest at 8 August 2009.
Sensitivity was calculated based on the sensitivity of acetone taking into account the transmission of the instrument and a fragmentation pattern recorded by Fall et al. (1999).
Fig. 2.
Schematical drawing of the PTR-MS inlet system and setup. During ambient air measurements outside air is drawn from the inlet line into the PTR-MS. For background measurements valve 2 is switched on and scrubbed ambient air obtained from a catalytic converter is guided to the instrument. For calibration measurements valve 1 is switched on to mix the selected gas standard flow (FC1) with the scrubbed ambient air (FC2 set to 500 ml).
Ambient air was analyzed for a number of VOCs at a repetition rate of 2.82 s until 10th of July, when it was changed to 3.00 s. The dwell-time for each single mass channel was 0.5 s or less. A list of the recorded masses and their dwell times is given in Table 1. The PTR-MS was operated at a drift tube pressure of 2.15 mbar and a drift voltage of 550 V. The PTR-MS data was stored in 30-min files and processed to VOC volume mixing ratios in ppbv using MATLAB 7.4.0 (R2007a, The MathWorks, Inc, USA).
3 Data analysis
3.1 VOC flux calculations
30-min VOC fluxes were calculated as the covariance between the turbulent fluctuations of the vertical wind speed and the VOC concentrations using the post-processing software EdiRe (University of Edinburgh). Means and turbulent fluctuations were calculated by Reynolds (block) averaging.
Two methods, which differ in the way they deal with the disjunct sampling of the VOC concentrations, were employed: The virtual Disjunct Eddy Covariance (vDEC) method, presented by Karl et al. (2002b), calculates the flux from a subsample of the horizontal wind data as given by the sampling rate of the PTR-MS. The gap filling method, discussed by Spirig et al. (2005), fills the missing VOC data by repeating the nearest neighbouring VOC mixing ratios to match the 20 Hz time resolution of the wind dataset. For a comparison of these two methods using subsamples of high-frequency CO2 and H2O flux measurements see Hörtnagl et al. (2010). The following processing steps are identical for both methods, except where indicated otherwise.
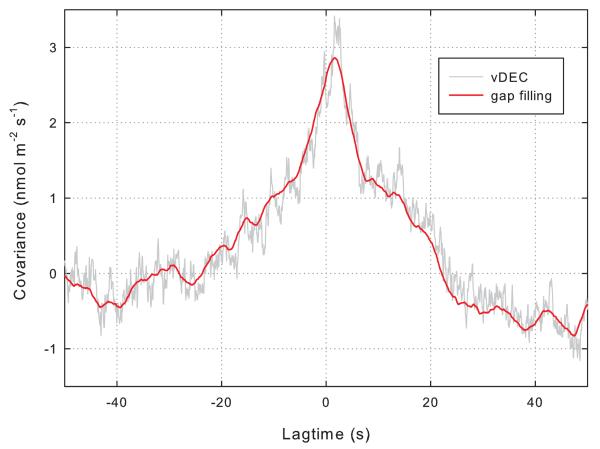
A three-axis coordinate rotation was performed aligning the co-ordinate system’s vector basis with the mean wind streamlines (Kaimal and Finnigan, 1994). Negative fluxes represent the transport from the atmosphere towards the surface (deposition), positive ones the reverse (emission). The time delay of the VOC signals was determined by optimizing the correlation coefficient with the vertical wind velocity (McMillen, 1988) within a ±50 s time window. As shown in Fig. 3, this worked generally well for methanol (m/z 33) and the water cluster measured at the mass to charge ratio m/z 37 (not shown). Based on the frequency distribution of the observed time delays of methanol, which exhibited a peak around 1.5 s and was slightly longer than the theoretical time delay based on tube length, diameter and flow rate, a lag window of +/−3 s around the peak value was defined. This lag window was then used for the other masses, for which the time delay determination by means of the cross-correlation was not consistently successful. If a time delay for a given 30-min period was outside this lag window, it was set to the peak value of the frequency distribution (i.e. 1.5 s). As shown in Fig. 3, the cross correlation was much noisier for the vDEC as opposed to the gap filling method, which is in accordance with the findings of Hörtnagl et al. (2010). Frequency response corrections were applied to the raw VOC fluxes accounting for high-pass (block averaging) and low-pass (lateral sensor separation, dynamic frequency response, scalar and vector path averaging, frequency response mismatch and the attenuation of concentration fluctuations down the sampling tube) filtering following Moore (1986), Massman (2000) and Aubinet et al. (2000). Additional low-pass filtering occurs for the fluxes calculated with the gap filling method, which was corrected according to Hörtnagl et al. (2010) – the lower covariance of the gap filling method in Fig. 3 is indicative of this flux loss as cospectral corrections are applied during a later processing step. Frequency-response corrections were based on a site-specific model cospectrum described by Wohlfahrt et al. (2005), as discussed in the next section.
Fig. 3.
Example (9 September 2008 10:45 CET) for the time delay between the methanol time series and the vertical wind velocity. Maximum covariances, i.e. lag times were 1.60 s for the vDEC method and 1.65 s for the gap filling method.
3.2 Frequency response of the flux measurements
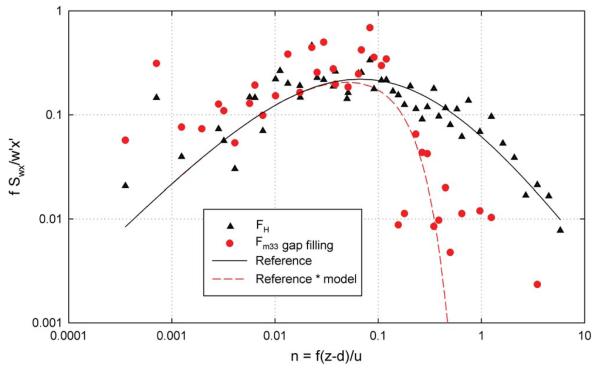
Higher frequencies of the methanol flux are dampened compared to the sensible heat flux (Fig. 4). The flux loss results mainly from the attenuation of the concentration fluctuations in the sampling tube (Massman, 1991) in conjunction with the slower time response of the PTR-MS as opposed to the sonic anemometer, and in case of the gap filling method additional low-pass filtering due to the data treatment. Fig. 4 also depicts the cospectral reference model (see Wohlfahrt et al., 2005 for further details) and the simulated (i.e. attenuated) cospectrum for the methanol flux (calculated with the gap-filling method). Both, the reference model and the attenuated reference model correspond reasonably well with the sensible heat (which experiences relatively little low-pass filtering) and the methanol flux cospectra, respectively. This confirms the approach of correcting for imperfections in the frequency response of our flux measurement system - all fluxes presented below were corrected accordingly.
Fig. 4.
Comparison of the cospectra for the sensible heat (black triangles) and methanol flux (red points; gap filling method) together with the cospectral reference model (Wohlfahrt et al., 2005; black line) and the reference model attenuated by a series of transfer functions which account for high- and low-pass filtering of the methanol flux (red dashed line).
High-pass filtering affected calculated fluxes by about 2% (Haslwanter et al., 2009), while low-pass filtering depended strongly on the method used for flux calculations. 90% of the vDEC fluxes were corrected with a factor of 1.11 or less, and 50% with 1.06 or less. When calculating fluxes with the gap-filling method, the imputation of the missing samples results in additional low-pass filtering, and therefore, larger corrections in the frequency domain than with the vDEC method are required (Hörtnagl et al., 2010). As a consequence, 90% of the fluxes calculated with the gap-filling method had to be corrected with a frequency response correction factor of 1.50 or less, and 50% with 1.20 or less.
3.3 Quality control
30-min fluxes were quality controlled by removal of time periods with (1) ambient concentrations of VOCs which were (averaged over half an hour) lower than the measured background signal, (2) a background drift higher than the sum of the standard deviations of the two adjacent background measurements within an hour, (3) the third rotation angle exceeding ±10° (McMillen, 1988), (4) the stationarity test for the various VOC fluxes exceeding 60% (Foken and Wichura, 1996), (5) the deviation of the integral similarity characteristics was larger than 60% (Foken and Wichura, 1996), and (6) the maximum of the footprint function (Hsieh et al., 2000) was outside of the boundaries of the meadow (cf. Novick et al., 2004).
A measured point was considered an outlier if the difference to the averaged signal during the half-hour was higher than 20 times the theoretical standard deviation (noise) of the signal. Half-hours with more than five outliers were flagged and not used for further analysis. Over the course of the measurement campaign about 6000 half-hourly fluxes were recorded for each VOC species, of which 76% (m/z 33), 67% (m/z 45), 64% (m/z 99) and 70% (m/z 137) passed all quality tests and were used in the subsequent analysis.
3.4 Random methanol flux uncertainty
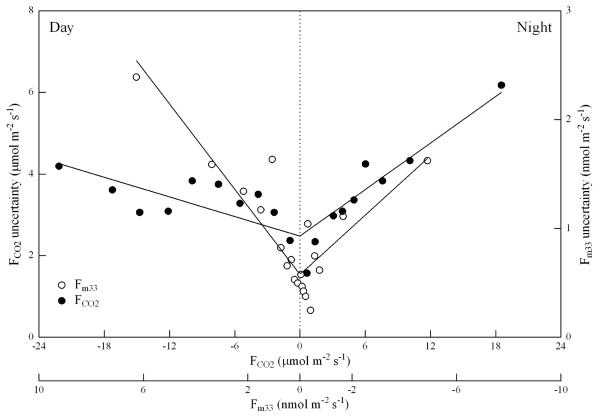
The random uncertainty of the 30-min vDEC methanol flux measurements was determined based on measurements under similar environmental conditions during adjacent days as suggested by Hollinger and Richardson (2005). As shown in Fig. 5, the random methanol flux uncertainty was larger during daytime as compared to nighttime, in contrast to CO2 fluxes measured at that site (Haslwanter et al., 2009). While slopes of linear regressions through nighttime data are similar for CO2 and methanol (0.19 and 0.22, respectively), the slope of a linear regression through the daytime methanol flux uncertainty is almost four times that of CO2 (0.31 vs. 0.08). We interpret this finding that during nighttime, the random flux uncertainty is determined to a large degree by the variability of the exchange processes, which are often non-stationary and intermittent, and thus similar for methanol and CO2. During daytime, when the turbulent exchange is steadier, the disjunct sampling of the methanol values causes a larger random variability (Hörtnagl et al., 2010) than continuous measurements of CO2 fluxes which were determined with the eddy covariance method from 20 Hz measurements.
Fig. 5.
Random uncertainty of methanol flux (vDEC method) and CO2 flux (from Haslwanter et al., 2009) derived according to Hollinger and Richardson (2005). Data have been binned into classes of equal size. A double-linear relationship with a common y-intercept was fit to the methanol flux data: y = 0.31× + 0.58 (daytime, R2 = 0.83), y = −0.22× + 0.58 (nighttime, R2 = 0.71). Note that the x-axis for methanol fluxes was flipped in order to match CO2 fluxes which are opposite in sign.
4 Results and Discussion
4.1 Comparison of the VOC fluxes calculated by virtual disjunct eddy covariance and gap filling method
Compared to the vDEC method, the gap filling method introduces an additional flux dampening. Hörtnagl et al. (2010) simulated a disjunct data set from 20 Hz measurements of H2O and CO2 fluxes and observed an additional low-pass filtering for the gap filling method compared to the vDEC method, as well. After correcting for this additional low-pass filtering, using the empirical correction function proposed by Hörtnagl et al. (2010), both calculation methods showed comparable fluxes (Fig. 6). A comparison of the time series of VOC fluxes calculated with the vDEC method and the gap filling method over a period of one week (18–24 June 2008) gives a correlation factor of R2 = 0.92 with a slope of 0.95 and an offset of −0.12 nmol m−2 s−1 for the linear regression. Although both methods give similar methanol fluxes, the vDEC method required fewer corrections and was therefore considered to be more reliable.
Fig. 6.
Methanol fluxes calculated with the vDEC (upper left panel) and the gap filling (lower left panel) method and the scatter plot between both including the regression line. Both fluxes agree with a correlation coefficient of R2 = 0.92.
4.2 VOC emissions from growing and cut grass
The VOC emissions from growing grassland were studied for the second growing period starting at 15 June 2008 (5 days after the first cutting) up to the 9 August 2008 (1 day before the second cutting). During this period the average air temperature was 16.0 ° C, the total rainfall was 85 mm and the grass wasn’t suffering from drought stress. Methanol was the only VOC measured by PTR-MS that was emitted from the grassland throughout the whole growing season. Due to the sequential detection of each mass only a limited set of 15 compounds was measured. Other methods could complement the range of compounds that are measured to determine alkene and halogenated VOC fluxes. The average emissions of methanol from the growing grassland were 2.5 nmol m−2s−1 and the average methanol volume mixing ratio was 5.2 ppbv. The maximum of the averaged diurnal methanol flux during the growing period of the grass was 6.0 nmol m−2 s−1 (observed around 13:30 CET). The observed maximum flux during the growing period is comparable to the 7.2 nmol m−2 s−1 reported in Brunner et al. (2007) over extensively managed grassland in central Switzerland. However, our findings are almost two times higher than the 3.4 nmol m−2 s−1 which were recorded at an intensively managed grassland during the same study, which was cut and fertilized four times a year and covered with a lower diversity of graminoids and forbs than our field site. The extensively managed grassland in Switzerland consisted of a higher diversity of species and its treatment – three cuts a year and no fertilization – was similar to the treatment of our field site (three cuts and one fertilization).
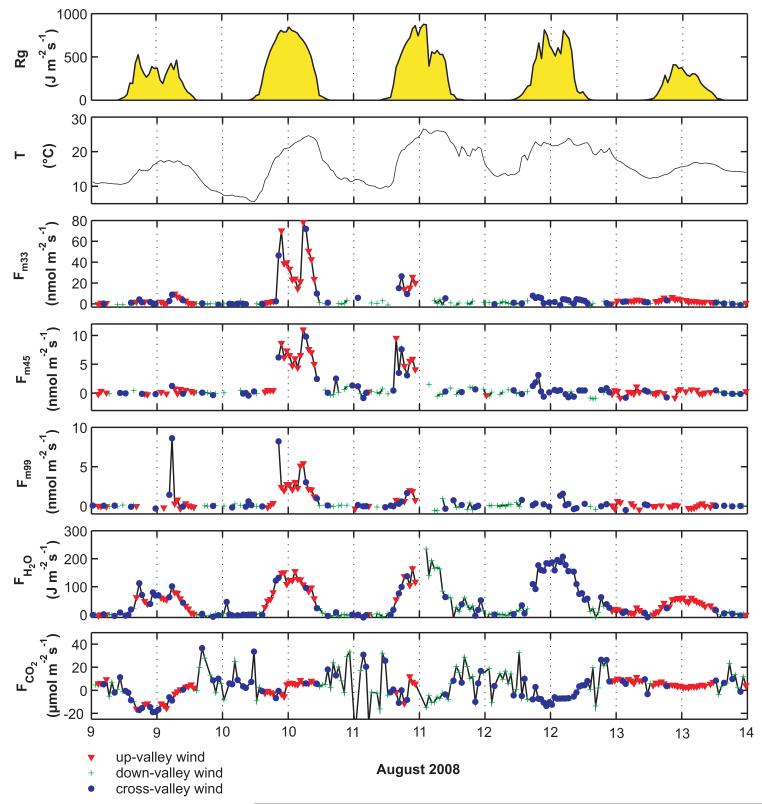
During the second cutting of the meadow on 10th of August 2008 emissions of compounds other than methanol could be detected. Figure 7 depicts the fluxes of CO2, H2O, three different VOCs (methanol (m/z 33), acetaldehyde (m/z 45), hexenal (m/z 99)) as well as air temperature and global radiation before, during, and after the cutting. The edges of the meadow, which were inaccessible with a tractor, were already cut on 9th of August. The typical deposition/emission pattern of the CO2 fluxes was distorted during the harvest (Wohlfahrt et al., 2008). The latent heat flux shows a clear diurnal pattern. Emission fluxes of methanol, acetaldehyde and m/z 99 were detected. The latter compound is expected to be hexenal, which is emitted as a result of leaf wounding after cutting (Fall et al., 1999). Similar to methanol emissions, acetaldehyde emissions can be activated by leaf wounding (Fall et al., 1999; Davison et al., 2008) or other stress situations like dark-light transitions (Karl et al., 2002a). For the first two compounds the fluxes were highest during the cut on 10th of August (for methanol up to 78.4 nmol m−2 s−1, for acetaldehyde up to 11.0 nmol m−2 s−1). The hexenal was predominantly present during the cut on 9th and 10th of August and only to a smaller extent during drying. High emissions (> 26.0 nmol m−2 s−1 for methanol and >9.5 nmol m−2 s−1 for acetaldehyde) were still visible during the drying and turning of the hay on the next day. Fluxes of methanol (up to 91.5 nmol m−2 s−1), acetaldehyde (up to 19.4 nmol m−2 s−1), and the leaf wounding compounds were also detected during and after the grass-cut of a study site in Switzerland (Davison et al., 2008). In general, the maxima of the fluxes which were observed at the study site in Neustift were lower than the ones reported in Davison et al. (2008) which might be due to the differences in plant species and the amount of cut biomass.
Fig. 7.
From the upper panels to the lower: Time series of the global radiation (Rg), temperature, methanol flux, acetaldehyde flux, flux m/z 99, latent heat flux and CO2 flux during the second hay harvest on the 10th of August 2008.
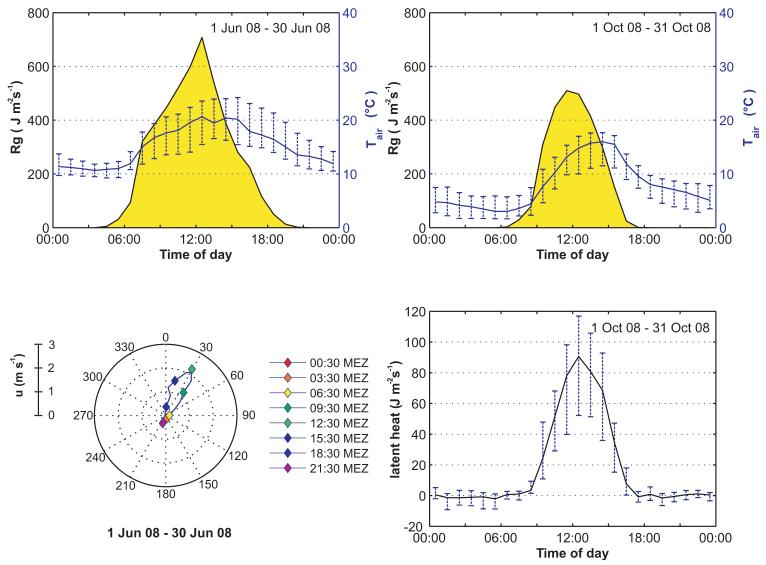
In contrast to the usual wind patterns in Stubai valley (demonstrated for June in Fig. 9, lower left panel) the dominating wind directions in the period from August 11 until August 13 were cross-valley or valley-outwards. The meadows which are located in the patch for the corresponding wind directions were not cut yet and therefore, VOC emissions were lower and CO2 fluxes were dominated by uptake during this time period.
Fig. 9.
Upper panels: Median diurnal cycles of the temperature including the 25% and 75% percentiles overlaid on the diurnal cycle of the global radiation for the months June and October 2008. Lower left and right panel: Polar plot of the median diurnal cycle of the horizontal wind speed in June 2008 and diurnal cycle of the latent heat flux for October 2008.
4.3 Seasonality of diurnal VOC patterns
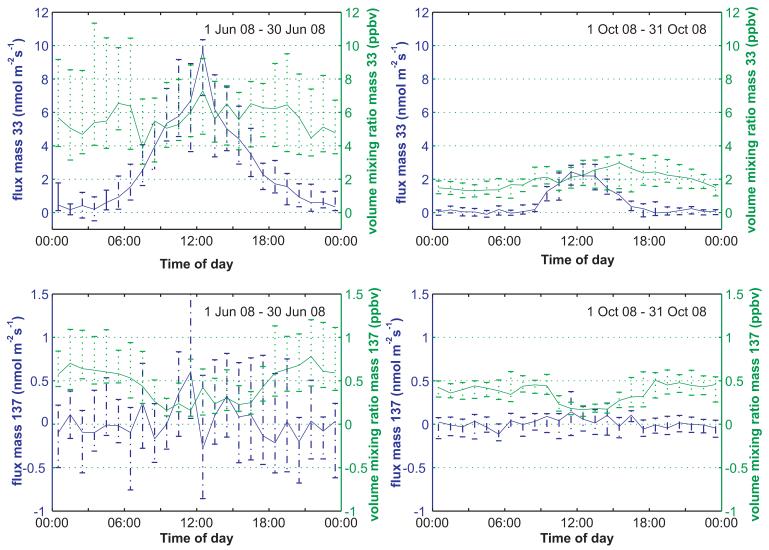
The seasonality of diurnal VOC fluxes and ambient volume mixing ratios is compared for a summer and a fall month in Fig. 8. Table 2 shows the number of 30 min periods which contributed to the statistics of the calculated diurnal flux patterns. For both months and both VOCs shown in Table 2 and Fig. 8 there is a sufficient number of quality controlled data points in each half-hour per hour of the day to produce the typical medians for the visualization of diurnal patterns.
Fig. 8.
Median diurnal cycles of methanol (upper panels) and monoterpene (lower panels) volume mixing ratios (green lines) and fluxes (blue lines) including the 25% and 75% percentiles for the months June and October 2008.
Table 2.
Minimal and maximal amount of half-hours used to calculate the hourly flux medians for diurnal patterns (Fig. 8) in June and October after applying the quality control on m/z 33 and m/z 137 (partitioned to nighttime and daytime according to median radiation). Each hourly flux median was calculated from at least 18 half-hours.
| Flux values for calculation of diurnal cycle |
|||||
|---|---|---|---|---|---|
|
|
|||||
| Daytime half-hours | Nighttime half-hours | ||||
| Month | m/z | min | max | min | max |
|
| |||||
| June (Day 06:00–19:00 CET) | 33 137 |
31 18 |
44 34 |
25 26 |
35 36 |
|
| |||||
| October (Day 08:00–16:00 CET) | 33 137 |
25 21 |
34 33 |
21 22 |
33 36 |
The fluxes of methanol showed a distinct diurnal cycle with highest emissions around noon (Fig. 8). Methanol is produced during plant growth (Fall and Benson, 1996) and amongst other factors stomatal conductance controls its emission (Niinemets et al., 2004). The opening of the stomata largely follows the diurnal course of radiation at this measurement site (Wohlfahrt et al., 2009) and as expected the methanol emission follows the diurnal pattern of the global radiation (Fig. 9 upper left panel). For the diurnal cycle of methanol flux in June the emission increased until it reached a maximum of 9.7 nmol m−2 s−1 around noon; afterwards it decreased slowly to zero in the evening. Despite the clear local source, no distinct diurnal cycle for the methanol volume mixing ratio (4–7 ppbv) was visible. This was caused by the long lifetime of methanol, in combination with an efficient mixing of the atmosphere during daytime.
In October the behavior of the volume mixing ratios was different: due to the lower radiation (compare Fig. 9 upper right panel) the mixing during daytime was less efficient. The methanol volume mixing ratios were weaker and slowly increased from below 0.7 ppbv during the night to 2.9 ppbv in the late afternoon before they decreased again. The methanol fluxes still showed a distinct diurnal pattern. Compared to June, methanol emissions started later in the morning. The highest emission, 2.5 nmol m−2 s−1, was detected around 11:30 CET. Afterwards the methanol flux dropped to zero at 16:30 CET. The reduced methanol emissions in October can be explained by the lower global radiation and lower temperatures compared to June (Harley et al., 2007; compare Fig. 9 upper left and upper right panels).
Emissions from growing plants are, in fact, the largest source of methanol to the atmosphere (Jacob et al., 2005). Fukui and Doskey (1998) reported 2-year average methanol fluxes normalized to 25 ° C of 3.9 nmol m−2 s−1 measured at noon during sunny conditions above grassland in Illinois. Methanol is not only emitted by grasslands but also by other types of vegetation. A subalpine forest in the Rocky mountains emitted methanol up to 8.4 nmol m−2 s−1 (Karl et al., 2002b); A mixed deciduous forest in central Europe emitted 2.6 nmol m−2 s−1 of methanol on an average day (Spirig et al., 2005). All of these results are in the same range as the variation of daytime methanol emissions from the growing grassland in Neustift. However, at our field site no nocturnal deposition fluxes were seen. Karl et al. (2004), reported methanol deposition fluxes applying the gradient method above a tropical rainforest. Due to limitations of the eddy covariance approach during calm and stable nighttime conditions deposition fluxes are hard to detect.
The diurnal patterns of fluxes and volume mixing ratios of monoterpenes (m/z 137) showed different characteristics than methanol (Fig. 8 left and right lower panel). There was no indication for monoterpene emissions. The monoterpene fluxes from the grassland were close to zero and calculated emissions were always below 0.6 nmol m−2 s−1. This is several times lower than average daytime emissions from forest ecosystems, e.g., from a mixed deciduous forest (Spirig et al., 2005). The clear diurnal cycles in volume mixing ratios, with minima around 200 pptv during noon and maxima during the night between 400 pptv in October and around 600 pptv in June (Fig. 8 lower left and right panel), were driven by the transport of monoterpenes with the thermally induced valley wind system and the vertical mixing. The valley bottom is covered with grassland, but the vegetation on the mountain slopes is composed mainly of coniferous tree species such as Norway spruce. Coniferous trees emit large quantities of monoterpenes (Janson, 1993; Hakola et al., 2006; Grabmer et al., 2006; Rinne et al., 2007). Unlike the methanol emissions above the meadow, the majority of monoterpene emissions from trees are not light dependent (Niinemets et al., 2004). When the boundary layer height decreases in the evening and during night, monoterpenes emitted by the nearby forest are transported to the valley bottom. Therefore, the highest monoterpene volume mixing ratios are reached during nighttime.
5 Summary and conclusions
Disjunct eddy covariance flux measurements were carried out above intensively managed temperate mountain grassland during the growing season 2008. The application of the virtual disjunct eddy covariance method and the gap filling method for the VOC flux calculations provided very similar results. However, the virtual disjunct eddy covariance method requires less corrections for VOC flux calculations of disjunct data and is, therefore, easier to use and more reliable. The comparison of the flux diurnal cycles for June 2008 and October 2008 identified a significant difference in the emission maxima for the two months. The diurnal pattern of methanol for the two months changed in a similar way compared to the global radiation, seemingly driven by the changes in irradiation, temperature and possibly plant growth. Methanol was emitted during the harvesting and growth of the grassland. During the cutting, fluxes of hexenal were detected in addition to the methanol fluxes. Acetaldehyde and methanol showed not only fluxes during the cutting but also during the drying of the grass.
Acknowledgements
This study was financially supported by the Austrian National Science Fund under contract P19849-B16, the Tyrolean Science Fund under contract Uni-404/486. Family Hofer (Neustift, Austria) is acknowledged for granting us access to the study sites and the TIRIS (Tiroler Rauminformationssystem) for the aerial picture of the study site.
References
- Aubinet M, Grelle A, Ibrom A, Rannik Ü, Moncrieff J, Foken T, Kowalski AS, Martin PH, Berbigier P, Bernhofer Ch., Clement R, Ebers J, Granier A, Grünwald T, Morgenstern K, Pilegaard K, Rebmann C, Snijders W, Valentini R, Vesala T. Estimates of the annual net carbon and water exchange of forest: the EUROFLUX methodology. Adv. Ecol. Res. 2000;30:113–175. [Google Scholar]
- Baldocchi DD, Hicks BB, Meyers TP. Measuring biosphere-atmosphere exchangesof biologically related gases with micrometeorological methods. Ecology. 1988;69:1331–1340. [Google Scholar]
- Beauchamp J, Wisthaler A, Hansel A, Kleist E, Miebach M, Niinemets U, Schurr U, Wildt J. Ozone induced emissions of biogenic voc from tobacco: Relationships between ozone uptake and emission of lox products. Plant Cell Environ. 2005;28:1334–1343. [Google Scholar]
- Bertin N, Staudt M. Effect of water stress on monoterpene emissions from young potted holm oak (quercus ilex 1.) trees. Oecologia. 1996;107:456–462. doi: 10.1007/BF00333935. [DOI] [PubMed] [Google Scholar]
- Brunner A, Ammann C, Neftel A, Spirig C. Methanol exchange between grassland and the atmosphere. Biogeosciences. 2007;4:395–410. [Google Scholar]
- Davison B, Brunner A, Ammann C, Spirig C, Jocher M, Neftel A. Cut-induced VOC emissions from agricultural grasslands. Plant Biol. 2008;10(1):76–85. doi: 10.1055/s-2007-965043. [DOI] [PubMed] [Google Scholar]
- Dockery DW, Pope CA, Xu X, et al. An association between air pollution and mortality in six US cities. New Engl. J. Med. 1993;329:1753–1759. doi: 10.1056/NEJM199312093292401. [DOI] [PubMed] [Google Scholar]
- Fall R, Benson AA. Leaf methanol – the simplest natural product from plants. Trends Plant Sci. 1996;1:296–301. [Google Scholar]
- Fall R, Karl T, Hansel A, Jordan A, Lindinger W. Volatile organic compounds emitted after leaf wounding: On-line analysis by proton-transfer-reaction mass spectrometry. J. Geophys. Res. 1999;104(D13):15963–15974. doi:10.1029/1999jd900144. [Google Scholar]
- Foken T, Wichura B. Tools for quality assessment of surface-based flux measurements. Agricultural and Forest Meteorology. 1996;78:83–105. [Google Scholar]
- Fukui Y, Doskey PV. Air-surface exchange of nonmethane organic compounds at a grassland site: Seasonal variations and stressed emissions. J. Geophys. Res. 1998;103(D11):13153–13168. doi:10.1029/98jd00924. [Google Scholar]
- Goldstein AH, Galbally IE. Known and unexplored organic constituents in the earth’s atmosphere. Environ. Sci. Technol. 2007;41:1514–1521. doi: 10.1021/es072476p. [DOI] [PubMed] [Google Scholar]
- Grabmer W, Kreuzwieser J, Wisthaler A, Cojocariu C, Graus M, Rennenberg H, Steigner D, Steinbrecher R, Hansel A. VOC emissions from norway spruce (Picea abies L. [Karst]) twigs in the field – Results of a dynamic enclosure study. Atmos. Environ. 2006;40:128–137. [Google Scholar]
- Graedel TE, Crutzen PJ. Atmospheric change: An earth system Perspective. W. H. Freeman; New York, USA: 1993. p. 446. [Google Scholar]
- Guenther A, Hewitt CN, Erickson D, Fall R, Geron C, Graedel T, Harley P, Klinger L, Lerdau M, McKay WA, Pierce T, Scholes B, Steinbrecher R, Tallamraju R, Taylor J, Zimmerman P. A global model of natural volatile organic compound emissions. J. Geophys. Res. 1995;100(D5):8873–8892. doi:10.1029/94jd02950. [Google Scholar]
- Hakola H, Tarvainen V, B̈ack J, Ranta H, Bonn B, Rinne J, Kulmala M. Seasonal variation of mono- and sesquiterpene emission rates of scots pine. Biogeosciences. 2006;3:93–101. http://www.biogeosciences.net/3/93/2006/ [Google Scholar]
- Hammerle A, Haslwanter A, Tappeiner U, Cernusca A, Wohlfahrt G. Leaf area controls on energy partitioning of a mountain grassland. Biogeosciences. 2008;5:421–431. doi: 10.5194/bg-5-421-2008. http://www.biogeosciences.net/5/421/2008/ [DOI] [PMC free article] [PubMed] [Google Scholar]
- Hansel A, Jordan A, Holzinger R, Prazeller P, Vogel W, Lindinger W. Proton transfer reaction mass spectrometry: Online trace gas analysis at the ppb level. Int. J. Mass Spectrom. Ion Proc. 1995:149–150. 609–619. [Google Scholar]
- Harley P, Greenberg J, Niinemets Ü, Guenther A. Environmental controls over methanol emission from leaves. Biogeosciences. 2007;4:1083–1099. http://www.biogeosciences.net/4/1083/2007/ [Google Scholar]
- Haslwanter A, Hammerle A, Wohlfahrt G. Open-path vs. Closed-path eddy covariance measurements of the net ecosystem carbon dioxide and water vapour exchange: A long-term perspective. Agr. For. Meteorol. 2009;149:291–302. doi: 10.1016/j.agrformet.2008.08.011. [DOI] [PMC free article] [PubMed] [Google Scholar]
- Hollinger DY, Richardson AD: Uncertainty in eddy covariance measurements and its application to physiological models. Tree Physiol. 2005;25:873–885. doi: 10.1093/treephys/25.7.873. [DOI] [PubMed] [Google Scholar]
- Hörtnagl L, Clement R, Graus M, Hammerle A, Hansel A, Wohlfahrt G. Dealing with disjunct concentration measurements in eddy covariance applications: a comparison of available approaches. Atmos. Environ. 2010;44:2024–2032. doi: 10.1016/j.atmosenv.2010.02.042. [DOI] [PMC free article] [PubMed] [Google Scholar]
- Hsieh CI, Katul G, Chi T. w. An approximate analytical model for footprint estimation of scalar fluxes in thermally stratified atmospheric flows. Adv. Water Resour. 2000;23:765–772. [Google Scholar]
- Jacob DJ, Field BD, Li Q, Blake DR, de Gouw J, Warneke C, Hansel A, Wisthaler A, Singh HB, Guenther A. Global budget of methanol: Constraints from atmospheric observations. J. Geophys. Res. 2005;110:D08303. doi:10.1029/2004jd005172. [Google Scholar]
- Janson RW. Monoterpene emissions from scots pine and norwegian spruce. J. Geophys. Res. 1993;98:2839–2850. [Google Scholar]
- Kaimal JC, Finnigan JJ: Atmospheric Boundary Layer Flows. Oxford University Press; Oxford: 1994. p. 289. [Google Scholar]
- Karl T, Guenther A, Lindinger C, Jordan A, Fall R, Lindinger W. Eddy covariance measurements of oxygenated volatile organic compound fluxes from crop harvesting using a redesigned proton-transfer-reaction mass spectrometer. J. Geophys. Res. 2001;106(D20):24157–24167. doi:10.1029/2000jd000112. [Google Scholar]
- Karl T, Curtis AJ, Rosenstiel TN, Monson RK, Fall R. Transient release of acetaldehyde from tree leaves – products of a pyruvate overflow mechanism? Plant Cell Environ. 2002a;28:1121–1131. [Google Scholar]
- Karl TG, Spirig C, Rinne J, Stroud C, Prevost P, Greenberg J, Fall R, Guenther A. Virtual disjunct eddy covariance measurements of organic compound fluxes from a subalpine forest using proton transfer reaction mass spectrometry. Atmos. Chem. Phys. 2002b;2:279–291. http://www.atmos-chem-phys.net/2/279/2002/ [Google Scholar]
- Karl T, Potosnak M, Guenther A, Clark D, Walker J, Herrick JD, Geron C. Exchange processes of volatile organic compounds above a tropical rain forest: Implications for modeling tropospheric chemistry above dense vegetation. J. Geophys. Res. 2004;109:D18306. doi:10.1029/2004JD004738. [Google Scholar]
- Kesselmeier J. Exchange of short-chain oxygenated volatile organic compounds (VOCs) between plants and the atmosphere: A compilation of field and laboratory studies. J. Atmos. Chem. 2001;39:219–233. [Google Scholar]
- Kirstine W, Galbally I, Ye Y, Hooper M. Emissions of volatile organic compounds (primarily oxygenated species) from pasture. J. Geophys. Res. 1998;103(D9):10605–10619. doi:10.1029/97jd03753. [Google Scholar]
- Kulmala M, Suni T, Lehtinen KEJ, Dal Maso M, Boy M, Reissell A, Rannik Ã, Aalto P, Keronen P, Hakola H, Bäck J, Hoffmann T, Vesala T, Hari P. A new feedback mechanism linking forests, aerosols, and climate. Atmos. Chem. Phys. 2004;4:557–562. http://www.atmos-chem-phys.net/4/557/2004/ [Google Scholar]
- Lindinger W, Hansel A, Jordan A. On-line monitoring of volatile organic compounds at pptv levels by means of proton-transfer-reaction mass spectrometry (ptr-ms) medical applications, food control and environmental research. Int. J. Mass Spectrom. Ion Proc. 1998;173:191–241. [Google Scholar]
- Loreto F, Barta C, Brilli F, Nogues I. On the induction of volatile organic compound emissions by plants as consequence of wounding or fluctuations of light and temperature. Plant Cell Environ. 2006;29:1820–1828. doi: 10.1111/j.1365-3040.2006.01561.x. [DOI] [PubMed] [Google Scholar]
- Massman WJ. The attenuation of concentration fluctuations in turbulent flow through a tube. J. Geophys. Res. 1991;96(D8):15259–15268. [Google Scholar]
- Massman WJ. A simple method for estimating frequency response corrections for eddy covariance systems. Agr. Forest Meteorol. 2000;104:185–198. [Google Scholar]
- McMillen RT. An eddy correlation technique with extended applicability to non-simple terrain. Bound.-Lay. Meteorol. 1988;43:231–245. [Google Scholar]
- Moore CJ. Frequency response corrections for eddy correlation systems. Bound.-Layer Meteorol. 1986;37:17–35. [Google Scholar]
- Niinemets Ü, Loreto F, Reichstein M. Physiological and physicochemical controls on foliar volatile organic compound emissions. Trends Plant Sci. 2004;9:180–186. doi: 10.1016/j.tplants.2004.02.006. [DOI] [PubMed] [Google Scholar]
- Novick KA, Stoy PC, Katul GG, Ellsworth DS, Siqueira MBS, Juang J, Oren R. Carbon dioxide and water vapor exchange in a warm temperate grassland. Oecologia. 2004;138:259–274. doi: 10.1007/s00442-003-1388-z. [DOI] [PubMed] [Google Scholar]
- Ramanathan V, Crutzen PJ, Kiehl JT, Rosenfeld D. Aerosols, climate, and the hydrological cycle. Science. 2001;294:2119–2124. doi: 10.1126/science.1064034. doi:10.1126/science.1064034. [DOI] [PubMed] [Google Scholar]
- Rinne J, Taipale R, Markkanen T, Ruuskanen TM, Hellén H, Kajos MK, Vesala T, Kulmala M. Hydrocarbon fluxes above a scots pine forest canopy: Measurements and modeling. Atmos. Chem. Phys. 2007;7:3361–3372. http://www.atmos-chem-phys.net/7/3361/2007/ [Google Scholar]
- Sharkey TD, Loreto F. Water stress, temperature, and light effects on the capacity for isoprene emission and photosynthesis of kudzu leaves. Oecologia. 1993;95:328–333. doi: 10.1007/BF00320984. [DOI] [PubMed] [Google Scholar]
- Sillman S. The relation between ozone, NOx and hydrocarbons in urban and polluted rural environments. Atmos. Environ. 1999;33:1821–1845. [Google Scholar]
- Spirig C, Neftel A, Ammann C, Dommen J, Grabmer W, Thielmann A, Schaub A, Beauchamp J, Wisthaler A, Hansel A. Eddy covariance flux measurements of biogenic VOCs during echo 2003 using proton transfer reaction mass spectrometry. Atmos. Chem. Phys. 2005;5:465–481. http://www.atmos-chem-phys.net/5/465/2005/ [Google Scholar]
- Wohlfahrt G, Anfang C, Bahn M, Haslwanter A, Newesely C, Schmitt M, Drösler M, Pfadenhauer J, Cernusca A. Quantifying nighttime ecosystem respiration of a meadow using eddy covariance, chambers and modelling. Agr. Forest Meteorol. 2005;128:141–162. [Google Scholar]
- Wohlfahrt G, Hammerle A, Haslwanter A, Bahn M, Tappeiner U, Cernusca A. Seasonal and inter-annual variability of the net ecosystem CO2 exchange of a temperate mountain grassland: Effects of weather and management. J. Geophys. Res. 2008;113:D08110. doi: 10.1029/2007jd009286. doi:10.1029/2007jd009286. [DOI] [PMC free article] [PubMed] [Google Scholar]
- Wohlfahrt G, Haslwanter A, Hörtnagl L, Jasoni RL, Fenstermaker LF, Arnone JA, III, Hammerle A. On the consequences of the energy imbalance for calculating surface conductance to water vapour. Agr. Forest Meteorol. 2009;149:1556–1559. doi: 10.1016/j.agrformet.2009.03.015. [DOI] [PMC free article] [PubMed] [Google Scholar]


