

Abstract
We have previously described a mouse adipose tissue engineering model using a silicon chamber enclosing the superficial epigastric pedicle in a Matrigel based environment. We have shown that when Zymosan, a sterile inflammatory agent, is added to the chamber, angiogenesis and adipogenesis are significantly improved. As Zymosan interacts with toll-like receptors on macrophages, the role of macrophages in new tissue development in the tissue engineering chamber was assessed. Morphological and histological results showed that macrophages were presenting in high numbers at 2 weeks but had decreased significantly by 4 and 6 weeks in the chamber. Numerous immature new blood vessels had formed by 2 weeks, becoming more mature at 4 and 6 weeks. Immature adipocytes were visualized at 4 weeks and mature cells, at 6 weeks. To investigate the functional role of macrophages in the tissue engineering process, we knocked out the local macrophage population by inserting Clodronate liposomes in this chamber. This study shows for the first time that when macrophages are depleted, there is minimal new vascular and adipose tissue development. We propose a new theory for tissue engineering in which macrophages play a central role in both neovascularisation and adipogenesis.
Introduction
The repair of large soft-tissue defects after trauma or surgery still presents a major challenge for reconstructive surgery. The transfer of vascularised adipose tissue from other body sites is often used to reconstruct large defects; however, this can cause pain, scarring, and deformity at the donor site area.1 More desirable is the growth of vascularized adipose tissue in situ.
Matrigel, a basement membrane-rich extracellular matrix (ECM) derived from the Engelbreth-Holm-Swarm mouse sarcoma, promotes the differentiation of many different cell types as well as the outgrowth of differentiated cells from tissue explants.2 Matrigel consists primarily of laminin, collagen-IV, entactin, and perlecan. It contains several growth factors, including platelet-derived growth factor (PDGF), insulin growth factor, epidermal growth factor, transforming growth factor-beta (TGF-beta), and fibroblast growth factor-2 (FGF-2) and also other proteins such as amylase, transferring, and clusterin.2 It is a popular matrix that is used to investigate adipose tissue engineering in animal models. In most models, FGF-2 and heparin are added to Matrigel, improving angiogenic and adipogenic properties.3–6
We have developed a murine tissue engineering model that comprises a silicon chamber enclosing the superficial epigastric vascular pedicle in a Matrigel environment. The chamber has been used in several formats, closed,7 partially closed8, and in a delayed seeding model.9 We have demonstrated that new vascularized tissue forms in the chamber7 and that an open chamber, allowing contact with surrounding tissue, improves adipogenesis.8 Nevertheless, the closed chamber model offers a controlled environment to which small changes can be applied and evaluated for their influence on tissue growth. We recently demonstrated that adding Zymosan, a sterile inflammogen, to a Matrigel matrix in this closed model improves angiogenesis and adipogenesis, strongly suggesting that inflammatory cells/mediators are involved in these processes.10
This study aims at characterizing the specific role that macrophages play in vascularized adipose tissue development. There are many arguments for a role of macrophages in blood vessel formation. The first evidence for this was observed over three decades ago, when Clark et al. demonstrated that the injection of wound fluid macrophages into rabbit corneas induced neo-vessel formation.11 Macrophages have been identified as key players in the local degradation of ECM proteins and the onset of neovascularization.12,13 Their involvement in adipogenesis is, however, less investigated. We hypothesize that macrophages play an important functional role in the mouse adipose tissue engineering model and that exclusion/reduction of macrophages in the chamber results in less new adipose tissue growth.
In this study, the presence of macrophages was investigated in the Zymosan mouse tissue engineering chamber at different time points. Next, macrophages were blocked using liposomes containing Bisphosphonate Clodronate. Clodronate liposomes are known to cause depletion of macrophages via apoptosis in vivo.14,15 All chambers were assessed for macrophage presence and tissue growth at different time points.
Materials and Methods
Animals
All animal experiments were approved by the St. Vincent's Hospital Animal Ethics Committee and conducted in accordance with the National Health and Medical Research Council (Australia) Guidelines. The mice used in this study were transgenic Mac Green mice. In these mice, all cells of the monocyte/macrophage lineage express enhanced green fluorescent protein, enabling visualization with immunofluorescence as an alternative in case F4/80 macrophage staining is not practical/sufficient.16 The original breeding pairs were obtained from Professor David Hume from the Institute for Molecular BioScience, University of Queensland. Male mice (weight 20–32 g) were used for this experiment. Mice were kept on a 12 h day–night cycle with a steady environmental temperature of 22°C and were fed normal chow and water ad libitum.
Materials
Growth factor-reduced Matrigel™ was purchased from BD Biosciences. Five hundred microliter of Matrigel was supplemented with 10 μL FGF-2 (recombinant human FGF-2, 0.5 mg/mL; Peprotech, Inc.) and 40 μL Heparin (Heparin Sodium Injection, USP [1000 U/mL]; Pharmacia and Upjohn). Immediately before use, Zymosan (Sigma-Aldrich Co.) was suspended in sterile normal saline at a concentration of 1.31 μg/mL. About 22.5 μL of this concentration was added to 125 μL of the Matrigel/FGF-2/Heparin mix, resulting in a final Zymosan concentration of 0.2 μg/mL, and stored on ice.
Clodronate Bisphosphonate was obtained from Roche Diagnostics GmbH. Clodronate liposomes and phosphate-buffered saline (PBS) liposomes were obtained from Professor Nico van Rooijen (Department of Molecular Cell Biology, Faculty of Medicine). Liposomes were stored at 4°C. Before use, they were allowed to reach room temperature and shaken gently to homogenize the suspension. PBS liposomes were labeled with DiI in our laboratory as follows. Twenty microliter ethanol 100% was added to 50 μg DiI (Molecular Probes) and sonicated for 1 min in a waterbath at 35 kHz. A ten-microliter DiI solution was added per milliliter liposome suspension and shaken thoroughly. The suspension was incubated for 10 min at room temperature in the dark. Liposomes were then centrifuged at 17,000 g for 10 min, and the supernatant was removed. The liposomes were resuspended in sterile PBS (0.012 M phosphate, 0.8% sodium chloride, and pH 7.4). The liposomes were then centrifuged at 17,000 g for 10 min. Sterile PBS was added to the original volume. Clodronate liposomes and DiI-labeled PBS liposomes were concentrated by centrifugation at 17,000 g for 10 min, to a concentration of 24 mg/mL.
Surgery
In the first experiment, three groups of mice (n=6/group) were implanted with silicon chambers. General anesthesia was induced by an intraperitoneal injection of chloral hydrate (0.4 mg/g body weight; Merial). Carprofen (Pfizer) was given subcutaneously for postoperative analgesia (5 mg/kg body weight). General anaesthesia was maintained by inhaled isoflurane (Abbot Australia Pty Ltd.) in combination with oxygen.
Sealed cylindrical silicon chambers with a length of 5 mm, an internal diameter of 3.35 mm, and a volume of 44 μL (Dow-Corning Corp.) were inserted into the groin, ensleeving the flow-through superficial epigastric pedicle according to a slightly modified version of the method described by Cronin et al. (2002). The chamber was filled with a mixture of Matrigel, FGF-2, Heparin, and Zymosan as described, and sealed at both ends using bone wax (Fig. 1).
FIG. 1.

The mouse chamber model. (A) Cylindrical silicone chambers with a length of 5 mm, an internal diameter of 3.35 mm, and a volume of 44 μL are used. (B, C) The chamber is inserted into the right groin, ensleeving the superficial epigastric artery and vein (both originating from the femoral vessels and leading towards a groin fat pad). (D) The chamber is sealed using bone wax. Between sealing of the distal end and the proximal end, the chamber can be filled according to the study design. Color images available online at www.liebertpub.com/tea
A second experiment looked at the effect of knocking out the macrophages using Clodronate liposomes. Groups with local administration of Clodronate liposomes (blocked group) and local administration of DiI-labeled PBS liposomes (Liposome Control) at 2 and 6 week timepoints were added (n=6/group). For this, 5 μL of a Clodronate Liposomes concentration or 5 μL DiI-labeled PBS liposome concentration (both concentrations: 24 mg/mL) was pipetted into the chamber followed by gentle mixing.
All the chambers were implanted in the right groin of each animal as described earlier. Chambers without Zymosan were implanted in the contralateral side.
Harvest and assessment
Chamber tissues were harvested at 2, 4, or 6 week time points under general anesthesia. Infected constructs or constructs with thrombosed vessels were excluded from the study. The mice were euthanized, the chambers were removed, and the tissue constructs were weighed. Volume was assessed by volume displacement in saline at room temperature as described earlier.17
Constructs were fixed overnight in 4% paraformaldehyde, then processed routinely to paraffin wax. When tissue was deemed too fragile, it was fixed within the silicon chamber. Serial 5 μm paraffin sections were made parallel to the longitudinal axis of each chamber, and these were either mounted on 3-aminopropyltriethoxysilane (Sigma-Aldrich)—coated or on poly-l-lysine-coated glass slides (Menzel GmbH and Co KG) and left for drying overnight.
Routine hematoxylin and eosin (H&E) staining was performed every 20th section, and slides were dehydrated, then cleared, and coverslipped with DPX mounting medium (BDH Chemicals).
Cryosectioning
The chamber construct, liver, and spleen of one extra animal in each group were prepared for cryosectioning. Tissues were fixed in 4% paraformaldehyde for 2 h at 4°C and then transferred to 18% sucrose solution overnight. They were then embedded in Tissue-Tek O.C.T compound, snap frozen in liquid nitrogen, and stored at−80°C before sectioning. Sections were cut using a Cryocut 1800 (Reichert-Jung) at 5 μm thickness and mounted on poly-l-lysine-coated slides.
Immunohistochemistry
For each paraffin sample, CD31 labeling was performed on every 20th section, while F4/80 was performed on the middle slide of each construct. Sections were dewaxed and hydrated according to a standard lab protocol, and immunohistochemical staining was performed using antibodies directed against CD31 or F4/80. All staining was performed using a Dako Autostainer (Dako Corporation), and reagents were purchased from Dako unless otherwise stated. Tris buffered saline+0.05% tween was used as rinse buffer and diluent. Endogenous peroxidase was blocked using peroxidase block, and enzyme label was detected using 3,3′-diaminobenzidine (DAB) chromagen for 3–5 min. For negative controls, nonspecific immune immunoglobulin at the same concentration was substituted for the primary antibody.
For CD31 (rat anti-mouse CD31; BD Pharmingen), sections were digested with proteinase K for 8 min, and nonspecific binding was blocked using protein block for 30 min. The primary antibody was applied at 1:150 in antibody diluent for 1 h, followed by the secondary antibody (rabbit anti-rat biotinylated-immunoglobulin) at 1:300 in the same diluent for 30 min. An avidin-biotin-horse radish peroxidase (HRP) detection system (ABC Elite; Vector Laboratories) was used for 30 min, followed by DAB color development.
For F4/80 (rat anti-mouse F4/80; Abcam), sections were digested with proteinase K for 3 min and blocked with 10% normal swine serum for 30 min. Primary antibody was diluted to 1:500 in 5% normal rabbit serum and incubated for 60 min. This was followed by rabbit anti-rat biotin 1:200 for 30 min, HRP-streptavidin at 1:400 for 30 min, and DAB.
For smooth muscle actin (SMA; mouse anti-human alpha SMA, clone 1A4), primary antibody was diluted in Dako antibody diluent at 1:500 for 30 min, followed by Dako mouse envision for 30 min and DAB.
For all stains, sections were counterstained in hematoxylin, dehydrated, and coverslipped using DPX mounting medium.
Histomorphometry
To determine the percentage of new adipose tissue, residual matrix, and fibrous granulation tissue, histomorphometry was performed on H&E stained sections (every 20th section). Calculation of vascular percentage and total vascular volume was performed on CD31-labeled sections (two sections of each chamber tissue [400 μm] apart). An Olympus BH-2 microscope and video camera was used in conjunction with the Computer-Assisted Stereological Toolbox System (CAST System; Olympus) for point counting on the sections. ImageJ18 was used to estimate macrophage density on F4/80-stained sections. Due to high density and some foreign body giant cell formation against the silicon, point counting could not be performed satisfactorily. Since macrophages were found to be distributed homogenously within the tissue construct, an image was captured using a Zeiss Axioskop 2 microscope, an Axiocam digital camera, and a 20×objective from the central portion of the middle section of the construct for semi-quantitative analysis. Briefly, color images were split into their RGB components and the blue image used for analysis; threshold values were set for each image separately in order to segment only DAB-labeled pixels. All analysis was performed in a blind fashion with regard to groups to minimize bias.
DiI-labeled cells were visualized on the cryosections using an appropriate filter set on a Zeiss microscope. Bright field and fluorescent photomicrographs were merged using ImageJ.
Absolute volumes of each tissue type were calculated from the proportion of each tissue and the total wet construct volume. Shrinkage due to histological processing was assumed to be constant for all tissue types and groups.
Statistical analysis
Statistical analysis was performed using SPSS statistical software (IBM SPSS 21.0 IBM Corp.). Results were compared using one- or two-way analysis of variance and a post hoc Student–Newman–Keuls, Tukey's test and t-test if appropriate. p-Values<.05 are considered statistically significant. Standard deviations (±) are given throughout.
Results
All animals remained healthy over the course of the study. Some animals in the 2 week groups lost weight most probably due to the immediate postoperative weight loss often seen in surgery. All chamber vessels were patent at time of harvest. One chamber was infected and, therefore, excluded from the study. Since the results of the chambers with and without Zymosan were similar for all study endpoints, the separate data of the nonZymosan groups is not shown. This observation is, however, discussed in the “Discussion” section.
There was no macroscopic difference between constructs of all nondepleted groups; chambers of both the Control and the Liposome Control group filled to about one third with white to yellow rubbery cylindrical tissue structures. In the Clodronate group, on the other hand, constructs consisted of jelly-like material. In terms of scarring, there was a fibrotic capsule present in reaction to the silicon chambers in all nondepleted groups. Microscopically, this capsule consisted of immature scar tissue at 2 weeks, becoming more mature with more collagen deposition and lesser myofibroblasts present at 6 weeks. In the Clodronate group, on the other hand, there was no capsule present.
Experiment 1: trends in Zymosan chambers (=control group) between 2, 4, and 6 weeks
High numbers of macrophages were visualized in the chambers at 2 weeks (Fig. 2) with most macrophages seen in close proximity to a seemingly cleared matrix (Fig. 3A). Groups of macrophages were also visualized outlining longitudinal cords of endothelial cells (Fig. 3B), suggesting a possible role in neovascularization. While abundant at 2 weeks, significantly less macrophages were present at 4 and 6 weeks (31.5±12.1% at 2 weeks vs. 14.1±3.8% at 4 weeks and 10.7±2.8% at 6 weeks p≤0.0005) (Fig. 2) with macrophages at 6 weeks being mainly present adjacent to adipocytes (Fig. 4). In terms of vascularization, numerous immature blood vessels had formed within the construct at 2 weeks. At later time points, this vascular volume tissue fraction remained stable (13.5±3.3% at 2 weeks vs. 12.0±3.5% at 4 weeks vs. 12.9±6.8% at 6 weeks, p=0.865) (Fig. 5); however, with the blood vessels becoming more mature, thicker smooth muscle walls could be observed on α-SMA-stained sections, especially close to the pedicle.
FIG. 2.

Macrophage density (expressed as a percentage of the total chamber tissue, mean±standard deviation [SD]). Macrophage density in the mouse adipose tissue engineering chambers at 2, 4, and 6 weeks (=control group). Significantly higher numbers of macrophages are present in the chamber at 2 weeks (31.5±12,1%), compared with the 4 and 6 week time points (14.1±3.8% at 4 weeks and 10.7±2.8% at 6 weeks). p≤0.0005, one-way analysis of variance (ANOVA), Student–Newman–Keuls post hoc test.
FIG. 3.
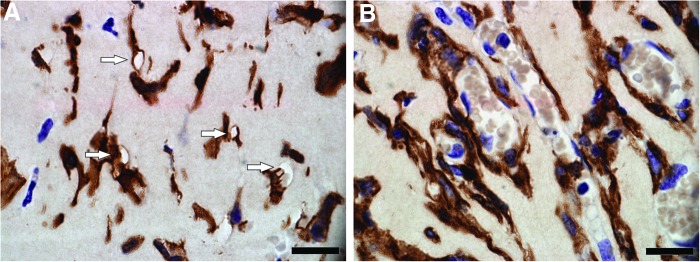
F4/80-stained section of the chamber construct at 2 weeks. Scale bar=20 μm. Areas of seemingly cleared matrix are visualized (arrows), most of these areas are in direct contact with macrophages (dark brown cells) (A). Groups of macrophages (dark brown cells) outlining longitudinal cords of endothelial cells (purple cells) surrounding erythrocytes (light brown cells) are seen (B). Color images available online at www.liebertpub.com/tea
FIG. 4.
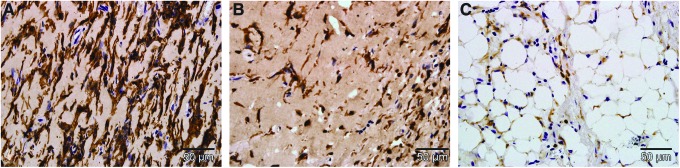
F4/80-stained section of the chamber tissue at different timepoints. Scale bar=50 μm. Substantially higher numbers of macrophages (dark brown cells) are visualized in the chamber at 2 weeks (A), compared with the 4 (B) and 6 week time points (C). Color images available online at www.liebertpub.com/tea
FIG. 5.

Vascular tissue and neoadipose tissue volume fraction in the mouse adipose tissue engineering chamber tissue at 2, 4, and 6 weeks (=control group, expressed as a percentage of the total amount of tissue, mean±SD). No significant difference in vascular tissue density was observed between the three time points (13.5±3.3% at 2 weeks, 12.0±3.5% at 4 weeks, and 12.9±6.8% at 6 weeks). p=0.865, one-way ANOVA, Student–Newman–Keuls post hoc test. The percentage of new adipose tissue increased significantly between 2, 4, and 6 weeks (0% at 2 weeks, 17.9±9.8% at 4 weeks, and 38.3±17.3% at 6 weeks). p≤0.0005, one-way ANOVA, Student–Newman–Keuls post hoc test.
No adipocytes were seen at 2 weeks (Fig. 6A), while the first adipocytes appeared at 4 weeks (Fig. 6B), mostly seen as clusters of immature cells with multilocular cytoplasm with some mature adipocytes visualized close to the pedicle. The adipose tissue observed at 6 weeks was overall more mature (Fig. 6C). The percentage of new adipose tissue increased significantly between 2, 4, and 6 weeks (0% at 2 weeks vs. 17.9±9.8% at 4 weeks vs. 38.3±17.3% at 6 weeks, p≤0.0005) (Fig. 5).
FIG. 6.
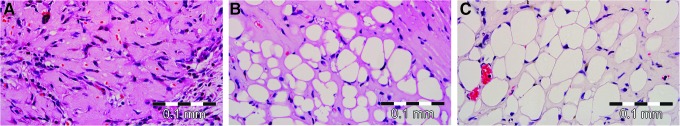
Adipogenesis in the chamber tissue demonstrated on an hemotoxylin & eosin-stained section at different time points. Scale bar=0.1 mm. No adipocytes are visualized at 2 weeks (A), mostly immature adipocytes are seen at 4 weeks (B), and larger more mature adipocytes are seen at 6 weeks (C). Color images available online at www.liebertpub.com/tea
In summary, tissue that was present in the chamber at 2 weeks, mostly Matrigel and connective tissue, was gradually replaced by adipose tissue over the course of 6 weeks in the mouse tissue engineering chamber. Macrophages infiltrate the tissue at an early stage, being abundantly present at 2 weeks; however, their numbers are reduced at 4 and 6 weeks (Fig. 7).
FIG. 7.

Breakdown of the tissue content of the chamber at 2, 4, and 6 weeks (=control group). Vascular tissue volume fraction, macrophage density, adipose tissue volume fraction, and other tissue density are expressed as a percentage of the total tissue within the chamber tissue. Matrigel and other tissue, mostly comprising collagen, fibroblasts, and inflammatory cells, are gradually replaced by new adipose tissue.
Experiment 2: differences after depleting macrophages. Adding liposomes to the chamber, either filled with PBS as a control (Liposome Control group) or filled with Clodronate to deplete macrophages (Clodronate group), time points 2 and 6 weeks
The local depletion of macrophages did not appear to influence mouse well-being, with all animals remaining healthy over the course of the study. Furthermore, no significant difference could be detected in weight gain between both groups (t-test comparing ratio of pre to postweights for the Local DiI versus Local Clodr, 95% confidence interval (CI) 0.99–1.07 and p=0.089 at 2 weeks and 95% CI 0.94–1.08, p=0.735 at 6 weeks).
Macroscopically, chamber constructs from the Liposome Control group at 6 weeks did not appear to differ from the Control group chambers from Experiment 1; they consisted of strong ovoid, white to yellow rubbery tissue structures that filled approximately one-third of the chamber on both sides (Fig. 8A). The tissue within the Clodronate chambers (=macrophage depletion group), on the other hand, consisted of unstable jelly-like material without a capsular structure (Fig. 8B). This tissue was technically difficult to handle without destroying the structural features.
FIG. 8.
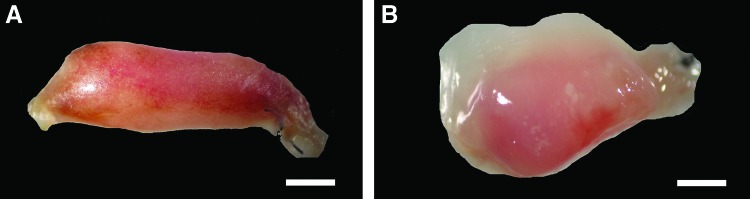
Macroscopic appearance of the tissue grown in the Liposome Control and Clodronate chambers at 6 weeks. Scale bar=1 mm. Chamber constructs in the Liposome Control group (A) consist of strong ovoid structures that fill approximately one-third of the chamber on both sides. The tissue within the Clodronate chambers (B) consists of unstable jelly-like material without a capsular structure. Color images available online at www.liebertpub.com/tea
Microscopically, vascularized adipose tissue was present in the Liposome Control group at 6 weeks (Fig. 9A, C), while the tissue in the Clodronate group consisted mostly of amorphous eosinophilic Matrigel with empty spaces showing degeneration of the matrix and edema (Fig. 9B, D). Compared with the original Control group (Fig. 10A), substantially more macrophages were present in the Liposome Control group (Fig. 10B) and only very few were located in the Clodronate group (Fig. 10C) at 2 weeks. All these differences were significant (53.0±5.7% in the Liposome Control group vs. 31.5±12.4% in the Control group p=0.001, 5.5±5.2% in the Clodronate group vs. the Control group or the Liposome Control group, p<0.0005) (Fig. 11). While the majority of the macrophages were depleted in the Clodronate chambers, a massive neutrophil infiltration was noted. At 6 weeks, macrophage numbers were decreased in all groups compared with the numbers at 2 weeks, but a significant difference in macrophage presence was still observed between the Clodronate group (2.6±3.3%) when compared with the Liposome Control group (12.1±2.8%) or the Control group (10.7±2.8%), p<0.0005. At this time point, however, there is no significant difference between the original Control group and the Liposome Control group (p=0.68) (Fig. 11). All the sparse macrophages observed in the Clodronate chambers were in small clusters close to the pedicle and had a rounded appearance, so they were presumably inactive and/or undergoing apoptosis.
FIG. 9.

Microscopic appearance of the tissue grown in the Liposome Control and Clodronate chambers at 6 weeks. Scale bar=0.1 mm. (A, C) hematoxylin and eosin-stained sections of the chamber tissue at 6 weeks. In the Liposome Control group, adipose tissue has formed, blood vessel lumens can be seen in the sections (arrows), with some containing red blood cells (A); while the tissue in the Clodronate group consists mostly of amorphous eosinophilic Matrigel with empty spaces showing degeneration of the matrix and oedema (C). (B, D) CD31-stained sections of the chamber tissue at 6 weeks. Well-vascularized tissue is seen in the Liposome Control chamber. Blood vessel walls are stained dark brown, and lumens are visible (arrows) (B), while avascular tissue is seen in the Clodronate chamber (D). Color images available online at www.liebertpub.com/tea
FIG. 10.
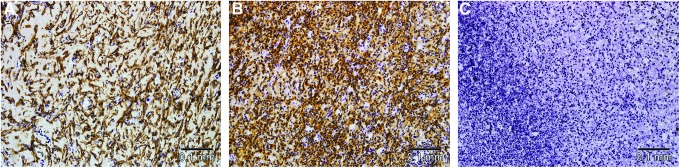
F4/80-stained section of the chamber tissue in the control group, the Liposome Control group and the Clodronate group at 2 weeks. Scale bar=0.1 mm. In the control group, macrophages are visualized as longitudinal brown cells radiating through the Matrigel matrix (A). Compared with the control group, substantially more macrophages are seen in the Liposome Control group (B), and only a few are observed in the Clodronate group (C) where massive neutrophil infiltration is noted. Color images available online at www.liebertpub.com/tea
FIG. 11.

Macrophage density (expressed as a percentage of the total chamber tissue, mean±SD) in the chamber tissue in the three study groups at 2 and 6 weeks. The macrophage density in the Clodronate group at 2 weeks (5.5±5.2%) and 6 weeks (2.6±3.3%) is significantly less than the density in their respective control groups (31.5±12.4% at 2 weeks, p<0.0005 and 10.7±2.8% at 6 weeks, and p≤0.0005) and Liposome Control groups (53.0±5.7% at 2 weeks, p≤0.0005 and 12.1±2.8% at 6 weeks, p≤0.0005). At 2 weeks, significantly more macrophages were recruited to the Liposome Control chambers compared with the control chambers (p=0.001); however, at 6 weeks, there is no significant difference (p=0.68). One-way ANOVA, Tukey's post hoc test.
In terms of vascularization, at 2 weeks, numerous blood vessels were visualized on CD31-stained sections in the Control group (Fig. 12A) and the Liposome Control group (Fig. 12B), and this was also seen at 6 weeks. At both time points, the vascular density in the Liposome Control group did not significantly differ from the Control group (13.7±8.9% vs. 13.5±3.3% at 2 weeks, p=0.053 and 15.1±5.8% vs. 12.9±6.8% at 6 weeks, p=0.77) (Fig. 13). In comparison, very few blood vessels developed in the Clodronate groups (Fig. 12C); this difference was just significant at 2 weeks (3.7±3.6% in the Clodronate group vs. 13.5±3.3% in the Control group and 13.7±8.9% in the Liposome Control group, p=0.053) but was found to be significant at 6 weeks (3.5±4.4% in the Clodronate Group vs. 12.9±6.8% in the Control group, p=0.023 and 3.5±4.4% in the Clodronate group vs. 15.1±5.8% in the Liposome Control group, p=0.006) (Fig. 13).
FIG. 12.
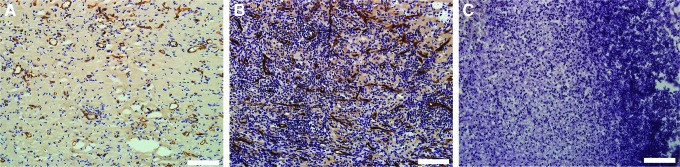
CD 31-stained section of the chamber tissue in the control group, the Liposome Control group and the Clodronate group. Scale bar=0.1 mm. In the control group (A) and the Liposome Control group (B), numerous blood vessels are visualized (dark brown structures); however, very few blood vessels have developed in the Clodronate group (C). Color images available online at www.liebertpub.com/tea
FIG. 13.

Vascular volume fraction (expressed as a percentage of the total amount of tissue, mean±SD) at 2 and 6 weeks in the different study groups. Very few new blood vessels developed in the Clodronate group at 2 weeks (3.7±3.6%) and 6 weeks (3.5±4.4%). At 6 weeks, this amount was significantly less compared with the Liposome Control groups (3.5±4.4% vs. 15.1±5.8, p=0.006) and the control group (3.5±4.4% vs. 12.9±6.8%, p=0.023). At both time points, the vascular density in the Liposome Control group did not significantly differ from the control group (13.7±8.9% vs. 13.5±3.3% at 2 weeks, p=0.053 and 15.1±5.8% vs. 12.9±6.8% at 6 weeks, and p=0.77). One-way ANOVA, followed with Tukey's post hoc test when appropriate.
The amount of new adipose tissue that developed at 6 weeks was also significantly less in the Clodronate chambers than in the Liposome Control group (3.4±4.0% vs. 41.3±17.1%, p<0.0005) and the Control group (3.4±4.0% vs. 38.4±17.3%, p=0.001). Once again, the original Control group and the Liposome Control group did not significantly differ from each other in terms of adipose tissue growth (p=0.93) (Fig. 14).
FIG. 14.

Neoadipose tissue volume fraction (expressed as a percentage of the total amount of tissue, mean±SD) within the chamber at 6 weeks in the different study groups. The amount of new adipose tissue that developed in the Clodronate chambers (3.4±4.0%) is significantly less than in the Liposome Control chambers (41.3±17.1%, p<0.0005) and the control chambers without liposomes (38.4±17.3%, p=0.001). The amount of vascularized adipose tissue developed in the chambers of the Liposome Control group did not significantly differ from the control group without any liposomes (p=0.93). One-way ANOVA, Tukey's post hoc test.
In summary, at 6 weeks, significantly more blood vessels, macrophages, and adipose tissue were present in the chambers in which macrophages were not depleted, compared with the tissue constructs of the Clodronate chambers (Fig. 15).
FIG. 15.

Breakdown of the tissue content of the chamber in the different study groups at 6 weeks. Vascular tissue volume fraction, macrophage density, adipose tissue volume fraction, and other tissue density are expressed as a percentage of the total tissue within the chamber tissue. In the chambers of the control group and the Liposome Control group, significantly more vascular tissue, macrophages and adipose tissue are present, compared with the Clodronate group.
Discussion
Our results show that when macrophages are eliminated in the mouse tissue engineering chamber, minimal new blood vessels and adipose tissue develop. A role for macrophages is assumed in local degradation of the ECM, the onset of angiogenesis, and the regulation of adipogenesis.
At 2 weeks, macrophages were present in high density in the tissue engineering chamber constructs, bordering mainly cleared areas within the Matrigel. This suggests their involvement in degradation of the ECM. Structures such as cell columns of endothelial cells outlined by macrophages could also be visualized. At both 4 and 6 weeks, fewer macrophages were present and were located in close proximity to both immature and mature adipocytes. These results are consistent with the findings of Moldovan19 and Anghelina et al.12,13, who documented that monocytes/macrophages first invade the matrix and form tunnels while clearing ECM along their path. Later on, collagen fibers and other types of cells such as erythrocytes, endothelial cells, and adipocytes are visualized in these macrophage-lined tunnels, indicating their development into perfused capillary-like structures and vascularized adipose tissue.12,13,19 While macrophage invasion may be initiated by FGF-2 present within the matrix,13 cell trauma and necrosis caused by surgical dissection of the pedicle can also result in release of inflammatory mediators20 and subsequent recruitment of macrophages, as well as the recognition of Zymosan. Interestingly, in this study, we saw that the chambers in the contralateral groin, containing Matrigel but not Zymosan, showed similar tissue growth, including vascularization and development, as the chambers containing Zymosan at all study endpoints (results not shown). This confirms that the response to Zymosan is most likely a systemic inflammatory response as demonstrated by the previous study by Thomas et al.10 and, therefore, influencing both chambers in the same animal. The contralateral chambers in this study could, therefore, not be considered a true control without Zymosan, and results are not shown.
Once initiated, angiogenesis is controlled by an interplay of many different regulation systems. Activated macrophages can release pro-angiogenic factors such as VEGF, FGF-2, PDGF, and tumor necrosis factor-α.21–23 This activation of macrophages and release of pro-angiogenic factors can be triggered by a hypoxic environment.24 The Matrigel matrix used in our study forms a hypoxic environment during the first weeks, until sufficient neo-vascularisation takes place within the matrix. Macrophages are also known to produce anti-angiogenic agents such as Angiostatin25 and Thrombospondin depending on their activated state.26 An indirect way for macrophages to regulate angiogenesis is through remodeling of the ECM. The local proteolytic degradation of the ECM by macrophages can release growth factors that are stored within the ECM such as FGF-2, VEGF, and TGF-beta.27 Metalloelastase, produced by macrophages, is also seen to generate the anti-angiogenic factor angiostatin from plasminogen stored in the ECM.28 Remodeling the ECM also yields fragments of constituent proteins that can have effects on the angiogenic process such as the angiogenesis inhibitor endostatin, which is a fragment of collagen XVIII29,30 Since Matrigel is an ECM material that also forms a hypoxic environment, we believe that all these control mechanisms could potentially play a role in the neovascularization process in our model.
In this study, we used Clodronate liposomes to deplete macrophages. These are well known in vivo to cause selective depletion of macrophages via apoptosis.31,32 This process does not induce macrophage activation or release of inflammatory mediators.14,15,33 When macrophages were depleted locally in the chamber, minimal angiogenesis and adipogenesis took place. This strongly suggests a critical role of macrophages in the adipose tissue engineering chamber model, hereby confirming previous studies by our laboratory demonstrating that when monocyte chemoattractant protein-1 (MCP-1), a monocyte/macrophage chemoattractant, is added to the mouse tissue engineering chamber, large quantities of new vascularized adipose tissue are generated.34 Neovascularization is reduced not only in chambers with Clodronate in our study, but also in other studies where macrophage recruitment was blocked. For example, it has been demonstrated that the depletion of macrophages leads to reduced choroidal neovascularization,32 and macrophage blocking as tumor treatment results in smaller tumors with more scarce vascular structures in mice.31
Angiogenesis and adipogenesis are closely related during fetal development35 and in adult neoadipogenesis.3,36,37 From our results, one could argue that macrophages only play a direct role in angiogenesis in the tissue engineering model and that the perceived neoadipogenesis is simply a result of increased angiogenesis, without further involvement of macrophages. There are, however, arguments for macrophages playing a role in the adipogenesis process as well. Mature adipocytes are not capable of proliferation in vivo, and their regeneration depends on proliferation of adipose progenitor cells.38,39 A few of the factors controlling the proliferation and differentiation of preadipocytes/progenitor cells are not yet known. FGF-2 has been shown to induce preadipocyte proliferation and inhibit pre-adipocyte differentiation in vitro.40,41 Macrophages can regulate FGF-2 levels, either through direct secretion or via release from the ECM by proteolysis. Besides FGF-2, Activin A, expressed by adipose progenitors, is also known to regulate the number of progenitors. Activin A is expressed at higher levels in obese adipose tissue compared with expression levels in lean patients.39 Recent studies have shown that Activin A promotes proliferation of undifferentiated progenitors and inhibits adipocyte differentiation.39,42 Macrophages may also be involved in this process, as Activin A secretion in adipose stem cells and progenitors dramatically increases when macrophages derived from adipose tissue are present.39 Activin A can also be secreted by macrophages depending on their activation state.43 Due to their involvement in both FGF-2 and Activin secretion, it is likely that macrophages are important regulators in self-renewal of the pool of progenitor cells and, therefore, in regulation of the number of adipocytes. The link between macrophages and pre-adipocytes is also demonstrated in studies in which human macrophage medium stimulates proliferation of human pre-adipocytes in vitro,44,45 and macrophages can inhibit differentiation of CD34+/CD31− cells.39,46
A similar relationship between macrophages and adipogenesis is likely to be present in our Mouse Tissue Engineering Chamber. We observed that macrophages are present in large numbers in the chamber at 2 weeks. At the same time, neovascularization and (we believe) proliferation of stem cells and pre-adipocytes occurs. Later than 2 weeks, significantly fewer macrophages are present in the chamber tissue. Neovascularization reached a peak at the 2 week time point, remaining stable from then on, while the first immature adipocytes are visualized at 4 weeks. During the first 2 weeks, proliferation of progenitors predominates, while after this period, differentiation of progenitors into adipocytes is seen. It is very likely that reducing numbers of macrophages over time alter the state of the progenitor pool in the chamber. Whether macrophages apoptose, transform, or emigrate from the site when the inflammatory signals subside is still debated.47
The regulation of angiogenesis and adipogenesis by macrophages has important implications on the design of scaffolds for adipose tissue engineering, as many scaffolds are specifically designed to avoid inflammation and macrophage recruitment. From our results, we conclude that some inflammatory reaction is necessary to initiate the neovascularization and adipogenesis process; however, excessive inflammation should be avoided. This was confirmed in our previous study, where increasing doses of Zymosan led to higher levels of inflammation and lower tissue growth.10 In this study we noted that local PBS liposomes resulted in a higher density of macrophages in the chamber tissue compared with the control group at 2 weeks. While the PBS liposomes may have induced a more intense inflammatory process with a greater initial recruitment of macrophages, this did not result in any significant differences in vascular volume or total adipose tissue when compared with the control group, at any time point.
Conclusion
We have demonstrated that macrophages are early matrix invaders, playing a key role in local degradation of the ECM and the onset of neovascularization and adipogenesis. We have shown for the first time that when macrophages are eliminated in the mouse tissue engineering chamber, minimal new blood vessels and minimal new adipose tissue developed. We propose a new theory for tissue engineering models where macrophages play a central role in both neovascularization and the regulation of the adipose progenitor pool.
Acknowledgments
This work was supported in part by grant funding from the National Health and Medical Research Council of Australia (Grant # 454656) and also by the Victorian State Governments Department of Business Innovation Operational Infrastructure Support Plan. The authors acknowledge the surgical assistance of the staff of the Experimental Medical and Surgical unit, St. Vincent's Hospital, Melbourne, and the statistical help of Prof Anthony Penington.
Disclosure Statement
No competing financial interests exist.
References
- 1.Salmi A., et al. Morbidity of donor, recipient sites after free flap surgery. A prospective study. Scand J Plast Reconstr Surg Hand Surg. 1995;29:337. doi: 10.3109/02844319509008969. [DOI] [PubMed] [Google Scholar]
- 2.Kleinman H.K. Martin G.R. Matrigel: basement membrane matrix with biological activity. Semin Cancer Biol. 2005;15:378. doi: 10.1016/j.semcancer.2005.05.004. [DOI] [PubMed] [Google Scholar]
- 3.Kawaguchi N., et al. De novo adipogenesis in mice at the site of injection of basement membrane and basic fibroblast growth factor. Proc Natl Acad Sci U S A. 1998;95:1062. doi: 10.1073/pnas.95.3.1062. [DOI] [PMC free article] [PubMed] [Google Scholar]
- 4.Bashkin P., et al. Basic fibroblast growth factor binds to subendothelial extracellular matrix and is released by heparitinase and heparin-like molecules. Biochemistry. 1989;28:1737. doi: 10.1021/bi00430a047. [DOI] [PubMed] [Google Scholar]
- 5.Yayon A., et al. Cell surface, heparin-like molecules are required for binding of basic fibroblast growth factor to its high affinity receptor. Cell. 1991;64:841. doi: 10.1016/0092-8674(91)90512-w. [DOI] [PubMed] [Google Scholar]
- 6.Sommer A. Rifkin D.B. Interaction of heparin with human basic fibroblast growth factor: protection of the angiogenic protein from proteolytic degradation by a glycosaminoglycan. J Cell Physiol. 1989;138:215. doi: 10.1002/jcp.1041380129. [DOI] [PubMed] [Google Scholar]
- 7.Cronin K.J., et al. New murine model of spontaneous autologous tissue engineering, combining an arteriovenous pedicle with matrix materials. Plast Reconstr Surg. 2004;113:260. doi: 10.1097/01.PRS.0000095942.71618.9D. [DOI] [PubMed] [Google Scholar]
- 8.Kelly J.L., et al. Contact with existing adipose tissue is inductive for adipogenesis in matrigel. Tissue Eng. 2006;12:2041. doi: 10.1089/ten.2006.12.2041. [DOI] [PubMed] [Google Scholar]
- 9.Hussey A.J., et al. Seeding of pancreatic islets into prevascularized tissue engineering chambers. Tissue Eng Part A. 2009;15:3823. doi: 10.1089/ten.TEA.2008.0682. [DOI] [PubMed] [Google Scholar]
- 10.Thomas G.P., et al. Zymosan-induced inflammation stimulates neo-adipogenesis. Int J Obes (Lond) 2008;32:239. doi: 10.1038/sj.ijo.0803702. [DOI] [PubMed] [Google Scholar]
- 11.Clark R.A., et al. Role of macrophages in would healing. Surg Forum. 1976;27:16. [PubMed] [Google Scholar]
- 12.Anghelina M., et al. Monocytes and macrophages form branched cell columns in matrigel: implications for a role in neovascularization. Stem Cells Dev. 2004;13:665. doi: 10.1089/scd.2004.13.665. [DOI] [PubMed] [Google Scholar]
- 13.Anghelina M., et al. Monocytes/macrophages cooperate with progenitor cells during neovascularization and tissue repair: conversion of cell columns into fibrovascular bundles. Am J Pathol. 2006;168:529. doi: 10.2353/ajpath.2006.050255. [DOI] [PMC free article] [PubMed] [Google Scholar]
- 14.Van Rooijen N. Sanders A. Liposome mediated depletion of macrophages: mechanism of action, preparation of liposomes and applications. J Immunol Methods. 1994;174:83. doi: 10.1016/0022-1759(94)90012-4. [DOI] [PubMed] [Google Scholar]
- 15.van Rooijen N. van Kesteren-Hendrikx E. “In vivo” depletion of macrophages by liposome-mediated “suicide”. Methods Enzymol. 2003;373:3. doi: 10.1016/s0076-6879(03)73001-8. [DOI] [PubMed] [Google Scholar]
- 16.Sasmono R.T., et al. A macrophage colony-stimulating factor receptor-green fluorescent protein transgene is expressed throughout the mononuclear phagocyte system of the mouse. Blood. 2003;101:1155. doi: 10.1182/blood-2002-02-0569. [DOI] [PubMed] [Google Scholar]
- 17.Cassell O.C., et al. The influence of extracellular matrix on the generation of vascularized, engineered, transplantable tissue. Ann N Y Acad Sci. 2001;944:429. doi: 10.1111/j.1749-6632.2001.tb03853.x. [DOI] [PubMed] [Google Scholar]
- 18.Rasband W.S. ImageJ. Bethesda, MD: U.S. National Institutes of Health; [Google Scholar]
- 19.Moldovan N.I. Role of monocytes and macrophages in adult angiogenesis: a light at the tunnel's end. J Hematother Stem Cell Res. 2002;11:179. doi: 10.1089/152581602753658394. [DOI] [PubMed] [Google Scholar]
- 20.Scaffidi P. Misteli T. Bianchi M.E. Release of chromatin protein HMGB1 by necrotic cells triggers inflammation. Nature. 2002;418:191. doi: 10.1038/nature00858. [DOI] [PubMed] [Google Scholar]
- 21.Allavena P., et al. The Yin-Yang of tumor-associated macrophages in neoplastic progression and immune surveillance. Immunol Rev. 2008;222:155. doi: 10.1111/j.1600-065X.2008.00607.x. [DOI] [PubMed] [Google Scholar]
- 22.Salcedo R., et al. Vascular endothelial growth factor and basic fibroblast growth factor induce expression of CXCR4 on human endothelial cells: in vivo neovascularization induced by stromal-derived factor-1alpha. Am J Pathol. 1999;154:1125. doi: 10.1016/s0002-9440(10)65365-5. [DOI] [PMC free article] [PubMed] [Google Scholar]
- 23.Balkwill F. Mantovani A. Inflammation and cancer: back to Virchow? Lancet. 2001;357:539. doi: 10.1016/S0140-6736(00)04046-0. [DOI] [PubMed] [Google Scholar]
- 24.Murdoch C. Muthana M. Lewis C.E. Hypoxia regulates macrophage functions in inflammation. J Immunol. 2005;175:6257. doi: 10.4049/jimmunol.175.10.6257. [DOI] [PubMed] [Google Scholar]
- 25.Falcone D.J., et al. Macrophage formation of angiostatin during inflammation. A byproduct of the activation of plasminogen. J Biol Chem. 1998;273:31480. doi: 10.1074/jbc.273.47.31480. [DOI] [PubMed] [Google Scholar]
- 26.Jaffe E.A. Ruggiero J.T. Falcone D.J. Monocytes and macrophages synthesize and secrete thrombospondin. Blood. 1985;65:79. [PubMed] [Google Scholar]
- 27.Cordon-Cardo C., et al. Expression of basic fibroblast growth factor in normal human tissues. Lab Invest. 1990;63:832. [PubMed] [Google Scholar]
- 28.Cornelius L.A., et al. Matrix metalloproteinases generate angiostatin: effects on neovascularization. J Immunol. 1998;161:6845. [PubMed] [Google Scholar]
- 29.Felbor U., et al. Secreted cathepsin L generates endostatin from collagen XVIII. EMBO J. 2000;19:1187. doi: 10.1093/emboj/19.6.1187. [DOI] [PMC free article] [PubMed] [Google Scholar]
- 30.Crowther M., et al. Microenvironmental influence on macrophage regulation of angiogenesis in wounds and malignant tumors. J Leukoc Biol. 2001;70:478. [PubMed] [Google Scholar]
- 31.Gazzaniga S., et al. Targeting tumor-associated macrophages and inhibition of MCP-1 reduce angiogenesis and tumor growth in a human melanoma xenograft. J Invest Dermatol. 2007;127:2031. doi: 10.1038/sj.jid.5700827. [DOI] [PubMed] [Google Scholar]
- 32.Sakurai E., et al. Macrophage depletion inhibits experimental choroidal neovascularization. Invest Ophthalmol Vis Sci. 2003;44:3578. doi: 10.1167/iovs.03-0097. [DOI] [PubMed] [Google Scholar]
- 33.van Rooijen N. Sanders A. Elimination, blocking, and activation of macrophages: three of a kind? J Leukoc Biol. 1997;62:702. doi: 10.1002/jlb.62.6.702. [DOI] [PubMed] [Google Scholar]
- 34.Hemmrich K., et al. Monocyte chemoattractant protein-1 and nitric oxide promote adipogenesis in a model that mimics obesity. Obesity (Silver Spring) 2007;15:2951. doi: 10.1038/oby.2007.352. [DOI] [PubMed] [Google Scholar]
- 35.Crandall D.L. Hausman G.J. Kral J.G. A review of the microcirculation of adipose tissue: anatomic, metabolic, and angiogenic perspectives. Microcirculation. 1997;4:211. doi: 10.3109/10739689709146786. [DOI] [PubMed] [Google Scholar]
- 36.Toriyama K., et al. Endogenous adipocyte precursor cells for regenerative soft-tissue engineering. Tissue Eng. 2002;8:157. doi: 10.1089/107632702753503144. [DOI] [PubMed] [Google Scholar]
- 37.Fukumura D., et al. Paracrine regulation of angiogenesis and adipocyte differentiation during in vivo adipogenesis. Circ Res. 2003;93:e88. doi: 10.1161/01.RES.0000099243.20096.FA. [DOI] [PMC free article] [PubMed] [Google Scholar]
- 38.Hausman D.B., et al. The biology of white adipocyte proliferation. Obes Rev. 2001;2:239. doi: 10.1046/j.1467-789x.2001.00042.x. [DOI] [PubMed] [Google Scholar]
- 39.Zaragosi L.E., et al. Activin a plays a critical role in proliferation and differentiation of human adipose progenitors. Diabetes. 2010;59:2513. doi: 10.2337/db10-0013. [DOI] [PMC free article] [PubMed] [Google Scholar]
- 40.Yamashiro H., et al. Efficient proliferation and adipose differentiation of human adipose tissue-derived vascular stromal cells transfected with basic fibroblast growth factor gene. Tissue Eng. 2003;9:881. doi: 10.1089/107632703322495538. [DOI] [PubMed] [Google Scholar]
- 41.Navre M. Ringold G.M. Differential effects of fibroblast growth factor and tumor promoters on the initiation and maintenance of adipocyte differentiation. J Cell Biol. 1989;109:1857. doi: 10.1083/jcb.109.4.1857. [DOI] [PMC free article] [PubMed] [Google Scholar]
- 42.Hirai S., et al. Activin A inhibits differentiation of 3T3-L1 preadipocyte. Mol Cell Endocrinol. 2005;232:21. doi: 10.1016/j.mce.2005.01.001. [DOI] [PubMed] [Google Scholar]
- 43.Sierra-Filardi E., et al. Activin A skews macrophage polarization by promoting a proinflammatory phenotype and inhibiting the acquisition of anti-inflammatory macrophage markers. Blood. 2011;117:5092. doi: 10.1182/blood-2010-09-306993. [DOI] [PubMed] [Google Scholar]
- 44.Lacasa D., et al. Macrophage-secreted factors impair human adipogenesis: involvement of proinflammatory state in preadipocytes. Endocrinology. 2007;148:868. doi: 10.1210/en.2006-0687. [DOI] [PubMed] [Google Scholar]
- 45.Keophiphath M., et al. Macrophage-secreted factors promote a profibrotic phenotype in human preadipocytes. Mol Endocrinol. 2009;23:11. doi: 10.1210/me.2008-0183. [DOI] [PMC free article] [PubMed] [Google Scholar]
- 46.Bourlier V., et al. Remodeling phenotype of human subcutaneous adipose tissue macrophages. Circulation. 2008;117:806. doi: 10.1161/CIRCULATIONAHA.107.724096. [DOI] [PubMed] [Google Scholar]
- 47.Stout R.D., et al. Macrophages sequentially change their functional phenotype in response to changes in microenvironmental influences. J Immunol. 2005;175:342. doi: 10.4049/jimmunol.175.1.342. [DOI] [PubMed] [Google Scholar]