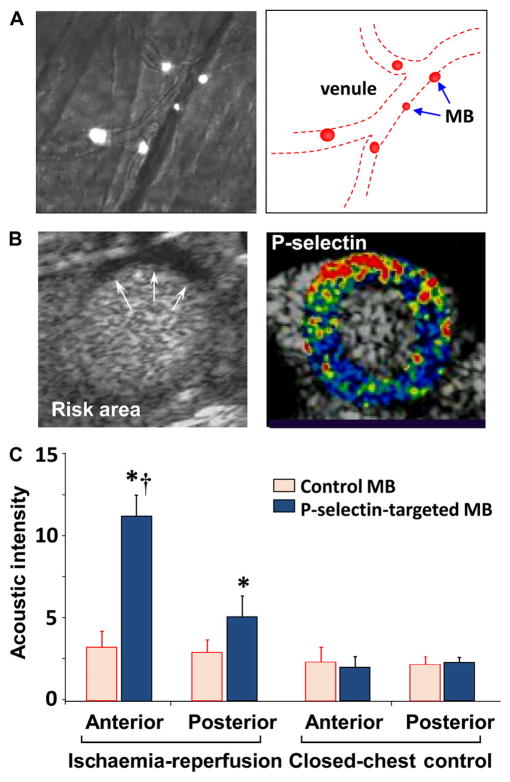
Figure 5.
Detection of recent myocardial ischaemia with myocardial contrast echocardiography (MCE) molecular imaging.11 (A) Intravital microscopy of the cremaster muscle in mice illustrating attachment of intravenously administered fluorescently labelled P-selectin targeted microbubbles (MB) to the venular surface after brief ischaemia–reperfusion injury of the muscle. (B) MCE perfusion imaging in a mouse illustrating an ischaemic risk area (arrows) during brief occlusion of the left anterior descending artery (LAD) and molecular imaging with P-selectin targeted microbubbles 45 min after reflow showing enhancement in the previously ischaemic risk area. Colour scale is at bottom. (C) Quantitative data from MCE P-selectin molecular imaging 45 min after ischaemia–reperfusion of the anterior LAD supplied territory. Data from closed chest control animals are also shown. *p<0.05 versus control microbubbles; †p<0.05 versus posterior non-ischaemic territory.

