
Figure 2.
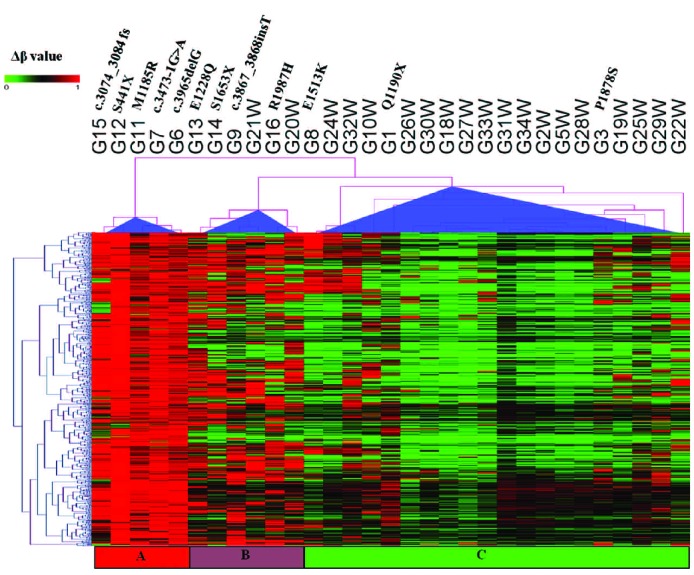
Hierarchical clustering of β methylation values from 578 CpG sites showing differential methylation in TET2mut and TET2wt samples. These 578 most variable probes were selected as having a FDR-adjusted P<0.05, and a mean β value difference of ≥0.2 between TET2mut and TET2wt samples (explained in the Online Supplementary Design and Methods section). Columns represent samples; rows represent CpG sites. Euclidean distance and complete linkage were used to study the cluster pattern of methylation probes. β values are represented using a pseudocolor scale from 0 to 1 as per color bar. TET2mut samples are separated into two distinct groups, one with higher mean β values and a second group with lower mean β values. Three TET2mut samples, G1, G3, and G8, cannot be distinguished from TET2wt. G18W= Normal CD19+ B cells.