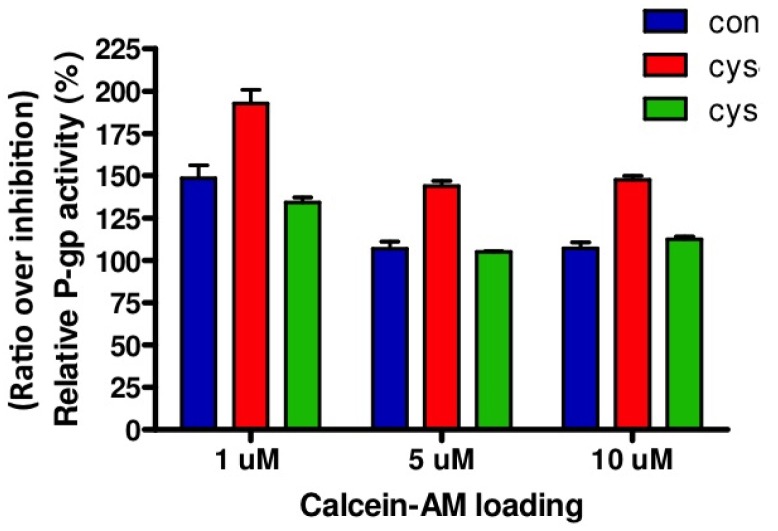
Figure 3.
Relative P-gp activity after calcein-AM loading. P-gp activity in two different cystinotic (red and green bar) and one control (blue bar) ciPTEC line was determined after loading the cells with calcein-AM for 60 min (in triplicate) either in the presence of the P-gp inhibitory compound PSC833 (5 μM) or vehicle (0.1% DMSO). Relative P-gp activity is depicted as ratio of P-gp inhibition (PSC833) over the control condition (vehicle). Ratio > 100% indicates inhibition of P-gp activity. Con = control ciPTEC; Cys = cystinotic ciPTEC.

