

Abstract
Objectives
To investigate the association between natriuretic peptides and body fat distribution in a multiethnic cohort.
Background
Natriuretic peptides stimulate lipolysis, reduce weight gain, and promote adipocyte browning in animal models but data are lacking in humans.
Methods
2619 participants without heart failure in the Dallas Heart Study underwent measurements of 1) B-type natriuretic peptide (BNP) and NT-proBNP and 2) body fat distribution by dual energy x-ray absorptiometry and magnetic resonance imaging. Cross-sectional associations of natriuretic peptides with adiposity phenotypes were examined after adjustment for age, sex, race, comorbidities, and body mass index.
Results
Median BNP and NT-proBNP levels in the study cohort (mean age 44 years, 56% women, 48% African-Americans, 32% obese) were 3.0 and 28.1 pg/mL, respectively. Natriuretic peptide levels above the median were associated with a more favorable body fat profile and less insulin resistance including lower visceral fat, liver fat, and HOMA-IR; and more lower body fat and higher adiponectin (p<0.05 for each). In multivariable analyses, NT-proBNP remained inversely associated with visceral (β= −0.08, p<0.0001) and liver fat (β= −0.14, p<0.0001) and positively associated with lower body fat (β= 0.07, p<0.0001) independent of age, sex, race, and obesity-status; findings were similar with BNP. Adjustment for body composition, HOMA-IR, circulating androgens, and adipocytokines did not attenuate the associations.
Conclusions
Higher natriuretic peptide levels were independently associated with a favorable adiposity profile, characterized by decreased visceral and liver fat and increased lower body fat, suggesting a link between the heart and adipose tissue distribution mediated through natriuretic peptides.
Keywords: natriuretic peptides, body fat distribution, visceral fat, insulin resistance
Introduction
An inverse relationship between natriuretic peptide levels and obesity, traditionally defined by body mass index (BMI), has been firmly established (1-3). However, controversy exists as to the nature of this relationship and whether obesity influences, or is primarily influenced by, circulating natriuretic peptides levels. Although it was originally hypothesized that lower natriuretic peptide levels in obese individuals could be attributed to increased clearance by adipose tissue expressing the NPR-C receptor, studies have demonstrated that natriuretic peptides not cleared via this mechanism, such as NT-proBNP and NT-proANP, have similar inverse associations with BMI, suggesting that decreased natriuretic peptide release from the heart, rather than clearance by adipose tissue, underlies this relationship (4, 5).
A growing body of experimental evidence suggests that the heart exerts beneficial metabolic effects on adipose tissue metabolism and function through release of natriuretic peptides. Atrial natriuretic and B-type natriuretic peptides (BNP) bind to NPR-A receptors on adipose tissue and stimulate lipolysis (6), promote browning of adipocytes (7), regulate body fat distribution by activation of peroxisome proliferator-activated receptor gamma gene expression (8), and enhance adiponectin secretion from adipocytes (9). As a result, mice that overexpress or are treated with exogenous infusions of natriuretic peptide exhibit reduced fat mass, improved glucose tolerance, and enhanced energy expenditure (7), suggesting that the “lipomobilizing” effects of natriuretic peptides may have salutary consequences on body fat metabolism and distribution. Conversely, a relative natriuretic peptide deficiency may contribute to obesity and an adverse adipose tissue distribution profile (10). However, data are lacking on the relationship of natriuretic peptides with adiposity phenotypes in humans.
Therefore, we investigated the cross-sectional associations of natriuretic peptide levels with body fat composition by dual energy x-ray absorptiometry (DEXA) and abdominal fat distribution by magnetic resonance imaging (MRI) in a large, multiethnic cohort of adults with extensive cardiovascular, metabolic, and adipose tissue imaging phenotyping. We hypothesized that higher levels of natriuretic peptides would be associated with a favorable adiposity profile, characterized by decreased visceral and liver fat and increased lower body (gluteal-femoral) subcutaneous fat independent of age, sex, race, and obesity-status. Additionally, we tested whether accounting for endocrine factors known to be associated with natriuretic peptides and adipose tissue distribution, including levels of insulin resistance, circulating androgens, and adipocytokines, would impact this relationship.
Methods
Study population
The Dallas Heart Study (DHS) is a multi-ethnic, probability-based, population cohort study of Dallas County adults with deliberate over-sampling of African-Americans. Detailed methods of the DHS have been described previously (11). Briefly, between 2000 and 2002, 3072 subjects completed the three DHS visits, including a detailed in-home survey, laboratory testing, and imaging studies. For the present study, participants with a left ventricular (LV) ejection fraction <50%, those with prevalent clinical heart failure (defined by self-report of “congestive heart failure, an enlarged heart, a weak heart, or cardiomyopathy”), and those with missing natriuretic peptide data were excluded, yielding a final sample size of 2619. Participants provided written informed consent, and the protocol was approved by the institutional review board of the University of Texas Southwestern Medical Center.
Race/ethnicity, history of cardiovascular diseases (CVD), and smoking status were self-reported. Detailed descriptions of variable definitions for hypertension, hypercholesterolemia, and low high-density lipoprotein cholesterol have been previously described using conventional clinical definitions (12). Presence of the metabolic syndrome was defined according to the National Cholesterol Education Program's (NCEP) Adult Treatment Panel III report (13). Glomerular filtration rate (GFR) was estimated using the Modification of Diet in Renal Disease equation (14). The homeostasis model assessment of insulin resistance index (HOMA-IR) was calculated by fasting insulin (μIU/ml) × fasting glucose (mmol/liter)/22.5 (15).
Natriuretic peptide, androgen, and adipocytokine measurements
Detailed methods describing measurements of NT-proBNP (Roche Diagnostics) and BNP (Alere Inc) in the DHS have been published previously (4). The coefficient of variation for the NT-proBNP assay was 3.3% at a concentration of 282 pg/mL and 3.0% at a concentration of 6012 pg/mL; for the BNP assay it was 11.2% at a concentration of 30 pg/mL and 5.8% at concentrations >60 pg/mL. Total testosterone was measured in a subgroup of 695 women using a competitive radioimmunoassay as previously described (16). The assay had a coefficient of variation of 7.7% at a concentration of 0.52 ng/mL. Circulating free testosterone was then calculated using a published estimating equation previously validated in women (17). Adipocytokines including total adiponectin (18), leptin, and highly-sensitive C-reactive protein levels were measured as previously described (19).
Body fat distribution and imaging measurements
BMI was calculated as weight (kilograms)/height (meters)2. Body surface area (BSA) was calculated using the method of Tikuisis (20). Waist circumference was measured 1 cm above the iliac crest and hip circumference at the widest circumference of the buttocks at the area of the greater trochanters. DEXA (Delphi W scanner, Hologic Inc., Bedford, MA and Discovery software [version 12.2]) was used to measure total body fat, lean mass, percent body fat, and lower body subcutaneous fat. Lower body fat was delineated by two oblique lines crossing the femoral necks and converging below the pubic symphysis, and included gluteal-femoral fat (21). Visceral and subcutaneous abdominal fat mass were measured by a 1.5-T MRI system (Intera, Philips Medical Systems, Best, The Netherlands) using a prospectively designed and validated method of fat mass prediction from a single MRI slice at the L2-L3 inter-vertebral level (22). Single slice measurement of subcutaneous and visceral fat mass at this inter-vertebral level has been shown to be highly concordant with total abdominal fat mass measured at all inter-vertebral levels (R2=85-96%) (22). Liver fat was measured using 1.5T 1H magnetic resonance spectroscopy and is reported as a percentage (23).
Cardiac MRI was performed using the same 1.5-T system above. Left ventricular (LV) mass, end diastolic and systolic volumes, and ejection fraction were calculated from short-axis sequences. LV hypertrophy (LVH) was defined as LV mass/BSA ≥89 g/m2 in women and ≥112 g/m2 in men, based on a phenotypically normal subpopulation of the DHS cohort (24).
Statistical Analysis
Characteristics were compared between participants with natriuretic peptide levels above and below median values using chi-square tests for dichotomous variables and Wilcoxon rank-sum tests for continuous variables. Linear regression modeling was used to assess associations of natriuretic peptides with adiposity phenotypes, with the log-transformed natriuretic peptide as the independent variable and the adiposity measurement as the dependent variable. Standardized β coefficients were used to facilitate comparisons between natriuretic peptides and adiposity measurements. The β coefficient represents the unit change in 1 standard deviation of the adiposity variable for a 1 standard deviation change in the log-transformed natriuretic peptide level. Models were adjusted for age, sex, African-American race, hypertension, diabetes, LV mass/BSA, estimated GFR, smoking, and BMI. As a sensitivity analysis, multivariable models were created replacing BMI with total body fat and lean mass in order to assess the associations of natriuretic peptides with body fat distribution independent of overall fat and lean mass. Due to potential collinearity by inclusion of both fat and lean mass in multivariable models, variance inflation factors were tested, which were consistently less than 5. Multivariable models were also tested with additional adjustment for LV end-diastolic volume/BSA, menopausal status in women, and adipocytokine levels; and by replacement of hypertension and diabetes status with systolic blood pressure and HOMA-IR. Sensitivity analyses were performed excluding participants with hypertension, diabetes, GFR<60 mL/min per 1.73 m2, LVH, and CVD. Lastly, the impact of circulating androgens on the relationship between natriuretic peptides and body composition was explored in a subgroup of 695 women ≤ age 50 with concurrent plasma free testosterone measurements. For all statistical testing, a 2-sided p-value <0.05 was considered statistically significant. All statistical analyses were performed using SAS version 9.2 software (SAS Corporation, Cary, NC).
Results
Univariable Associations of Natriuretic Peptides with Body Fat Composition
Among the 2619 participants meeting study criteria, mean age was 44, 56% were women and 48% African-American. 24% of the study cohort was normal weight (BMI<25 kg/m2), 44% overweight (25≤BMI<30 kg/m2), and 32% obese (BMI≥30 kg/m2). The median (25th, 75th percentile) NT-proBNP and BNP levels in the study cohort were 28.1 (13.2, 58.9) and 3.0 (0.0, 13.0) pg/mL, respectively. Baseline characteristics are presented in Table 1. Compared with individuals with natriuretic peptide levels below the median value, those with levels above the median were older and more likely to be female with greater prevalence of hypertension, LVH, and CVD (p<0.05 for each).
Table 1. Characteristics of the Study Population Stratified by Natriuretic Peptide Levels.
| Variable | NT-ProBNP | BNP | ||
|---|---|---|---|---|
| ≤ Median (n=1310) |
> Median (n=1309) |
≤ Median (n=1392) |
> Median (n=1227) |
|
| Age (yrs) | 41 (34, 48) | 46 (38, 54)* | 41 (35, 49) | 45 (37, 53)† |
| Male (%) | 58.7 | 30.2* | 51.1 | 37.8† |
| Race (%) | ||||
| Caucasian | 28.2 | 36.2* | 31.5 | 33.0 |
| African-American | 52.1 | 44.1* | 48.1 | 48.0 |
| Hispanic | 16.8 | 18.4 | 18.2 | 17.0 |
| Hypertension (%) | 27.2 | 36.6* | 27.9 | 35.9† |
| Diabetes (%) | 10.5 | 10.5 | 10.7 | 10.3 |
| Hypercholesterolemia (%) | 12.7 | 12.5 | 11.6 | 13.5 |
| Low HDL Cholesterol (%) | 41.7 | 38.4 | 38.7 | 41.4 |
| Metabolic Syndrome (%) | 34.2 | 33.2 | 33.2 | 34.2 |
| Current Smoking (%) | 28.1 | 26.9 | 28.0 | 26.9 |
| Prior CVD (%) | 2.2 | 5.7* | 2.7 | 5.2† |
| Left Ventricular Hypertrophy (%) | 7.4 | 11.9* | 7.4 | 11.9† |
| Weight (kg) | 85.0 (73.0, 99.3) | 78.5 (66.7, 93.0)* | 83.2 (71.4, 98.0) | 80.7 (68.5, 95.3)† |
| Body Mass Index (kg/m2) | 29.5 (25.8, 33.9) | 28.5 (24.5, 33.8)* | 29.3 (25.3, 34.0) | 28.9 (25.1, 33.8) |
| Waist Circumference (cm) | 99.0 (90.0, 110.0) | 95.0 (84.0, 106.0)* | 97.5 (88.0, 109.5) | 96.0 (86.0, 107.5)† |
| Waist/Hip ratio | 0.92 (0.87, 0.98) | 0.88 (0.82, 0.94)* | 0.91 (0.85, 0.97) | 0.89 (0.83, 0.95)† |
| Total Fat Mass (kg) | 24.7 (17.9, 32.2) | 26.1 (19.1, 34.7)* | 24.7 (17.7, 32.5) | 26.1 (19.2, 34.5)† |
| Total Lean Mass (kg) | 58.7 (49.5, 66.6) | 50.0 (43.0, 58.9)* | 56.3 (47.1, 65.3) | 52.4 (44.4, 61.6)† |
| Visceral Fat (kg) | 2.2 (1.6, 2.9) | 1.9 (1.3, 2.6)* | 2.1 (1.5, 2.8) | 1.9 (1.4, 2.6)† |
| Abdominal Subcutaneous Fat (kg) | 4.1 (2.8, 6.1) | 4.4 (2.8, 6.4) | 4.0 (2.8, 6.1) | 4.4 (2.8, 6.4)† |
| Lower Body Fat (kg) | 8.1 (5.8, 11.3) | 9.4 (6.7, 12.6)* | 8.3 (5.8, 11.8) | 9.3 (6.5, 12.4)† |
| Liver Fat (%) | 3.9 (2.3, 7.8) | 3.2 (1.9, 5.6)* | 3.7 (2.2, 7.1) | 3.4 (2.0, 5.9)† |
| LV Ejection Fraction (%) | 72.7 (68.0, 77.1) | 73.6 (68.5, 77.9)* | 73.0 (68.2, 77.3) | 73.3 (68.3, 77.6) |
| LV End-Diastolic Volume/BSA (mL/m2) | 51.0 (45.2, 57.5) | 50.8 (44.5, 58.4) | 51.0 (45.1, 57.5) | 51.1 (44.6, 58.4) |
| LV End-Systolic Volume/BSA (mL/m2) | 14.0 (11.0, 17.2) | 13.3 (10.6, 16.7)* | 13.8 (11.0, 16.8) | 13.7 (10.6, 17.2) |
| Estimated GFR (mL/min per 1.73 m2) | 98.8 (87.1, 112.6) | 95.3 (82.4, 111.2)* | 98.0 (85.4, 112.6) | 96.6 (84.1, 111.4) |
| HOMA-IR | 3.2 (1.8, 5.3) | 2.5 (1.4, 4.4)* | 3.0 (1.7, 5.2) | 2.6 (1.6, 4.6)† |
| Adiponectin (ng/mL) | 5.6 (4.0, 8.2) | 8.0 (5.2, 11.3)* | 5.9 (4.1, 8.8) | 7.5 (4.9, 10.7)* |
| BNP (pg/mL) | 0.0 (0.0, 3.8) | 9.2 (2.4, 22.4) | 0.0 (0.0, 0.5) | 13.0 (6.7, 24.2) |
| NT-proBNP (pg/mL) | 13.2 (5.8, 19.5) | 58.9 (39.8, 99.4) | 16.8 (7.5, 30.3) | 50.6 (25.8, 94.3) |
Data are presented as median (25%, 75% percentile) or proportion (%) where indicated.
Median values for NT-proBNP and BNP are 28.1 and 3.0 pg/mL, respectively.
Abbreviations: BNP= B-type natriuretic peptide; BP= blood pressure; BSA= body surface area; CHD= coronary heart disease; cTnT= cardiac troponin T; CVD= cardiovascular disease; GFR= glomerular filtration rate; HDL= high density lipoprotein; HOMA-IR= homeostasis model assessment of insulin resistance; LV= left ventricular
p<0.05 vs. ≤ Median NT-proBNP group
p<0.05 vs. ≤ Median BNP group
Natriuretic peptide levels above the median value were associated with a more favorable body fat composition profile and less insulin resistance including significantly lower weight, waist circumference, waist-hip ratio, and HOMA-IR, and higher adiponectin levels (p<0.05 for each, Table 1). Although participants with higher natriuretic peptide levels had less lean mass and more total body fat, the relationship between natriuretic peptides and total body fat was determined primarily through a positive association with lower body (i.e. gluteal-femoral) fat despite an inverse association with visceral and liver fat (p<0.05 for each). The inverse association of natriuretic peptide levels with visceral fat and the positive association with lower body fat were generally consistent across BMI-strata of normal weight, overweight, and obese for both NT-proBNP and BNP (Figure 1).
Figure 1. Fat mass stratified by obesity category and natriuretic peptide concentrations.
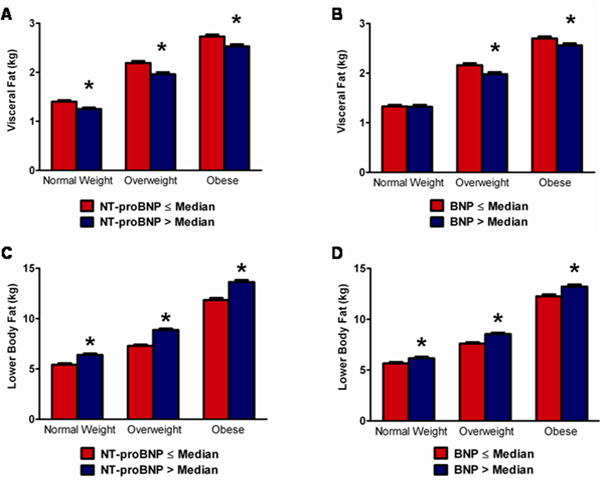
Mean +/− SEM visceral fat mass stratified by median NT-proBNP is shown in panel A and by median BNP in panel B. Mean +/− SEM lower body fat mass stratified by NT-proBNP is shown in panel C and by BNP in panel D. BMI is categorized as follows: normal weight, BMI <25 kg/m2 (n=614); overweight, 25≤BMI<30 kg/m2 (n=844); obese BMI≥30 kg/m2 (n=1130). *p<0.05 vs. ≤ median group. Error bars represent standard error of the mean (SEM).
Multivariable Adjustment
After multivariable adjustment for age, sex, African-American race, hypertension, diabetes, left ventricular mass/BSA, estimated GFR, smoking, and BMI, natriuretic peptide levels remained inversely associated with visceral fat (β= −0.08 for NT-proBNP and −0.04 for BNP, p≤0.01 for both) and liver fat (β= −0.14 for NT-proBNP and −0.06 for BNP, p≤0.01 for both) (Table 2). The inverse associations of natriuretic peptides with liver fat remained significant after additional adjustment for visceral fat mass (β= −0.10 for NT-proBNP, p<0.0001 and −0.05 for BNP, p=0.01). In contrast, both NT-proBNP (β= 0.07) and BNP (β= 0.04) were positively associated with lower body fat (p<0.0001 for both). Results were unchanged after replacement of BMI with total body fat and lean mass in the models. Although both NT-proBNP and BNP were associated with increased abdominal subcutaneous fat after multivariable adjustment in the model containing BMI (β= 0.04 for NT-proBNP and 0.03 for BNP, p≤0.01 for both), results were completely attenuated after adjustment for total fat and lean mass (Table 2). All findings were insensitive to exclusion of participants with hypertension, diabetes, GFR<60, LVH, and CVD; and were similar after additional adjustment for LV end-diastolic volume/BSA, menopausal status (in women), treatment with antihypertensive and statin medications, and adipocytokine levels in the models, and by replacement of hypertension and diabetes status with systolic blood pressure and HOMA-IR (Online Supplemental Table 1). Findings were also similar using sex-specific and age-stratified multivariable adjusted models (Online Supplemental Tables 2 and 3). The multivariable adjusted association between higher natriuretic peptide levels and lower visceral fat was consistent across subgroups defined by age, sex, race, and obesity-status, with no interactions observed (Figure 2). Exploratory analyses examining the relationship between natriuretic peptides and the more clinically relevant anthropometric measure of waist-hip ratio demonstrated an inverse association after multivariable adjustment, β= −0.08 for NT-proBNP, p<0.0001 and −0.04 for BNP, p=0.03.
Table 2. Multivariable-Adjusted Linear Regression Models of Relation of Natriuretic Peptides to Adiposity Phenotypes.
| Log NT-proBNP | Visceral Fat | Subcutaneous Fat | Lower Body Fat | Liver Fat | |||||
|---|---|---|---|---|---|---|---|---|---|
|
| |||||||||
| β | P-value | β | P-value | β | P-value | β | P-value | ||
|
|
|||||||||
| Model 1 (unadjusted) | −0.16 | <0.0001 | 0.05 | 0.01 | 0.13 | <0.0001 | −0.13 | <0.0001 | |
| Model 2 | −0.08 | <0.0001 | 0.04 | 0.0001 | 0.07 | <0.0001 | −0.14 | <0.0001 | |
| Model 3 | −0.10 | <0.0001 | 0.0004 | 0.95 | 0.04 | <0.0001 | −0.15 | <0.0001 | |
| Log BNP | |||||||||
|
|
|||||||||
| Model 1 (unadjusted) | −0.09 | <0.0001 | 0.03 | 0.11 | 0.08 | <0.0001 | −0.08 | 0.0001 | |
| Model 2 | −0.04 | 0.006 | 0.03 | 0.0004 | 0.04 | <0.0001 | −0.06 | 0.002 | |
| Model 3 | −0.06 | <0.0001 | 0.003 | 0.66 | 0.02 | 0.007 | −0.08 | 0.0004 | |
Models constructed with fat parameters as dependent variables and natriuretic peptides as independent variables; β coefficient is per 1-SD of the log-transformed natriuretic peptide. Model 1 is unadjusted. Model 2 is adjusted for age, sex, African-American race, hypertension, diabetes, left ventricular mass/body surface area, estimated glomerular filtration rate, smoking, and body mass index. Model 3 is adjusted for all covariates from Model 2 replacing body mass index with total body fat mass and lean mass.
Figure 2. Multivariable adjusted associations of natriuretic peptides with the lowest sex-specific quartile of visceral fat mass (<1.3 kg for women and <1.8 kg for men) by age, sex, race, and obesity subgroups.
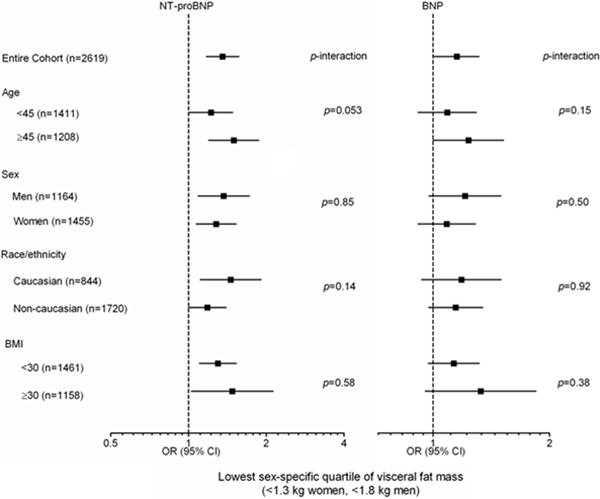
Odds ratios (95% confidence intervals) per 1-standard deviation increment in the log-transformed natriuretic peptide level. Adjusted for age, sex, African-American race, hypertension, diabetes, left ventricular mass/BSA, estimated GFR, smoking, and total body fat and lean mass. p-value for subgroup interaction.
Effect of Testosterone on the Relationship between Natriuretic Peptides and Adiposity Phenotypes
In exploratory analyses restricted to 695 women ≤ age 50 with concurrent plasma free testosterone measurements, the impact of circulating androgens on the association between natriuretic peptides and body fat composition was examined. The median (25th, 75th percentile) free testosterone level in this subgroup was 1.7 (1.3, 2.2) ng/mL and the correlation coefficients (Spearman's rho) between free testosterone and natriuretic peptides were −0.13, p=0.001 and −0.08, p=0.04 for NT-proBNP and BNP, respectively. In multivariable analyses among this subgroup adjusting for age, African-American race, hypertension, diabetes, left ventricular mass/BSA, estimated GFR, smoking, BMI, and the log-transformed natriuretic peptide level, free testosterone was independently associated with increased visceral fat (β= 0.13, p<0.0001) and negatively associated with lower body fat (β= −0.05, p<0.05), but showed no statistically significant association with abdominal subcutaneous or liver fat. Importantly, additional adjustment for free testosterone in the multivariable models did not attenuate the associations observed between natriuretic peptides and adiposity phenotypes (Online Supplemental Table 4), suggesting that the relationship between natriuretic peptides and body composition may be independent of circulating androgen levels.
Discussion
In a large, population-based cohort of community-dwelling adults with well characterized body fat composition and distribution, we demonstrate a significant association between higher levels of natriuretic peptides and a favorable adiposity profile, including decreased visceral and liver fat and increased lower body fat, independent of age, sex, race, and obesity-status. Accounting for levels of insulin resistance, circulating androgens, and adipocytokines did not attenuate this association, suggesting that the link between natriuretic peptides and body fat distribution may be at least partially independent of peripheral endocrine effects. Additionally, although visceral, liver, and lower body fat are highly sex-dependent, with less visceral and liver fat and greater lower body fat seen among females, our findings do not suggest that the relationship between higher natriuretic peptide levels and a “gynoid” adiposity profile is mediated exclusively through female sex, as findings were independent of sex in the models and were consistent in subgroups of men and women. Taken in the context of prior experimental and epidemiological evidence, our observations provide insight into the potential interplay between the heart and adipose tissue, generating the hypothesis that natriuretic peptides released by cardiomyocytes may exert beneficial effects on fat metabolism in humans.
Few studies have examined the relationship between natriuretic peptides and precise estimates of body fat distribution. A study of 608 patients with type 2 diabetes from Japan demonstrated an inverse association between BNP and BMI, with a more robust inverse association between BNP and visceral fat compared with other measures of adiposity (25). A more recent report among third-generation participants in the Framingham Heart Study similarly described inverse associations between NT-proBNP and visceral fat in a multivariable adjusted analysis including BMI, with no independent association seen with abdominal subcutaneous fat (26). In addition to confirming the link between natriuretic peptides and reduced visceral fat among a larger and more ethnically diverse population, with greater insulin resistance and more extensive cardiac phenotyping, we demonstrate several novel findings. These include an inverse association with liver fat, a well-known correlate of diabetes and the metabolic syndrome (27), and a positive association with lower body fat, an adipose tissue depot gaining increasing recognition as potentially protective against many CVD risk factors. Although the associations observed in our study were relatively small in magnitude, they are consistent with those seen in the Framingham Heart Study (26) and may relate to the use of log-transformed natriuretic peptide levels in both analyses. Additionally, the distribution of natriuretic peptide levels in our population was within the “normal” range and thus small incremental increases within this range are expected to have smaller effect sizes.
The positive association with lower body fat is particularly notable, as preferential storage of excess adiposity in the lower body subcutaneous fat compartment is associated with a lower prevalence of metabolic risk factors (21, 28), and loss of this fat reservoir over time may result in higher blood pressure, cholesterol, and blood glucose levels (29). In the prospective Malmo Diet and Cancer study (30), higher natriuretic peptide levels were associated with a lower incidence of diabetes over follow-up, and we have recently reported in the Dallas Heart Study that greater lower body fat may protect against diabetes development (31). The present findings suggest a link between these last two observations and raise the possibility that fat redistribution to the lower body subcutaneous compartment may represent a mechanism by which natriuretic peptides protect against insulin resistance and diabetes. Additionally, since our findings demonstrate that natriuretic peptide levels have variable relationships with different adipose tissue depots, analyses limited to total body measurements of adiposity may not accurately characterize the complex relationship between natriuretic peptides and body fat.
Potential Mechanisms
Natriuretic peptide signaling may actively influence differential body fat distribution. Although natriuretic peptides have lipolytic and lipomobilizing effects on adipose tissue (32), the magnitude of lipolysis may vary among different adipose tissue depots. For example, the rate of lipolysis is lowest in subcutaneous gluteal-femoral fat, intermediate in abdominal subcutaneous fat, and highest in visceral fat (33). Natriuretic peptides may differentially influence lipolysis through higher NPR-A receptor expression within visceral fat compared with subcutaneous fat (34), making lower body subcutaneous fat relatively resistant to natriuretic-peptide mediated lipolysis.
An alternative explanation for the present findings may be that the association between natriuretic peptides and adiposity may indeed be bidirectional. Experimental and observational data suggest that increased body mass leads to decreased natriuretic peptide levels (1-4) and, conversely, that weight loss increases natriuretic peptide levels (35, 36). The development of abdominal obesity may result in a vicious cycle, with inhibition of natriuretic peptide mediated lipolysis and perpetuation of visceral and liver fat accumulation ultimately resulting in an adverse adiposity profile and metabolic disease. Obese individuals without heart failure may also be prone to a relative natriuretic peptide deficiency stemming from suppressive effects of circulating androgens on natriuretic peptide synthesis (16) and possibly by systemic lipotoxic and cytokine effects of ectopic fat on cardiac tissue (37), leading to impaired natriuretic peptide synthesis (38) and release (39). This vicious cycle may be augmented by further suppression of natriuretic peptide levels through increased clearance via the NPR-C receptor expressed in adipose tissue, with more rigorous clearance among those with central abdominal obesity. In support of this theory are the findings that NPR-C gene expression is upregulated in visceral fat compared with subcutaneous fat in both insulin-sensitive and insulin-resistant individuals (34).
Strengths and Limitations
Strengths of the current study include a racially diverse sample of adults applicable to the general population and detailed phenotyping using multiple novel adipose tissue imaging techniques. Several limitations also merit comment. Since the analysis was cross-sectional, we are unable to determine the directionality of the relationship between natriuretic peptides and body fat distribution beyond what has been suggested from experimental data; therefore, the findings of this study should be viewed as hypothesis-generating and require further confirmation in prospective studies with serial assessment of body fat distribution. Second, although we excluded participants with self-reported prevalent heart failure and LV systolic dysfunction, the contribution of undiagnosed heart failure with preserved ejection fraction to natriuretic peptide levels cannot be quantified; however, individuals with this disorder tend to be overweight or obese thereby increasing type II error and biasing our study toward the null hypothesis instead of increasing the likelihood of false positive results. Third, since total abdominal subcutaneous adipose tissue was measured in our study, we are unable to test the independent associations of its superficial and deep components (which may have divergent relationships with cardiometabolic risk markers) with natriuretic peptides. Fourth, we are unable to examine the role that adipocytokines other than adiponectin, leptin, and C-reactive protein may play in the relationship between natriuretic peptides and body fat distribution. Lastly, the present findings are not necessarily generalizable to individuals older than age 65, of Asian descent/ethnicity, or with symptomatic heart failure in which both body fat distribution and natriuretic peptide levels may be different compared with our study population.
Implications
It has become increasingly evident that the impact of obesity on cardiovascular and metabolic risk is heterogeneous and highly dependent on the distribution and consequent metabolic activity of body fat. For example, the accumulation of fat around the abdominal viscera and other ectopic sites such as the heart and liver is associated with multiple CVD risk factors (40) and the development of diabetes (31). In contrast, increased fat storage in the lower body gluteal-femoral region appears to ameliorate some of the risk associated with adiposity (21, 41). Therefore, the discovery that natriuretic peptides can favorably impact body fat metabolism and distribution in animal experiments, and its translation into human epidemiology, has several implications. First, the finding that natriuretic peptides differentially associate with body fat composition measures, irrespective of obesity-status, underscores the need for further research into specific adipose tissue depots and their relationship with the cardiovascular system. Second, upregulating the natriuretic peptide system among obese individuals represents a potential therapeutic approach to treating abdominal obesity and its adverse metabolic and vascular effects. For example, although abandoned due to excess risk of angioedema, the vasopeptidase inhibitor omapatrilat raised natriuretic peptide levels leading to improved sodium/water balance and decreased peripheral vascular resistance and blood pressure (42). Another strategy may be to increase physical activity, since exercise both enhances natriuretic peptide release (43) and preferentially reduces visceral fat mass independent of weight loss (44). If our findings are prospectively confirmed, similar therapeutic strategies aimed at increasing natriuretic peptide levels may be targeted to reduce accumulation of visceral and ectopic fat and drive redistribution to more metabolically favorable adipose storage depots.
Supplementary Material
Acknowledgments
Funding Sources: This work was supported by award number T32HL007360 from the National Heart, Lung, and Blood Institute to Dr. Neeland, by grants UL1DE019584 and PL1DK081182 from the National Institutes of Health, and by grant number UL1TR000451 from the National Center for Advancing Translational Sciences. Biomarker measurements were supported by investigator-initiated grants from Roche Diagnostics (Indianapolis IN) and Alere Inc (San Diego CA).
Relationship with Industry: Dr. McGuire: Research support from Orexigen as member of the Data Safety Monitoring Committee for an obesity trial.
Dr. de Lemos: Research support from Roche Diagnostics and Abbott Diagnostics.
Abbreviations
- BMI
body mass index
- BNP
B-type natriuretic peptide
- CVD
cardiovascular disease
- DEXA
dual energy x-ray absorptiometry
- GFR
glomerular filtration rate
- MRI
magnetic resonance imaging
- NT-proBNP
N-terminal pro-B-type natriuretic peptide
Footnotes
Publisher's Disclaimer: This is a PDF file of an unedited manuscript that has been accepted for publication. As a service to our customers we are providing this early version of the manuscript. The manuscript will undergo copyediting, typesetting, and review of the resulting proof before it is published in its final citable form. Please note that during the production process errors may be discovered which could affect the content, and all legal disclaimers that apply to the journal pertain.
References
- 1.Wang TJ, Larson MG, Levy D, Benjamin EJ, Leip EP, Wilson PW, Vasan RS. Impact of obesity on plasma natriuretic peptide levels. Circulation. 2004;109:594–600. doi: 10.1161/01.CIR.0000112582.16683.EA. [DOI] [PubMed] [Google Scholar]
- 2.Mehra MR, Uber PA, Park MH, Scott RL, Ventura HO, Harris BC, Frohlich ED. Obesity and suppressed B-type natriuretic peptide levels in heart failure. J Am Coll Cardiol. 2004;43:1590–5. doi: 10.1016/j.jacc.2003.10.066. [DOI] [PubMed] [Google Scholar]
- 3.McCord J, Mundy BJ, Hudson MP, Maisel AS, Hollander JE, Abraham WT, Steg PG, Omland T, Knudsen CW, Sandberg KR, McCullough PA. Relationship between obesity and B-type natriuretic peptide levels. Arch Intern Med. 2004;164:2247–52. doi: 10.1001/archinte.164.20.2247. [DOI] [PubMed] [Google Scholar]
- 4.Das SR, Drazner MH, Dries DL, Vega GL, Stanek HG, Abdullah SM, Canham RM, Chung AK, Leonard D, Wians FH, Jr, de Lemos JA. Impact of body mass and body composition on circulating levels of natriuretic peptides results from the Dallas Heart Study. Circulation. 2005;112:2163–8. doi: 10.1161/CIRCULATIONAHA.105.555573. [DOI] [PubMed] [Google Scholar]
- 5.Costello-Boerrigter LC, Burnett JC., Jr A new role for the natriuretic peptides: metabolic regulators of the adipocyte. J Am Coll Cardiol. 2009;53:2078–9. doi: 10.1016/j.jacc.2009.02.037. [DOI] [PMC free article] [PubMed] [Google Scholar]
- 6.Sengenes C, Berlan M, De Glisezinski I, Lafontan M, Galitzky J. Natriuretic peptides: a new lipolytic pathway in human adipocytes. FASEB J. 2000;14:1345–51. [PubMed] [Google Scholar]
- 7.Bordicchia M, Liu D, Amri EZ, Ailhaud G, Dessi-Fulgheri P, Zhang C, Takahashi N, Sarzani R, Collins S. Cardiac natriuretic peptides act via p38 MAPK to induce the brown fat thermogenic program in mouse and human adipocytes. J Clin Invest. 2012;122:1022–36. doi: 10.1172/JCI59701. [DOI] [PMC free article] [PubMed] [Google Scholar]
- 8.Miyashita K, Itoh H, Tsujimoto H, Tamura N, Fukunaga Y, Sone M, Yamahara K, Taura D, Inuzuka M, Sonoyama T, Nakao K. Natriuretic peptides/cGMP/cGMP-dependent protein kinase cascades promote muscle mitochondrial biogenesis and prevent obesity. Diabetes. 2009;58:2880–92. doi: 10.2337/db09-0393. [DOI] [PMC free article] [PubMed] [Google Scholar]
- 9.Tsukamoto O, Fujita M, Kato M, Yamazaki S, Asano Y, Ogai A, Okazaki H, Asai M, Nagamachi Y, Maeda N, Shintani Y, Minamino T, Asakura M, Kishimoto I, Funahashi T, Tomoike H, Kitakaze M. Natriuretic peptides enhance the production of adiponectin in human adipocytes and in patients with chronic heart failure. J Am Coll Cardiol. 2009;53:2070–7. doi: 10.1016/j.jacc.2009.02.038. [DOI] [PubMed] [Google Scholar]
- 10.Clerico A, Giannoni A, Vittorini S, Passino C. Thirty years of the heart as an endocrine organ: physiological role and clinical utility of cardiac natriuretic hormones. Am J Physiol Heart Circ Physiol. 2011;301:H12–20. doi: 10.1152/ajpheart.00226.2011. [DOI] [PubMed] [Google Scholar]
- 11.Victor RG, Haley RW, Willett DL, Peshock RM, Vaeth PC, Leonard D, Basit M, Cooper RS, Iannacchione VG, Visscher WA, Staab JM, Hobbs HH. The Dallas Heart Study: a population-based probability sample for the multidisciplinary study of ethnic differences in cardiovascular health. Am J Cardiol. 2004;93:1473–80. doi: 10.1016/j.amjcard.2004.02.058. [DOI] [PubMed] [Google Scholar]
- 12.Deo R, Khera A, McGuire DK, Murphy SA, Meo Neto Jde P, Morrow DA, de Lemos JA. Association among plasma levels of monocyte chemoattractant protein-1, traditional cardiovascular risk factors, and subclinical atherosclerosis. J Am Coll Cardiol. 2004;44:1812–8. doi: 10.1016/j.jacc.2004.07.047. [DOI] [PubMed] [Google Scholar]
- 13.Third Report of the National Cholesterol Education Program (NCEP) Expert Panel on Detection, Evaluation, and Treatment of High Blood Cholesterol in Adults (Adult Treatment Panel III) final report. Circulation. 2002;106:3143–421. [PubMed] [Google Scholar]
- 14.Levey AS, Adler S, Caggiula AW, England BK, Greene T, Hunsicker LG, Kusek JW, Rogers NL, Teschan PE. Effects of dietary protein restriction on the progression of advanced renal disease in the Modification of Diet in Renal Disease Study. Am J Kidney Dis. 1996;27:652–63. doi: 10.1016/s0272-6386(96)90099-2. [DOI] [PubMed] [Google Scholar]
- 15.Matthews DR, Hosker JP, Rudenski AS, Naylor BA, Treacher DF, Turner RC. Homeostasis model assessment: insulin resistance and beta-cell function from fasting plasma glucose and insulin concentrations in man. Diabetologia. 1985;28:412–9. doi: 10.1007/BF00280883. [DOI] [PubMed] [Google Scholar]
- 16.Chang AY, Abdullah SM, Jain T, Stanek HG, Das SR, McGuire DK, Auchus RJ, de Lemos JA. Associations among androgens, estrogens, and natriuretic peptides in young women: observations from the Dallas Heart Study. J Am Coll Cardiol. 2007;49:109–16. doi: 10.1016/j.jacc.2006.10.040. [DOI] [PubMed] [Google Scholar]
- 17.Vermeulen A, Verdonck L, Kaufman JM. A critical evaluation of simple methods for the estimation of free testosterone in serum. J Clin Endocrinol Metab. 1999;84:3666–72. doi: 10.1210/jcem.84.10.6079. [DOI] [PubMed] [Google Scholar]
- 18.Turer AT, Khera A, Ayers CR, Turer CB, Grundy SM, Vega GL, Scherer PE. Adipose tissue mass and location affect circulating adiponectin levels. Diabetologia. 2011;54:2515–24. doi: 10.1007/s00125-011-2252-z. [DOI] [PMC free article] [PubMed] [Google Scholar]
- 19.Abdullah SM, Khera A, Leonard D, Das SR, Canham RM, Kamath SA, Vega GL, Grundy SM, McGuire DK, de Lemos JA. Sex differences in the association between leptin and CRP: results from the Dallas Heart Study. Atherosclerosis. 2007;195:404–10. doi: 10.1016/j.atherosclerosis.2006.10.022. [DOI] [PubMed] [Google Scholar]
- 20.Tikuisis P, Meunier P, Jubenville CE. Human body surface area: measurement and prediction using three dimensional body scans. Eur J Appl Physiol. 2001;85:264–71. doi: 10.1007/s004210100484. [DOI] [PubMed] [Google Scholar]
- 21.Vega GL, Adams-Huet B, Peshock R, Willett D, Shah B, Grundy SM. Influence of body fat content and distribution on variation in metabolic risk. J Clin Endocrinol Metab. 2006;91:4459–66. doi: 10.1210/jc.2006-0814. [DOI] [PubMed] [Google Scholar]
- 22.Abate N, Garg A, Coleman R, Grundy SM, Peshock RM. Prediction of total subcutaneous abdominal, intraperitoneal, and retroperitoneal adipose tissue masses in men by a single axial magnetic resonance imaging slice. Am J Clin Nutr. 1997;65:403–8. doi: 10.1093/ajcn/65.2.403. [DOI] [PubMed] [Google Scholar]
- 23.Szczepaniak LS, Babcock EE, Schick F, Dobbins RL, Garg A, Burns DK, McGarry JD, Stein DT. Measurement of intracellular triglyceride stores by H spectroscopy: validation in vivo. Am J Physiol. 1999;276:E977–89. doi: 10.1152/ajpendo.1999.276.5.E977. [DOI] [PubMed] [Google Scholar]
- 24.Drazner MH, Dries DL, Peshock RM, Cooper RS, Klassen C, Kazi F, Willett D, Victor RG. Left ventricular hypertrophy is more prevalent in blacks than whites in the general population: the Dallas Heart Study. Hypertension. 2005;46:124–9. doi: 10.1161/01.HYP.0000169972.96201.8e. [DOI] [PubMed] [Google Scholar]
- 25.Sugisawa T, Kishimoto I, Kokubo Y, Nagumo A, Makino H, Miyamoto Y, Yoshimasa Y. Visceral fat is negatively associated with B-type natriuretic peptide levels in patients with advanced type 2 diabetes. Diabetes Res Clin Pract. 2010;89:174–80. doi: 10.1016/j.diabres.2010.03.012. [DOI] [PubMed] [Google Scholar]
- 26.Cheng S, Fox CS, Larson MG, Massaro JM, McCabe EL, Khan AM, Levy D, Hoffmann U, O'Donnell CJ, Miller KK, Newton-Cheh C, Coviello AD, Bhasin S, Vasan RS, Wang TJ. Relation of visceral adiposity to circulating natriuretic peptides in ambulatory individuals. Am J Cardiol. 2011;108:979–84. doi: 10.1016/j.amjcard.2011.05.033. [DOI] [PMC free article] [PubMed] [Google Scholar]
- 27.Kotronen A, Yki-Jarvinen H. Fatty liver: a novel component of the metabolic syndrome. Arterioscler Thromb Vasc Biol. 2008;28:27–38. doi: 10.1161/ATVBAHA.107.147538. [DOI] [PubMed] [Google Scholar]
- 28.Boorsma W, Snijder MB, Nijpels G, Guidone C, Favuzzi AM, Mingrone G, Kostense PJ, Heine RJ, Dekker JM. Body composition, insulin sensitivity, and cardiovascular disease profile in healthy Europeans. Obesity (Silver Spring) 2008;16:2696–701. doi: 10.1038/oby.2008.433. [DOI] [PubMed] [Google Scholar]
- 29.Okura T, Nakata Y, Yamabuki K, Tanaka K. Regional body composition changes exhibit opposing effects on coronary heart disease risk factors. Arterioscler Thromb Vasc Biol. 2004;24:923–9. doi: 10.1161/01.ATV.0000125702.26272.f6. [DOI] [PubMed] [Google Scholar]
- 30.Magnusson M, Jujic A, Hedblad B, Engstrom G, Persson M, Struck J, Morgenthaler NG, Nilsson P, Newton-Cheh C, Wang TJ, Melander O. Low plasma level of atrial natriuretic peptide predicts development of diabetes: the prospective Malmo Diet and Cancer study. J Clin Endocrinol Metab. 2012;97:638–45. doi: 10.1210/jc.2011-2425. [DOI] [PMC free article] [PubMed] [Google Scholar]
- 31.Neeland IJ, Turer AT, Ayers CR, Powell-Wiley TM, Vega GL, Farzaneh-Far R, Grundy SM, Khera A, McGuire DK, de Lemos JA. Dysfunctional adiposity and the risk of prediabetes and type 2 diabetes in obese adults. JAMA. 2012;308:1150–9. doi: 10.1001/2012.jama.11132. [DOI] [PMC free article] [PubMed] [Google Scholar]
- 32.Sengenes C, Stich V, Berlan M, Hejnova J, Lafontan M, Pariskova Z, Galitzky J. Increased lipolysis in adipose tissue and lipid mobilization to natriuretic peptides during low-calorie diet in obese women. Int J Obes Relat Metab Disord. 2002;26:24–32. doi: 10.1038/sj.ijo.0801845. [DOI] [PubMed] [Google Scholar]
- 33.Arner P. Differences in lipolysis between human subcutaneous and omental adipose tissues. Ann Med. 1995;27:435–8. doi: 10.3109/07853899709002451. [DOI] [PubMed] [Google Scholar]
- 34.Pivovarova O, Gogebakan O, Kloting N, Sparwasser A, Weickert MO, Haddad I, Nikiforova VJ, Bergmann A, Kruse M, Seltmann AC, Bluher M, Pfeiffer AF, Rudovich N. Insulin up-regulates natriuretic peptide clearance receptor expression in the subcutaneous fat depot in obese subjects: a missing link between CVD risk and obesity? J Clin Endocrinol Metab. 2012;97:E731–9. doi: 10.1210/jc.2011-2839. [DOI] [PubMed] [Google Scholar]
- 35.Changchien EM, Ahmed S, Betti F, Higa J, Kiely K, Hernandez-Boussard T, Morton J. B-type natriuretic peptide increases after gastric bypass surgery and correlates with weight loss. Surg Endosc. 2011;25:2338–43. doi: 10.1007/s00464-010-1565-1. [DOI] [PubMed] [Google Scholar]
- 36.Chen-Tournoux A, Khan AM, Baggish AL, Castro VM, Semigran MJ, McCabe EL, Moukarbel G, Reingold J, Durrani S, Lewis GD, Newton-Cheh C, Scherrer-Crosbie M, Kaplan LM, Wang TJ. Effect of weight loss after weight loss surgery on plasma N-terminal pro-B- type natriuretic peptide levels. Am J Cardiol. 2010;106:1450–5. doi: 10.1016/j.amjcard.2010.06.076. [DOI] [PMC free article] [PubMed] [Google Scholar]
- 37.Iozzo P. Myocardial, Perivascular, and Epicardial Fat. Diabetes Care. 2011;34:S371–S9. doi: 10.2337/dc11-s250. [DOI] [PMC free article] [PubMed] [Google Scholar]
- 38.Morabito D, Vallotton MB, Lang U. Obesity is associated with impaired ventricular protein kinase C-MAP kinase signaling and altered ANP mRNA expression in the heart of adult Zucker rats. J Invest Med. 2001;49:310–8. doi: 10.2310/6650.2001.33895. [DOI] [PubMed] [Google Scholar]
- 39.Licata G, Volpe M, Scaglione R, Rubattu S. Salt-Regulating Hormones in Young Normotensive Obese Subjects - Effects of Saline Load. Hypertension. 1994;23:I20–I4. doi: 10.1161/01.hyp.23.1_suppl.i20. [DOI] [PubMed] [Google Scholar]
- 40.Fox CS, Massaro JM, Hoffmann U, Pou KM, Maurovich-Horvat P, Liu CY, Vasan RS, Murabito JM, Meigs JB, Cupples LA, D'Agostino RB, Sr, O'Donnell CJ. Abdominal visceral and subcutaneous adipose tissue compartments association with metabolic risk factors in the Framingham Heart Study. Circulation. 2007;116:39–48. doi: 10.1161/CIRCULATIONAHA.106.675355. [DOI] [PubMed] [Google Scholar]
- 41.Gallagher D, Kelley DE, Yim JE, Spence N, Albu J, Boxt L, Pi-Sunyer FX, Heshka S. Adipose tissue distribution is different in type 2 diabetes. Am J Clin Nutr. 2009;89:807–14. doi: 10.3945/ajcn.2008.26955. [DOI] [PMC free article] [PubMed] [Google Scholar]
- 42.Corti R, Burnett JC, Jr, Rouleau JL, Ruschitzka F, Luscher TF. Vasopeptidase inhibitors: a new therapeutic concept in cardiovascular disease? Circulation. 2001;104:1856–62. doi: 10.1161/hc4001.097191. [DOI] [PubMed] [Google Scholar]
- 43.Scharhag J, Herrmann M, Urhausen A, Haschke M, Herrmann W, Kindermann W. Independent elevations of N-terminal pro-brain natriuretic peptide and cardiac troponins in endurance athletes after prolonged strenuous exercise. Am Heart J. 2005;150:1128–34. doi: 10.1016/j.ahj.2005.01.051. [DOI] [PubMed] [Google Scholar]
- 44.Ross R, Dagnone D, Jones PJ, Smith H, Paddags A, Hudson R, Janssen I. Reduction in obesity and related comorbid conditions after diet-induced weight loss or exercise-induced weight loss in men. A randomized, controlled trial. Ann Intern Med. 2000;133:92–103. doi: 10.7326/0003-4819-133-2-200007180-00008. [DOI] [PubMed] [Google Scholar]
Associated Data
This section collects any data citations, data availability statements, or supplementary materials included in this article.