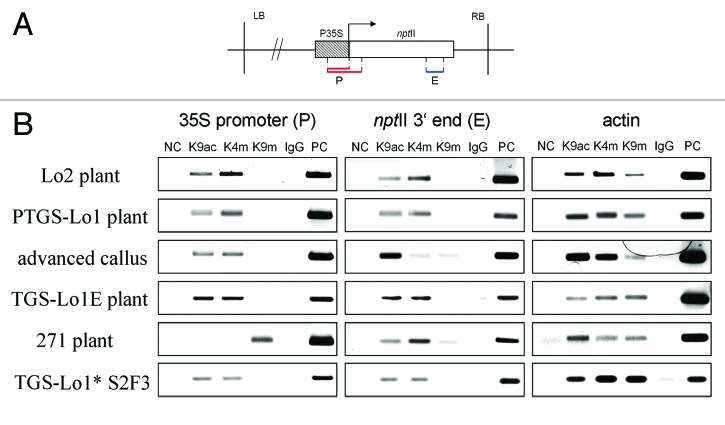
Figure 5. Histone modification patterns along the transgenes. (A) Schematic outline of subregions analyzed by ChIP: P (promoter) and E (3? end of nptII). The P subregion in locus 271 was shorter (upper line) than in loci 1 and 2 (bottom line). (B) Electrophoretic profiles of PCR products obtained by amplification of immunoprecipitated DNA. Results of a repeated experiment performed on an independent callus culture are shown in Figure S3.

An official website of the United States government
Here's how you know
Official websites use .gov
A
.gov website belongs to an official
government organization in the United States.
Secure .gov websites use HTTPS
A lock (
) or https:// means you've safely
connected to the .gov website. Share sensitive
information only on official, secure websites.
