

Introduction
S-adenosyl-L-methionine (SAMe) is a methyl donor for methyltransferase reactions and regulates the synthesis of glutathione, a main cellular antioxidant. SAMe is also involved in regulation of hepatocyte growth, differentiation, and death. Abnormal hepatic methionine metabolism is associated with the development of alcoholic liver disease (ALD) (Medici et al., 2011). Studies with ethanol-fed micropigs with histopathology of ALD were shown to have reduced liver SAMe levels whereas the administration of SAMe prevented these changes (Esfandiari et al., 2005; Villanueva et al., 2007). This report is an in-depth expansion on the histopathology findings from a previously reported double-blinded, placebo-controlled 24-week clinical trial that used SAMe for treatment of ALD patients (Medici et al., 2011). In the previous report, liver pathology was compared by change in score between SAMe and placebo groups using five quantitative histologic scores: steatosis, fibrosis, percent fibrosis per square field, inflammation, and Mallory-Denk bodies (MDB). Other clinical parameters such as the AST, ALT, bilirubin levels, change in MELD score and Child score were also studied in the previous report. As previously reported, there were no differences in changes in clinical or histopathological parameters following 24 weeks of either SAMe or placebo treatment (Medici et al., 2011). In the present study, we measured additional morphologic changes of the liver in biopsies obtained at baseline and after six months of SAMe treatment or placebo. The materials, methods, patient inclusion and exclusion criteria have been previously reported but are included here for clarity. For full details of the materials, methods, patient inclusion and exclusion criteria, the reader is referred to the previous (Medici et al., 2011) report.
Materials and methods
SAMe (S-adenosyl-L-methionone-SD4) was provided as a gift from Abbott Laboratories (Abbott Park, IL) in 400mg tablets. ALD patient volunteers were randomly assigned to receive SAMe or matching placebo using a computer-generated allocation sequence. Study subjects, care providers, study coordinator and those assessing outcomes were blinded to the intervention. Patients were instructed to continue all current medications but were prohibited from consuming alcoholic drinks. Patients were followed at 2-week intervals for 8 weeks, then at 4-week intervals until 24 weeks. Liver biopsies were obtained before treatment or placebo and at the end of the study. Patients were considered noncompliant and were dropped from the study if they were non-compliant with abstinence. The UC Davis Institutional Review Board approved the protocol (# 200311168-7), and all patients provided written informed consent (Medici et al., 2011). Inclusion criteria were a positive history of chronic alcohol abuse according to the World Health Organization definition (O’Connor et al., 1998) and the clinical features of ALD. Patients with laboratory findings of co-morbid liver disease such as chronic hepatitis B or C, primary biliary cirrhosis, autoimmune hepatitis, Wilson disease, or hereditary hemochromatosis were not included. Patients with cancer, congestive heart failure, renal insufficiency with serum creatinine >1.2 mg/ml, use of antifolate drugs or corticosteroids, or infectious illnesses were excluded (Medici et al., 2011).
Percutaneous biopsies were obtained from the right lobe of the liver by ultrasonic guidance using a 16G Jamshidi needle. The liver biopsies were graded using a Nikon E400 microscope equipped with a digital camera and Nikon Metomorph computer software (Molecular Devices Corporation, Downingtown, PA). The biopsies were graded on fourteen characteristics by semi-quantitative scores: for steatosis by H&E stain (1–4), for inflammation by H&E stain (1–4), for fibrosis by H&E stain and Sirius red stain (1–4), for percent fibrosis per square field (Metomorph software), for necrosis by H&E stain (0–3), for apoptosis by TUNEL stain, for stellate cell activation by smooth muscle actin stain (0–4), for Kupffer cells by CAM5.2 stain (0–3), for polymorphonulcear leukocytes (PMN) on H&E stain (0–3), for lipogranules on H&E stain (0–3), for lymphocytes on H&E stain (0–3), for balloon (ghost) cells by CAM5.2 stain (0–4), for MDB by CAM5.2 stain and Ubiquitin stain (1–4), and for duct metaplasia by AE1/AE3 stain (0–4).
Statistical Method
Data from six patients in the treatment group and eight patients in the placebo group who completed the study with both baseline and 24 week completion liver biopsies were entered using SigmaStat Software version 3.5 (Point Richmond, CA) and analyzed using ANOVA in parametric groups and Kruskal-Wallis One Way Analysis of Variance on Ranks in non-parametric groups. Comparisons of changes in each semi-quantitative histopathologic score in liver biopsies at week 0 versus week 24 were made between those from the SAMe treated and placebo groups. In order to determine the separate effects of 24 weeks of abstinence on histopathology scores, the values in each score from each subject were added together and differences in median scores were analyzed using the Mann-Whitney Rank Sum Test.
Results
Fourteen characteristics were studied comparing the SAMe treated group to the placebo group and the biopsy #1 (week 0) to biopsy #2 (week 24). Medians, inter-quartile ranges, and P-values for differences between the two groups are shown in Table 1. All differences had a P-value that was greater than 0.05, indicating that any recorded changes cannot be excluded as random. The medians were similar in both the treated and placebo group showing no significant differences in each score between biopsy #1 and biopsy #2 in each group. For example, the lymphocyte score median in the placebo group was 1 at both week 0 and week 24; in the treated group it was 0.5 at week 0 and 1 at week 24 (Figure 1) showing that they started off similarly. For duct metaplasia, the median in the treated group at week 0 was 4 and 3.5 at week 24 (Figure 2). For duct metaplasia in the placebo group, the median was 2.5 at week 0, and 2 at week 24 showing again that the two groups started off similarly and ended similarly. Duct metaplasia occurs at the liver edge of the portal or scarred areas, which activates stellate cells to promote parenchymal fibrosis. This activity was the same in both the treated and placebo groups.
Table 1.
Scores expressed as medians with interquartile ranges (25th, 75th percentile). P-values are calculated by Kruskal-Wallis One Way Analysis of Variance on Ranks, comparing SAMe treated group to placebo group at time points 0 weeks and 24 weeks. P >= 0.05 indicates that there is not a statistically significant difference among median values of groups. The differences in median values are not great enough to exclude the possibility that the difference is due to random sampling variability
| Week 0 | Week 24 | ||||||
|---|---|---|---|---|---|---|---|
| Score type | n | Median | Interquartile Range | Median | Interquartile Range | P-Value | |
| Necrosis | SAMe | 6 | 0 | (0, 0) | 0 | (0, 0) | 0.332 |
| Placebo | 8 | 0 | (0, 0) | 0 | (0, 0) | ||
| TUNEL stain | SAMe | 6 | 5.5 | (1, 15) | 5.5 | (0, 20) | 0.623 |
| Placebo | 8 | 8.5 | (8, 19.5) | 10.5 | (4.5, 16) | ||
| Smooth muscle actin stain | SAMe | 6 | 2 | (2, 4) | 1.5 | (1, 2) | 0.079 |
| Placebo | 8 | 2 | (1, 3) | 0.5 | (0, 1) | ||
| Kupffer | SAMe | 6 | 0.5 | (0, 1) | 1 | (0, 1) | 0.657 |
| Placebo | 8 | 1 | (0, 2) | 0 | (0, 1) | ||
| PMN | SAMe | 6 | 0 | (0, 1) | 0.5 | (0, 1) | 0.733 |
| Placebo | 8 | 0 | (0, 1) | 0 | (0, 0.5) | ||
| Lipogranules | SAMe | 6 | 0 | (0, 0) | 0 | (0, 1) | 0.205 |
| Placebo | 8 | 0 | (0, 0.5) | 0 | (0, 0) | ||
| Lymphocytes | SAMe | 6 | 0.5 | (0, 2) | 1 | (0, 1) | 0.499 |
| Placebo | 8 | 1 | (1, 2) | 1 | (1, 1.5) | ||
| Balloon cells | SAMe | 6 | 0.5 | (0, 1) | 1 | (0, 1) | 0.935 |
| Placebo | 8 | 0 | (0, 2) | 0.5 | (0, 2) | ||
| Duct metaplasia | SAMe | 6 | 4 | (2, 4) | 3.5 | (2, 4) | 0.249 |
| Placebo | 8 | 2.5 | (1.5, 3) | 2 | (1.5, 3) | ||
Figure 1.
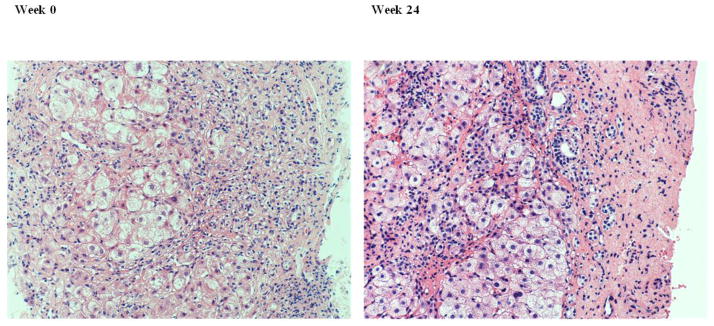
Liver biopsy from a patient in the treated group. H&E showing that there are similar numbers of hepatocytes and lymphocytes at week 0 and week 24 and the amount of fibrosis was unchanged. (Magnification 200x)
Figure 2.
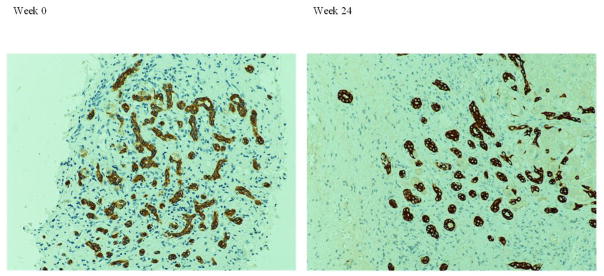
Liver biopsy from a patient in the treated group. AE1/AE3 stain showed no significant change in duct metaplasia comparing week 0 with week 24. (Magnification 200x)
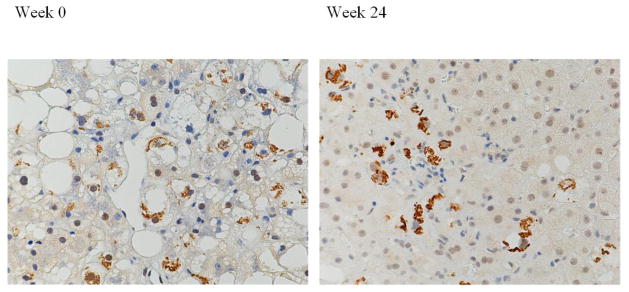
Several different changes were advanced at baseline in a single liver biopsy, where one biopsy showed necrosis, balloon cell formation, lipogranules, and presence of MDB at the same time. Some liver biopsies showed mostly fibrosis, nodular regeneration, duct metaplasia, and almost no normal hepatocytes remaining at baseline. For balloon cells, the median in the treated group at week 0 was 0.5 and the 1 at week 24. Figure 3 shows balloon cells at different stages of formation and we see that MDB formed within the balloon cells.
Figure 3.

High power view of a liver biopsy, CAM5.2 stain, showed balloon cell formation at different stages (arrow) and presence of Mallory-Denk bodies (curved arrow). (Magnification 400x)
When both groups were analyzed as a whole to measure just the effect of abstinence comparing changes between biopsy #1 and biopsy #2 (Table 2), only the median smooth muscle actin stain score decreased from 2 to 1 with a P-value = 0.027. For the rest of the characteristics, the p-values remained greater than 0.05.
Table 2.
Scores are expressed as Median and interquartile range (25th, 75th percentile). P-values are calculated by Mann-Whitney Rank Sum Test were P<0.05 indicates a statistically significant difference in the median values between the two groups and P>=0.05 indicates the difference in the median values between the two groups is not great enough to exclude the possibility that the difference is due to random sampling variability. Smooth muscle actin stain decreased at week 24
| Treated group | Week 0 | Week 24 | ||||
|---|---|---|---|---|---|---|
| Score type | n | Median | Interquartile Range | Median | Interquartile Range | P-Value |
| Steatosis* | 14 | 2 | (1, 4) | 1 | (0, 2) | 0.164 |
| Inflammation* | 14 | 1 | (1, 2) | 1 | (1, 2) | 0.480 |
| Necrosis | 14 | 0 | (0, 0) | 0 | (0, 0) | 0.079 |
| Fibrosis* | 14 | 3 | (2, 4) | 3 | (2, 4) | 0.962 |
| TUNEL stain | 14 | 8 | (6, 17) | 8.5 | (2, 16) | 0.661 |
| Percent fibrosis per square field* | 14 | 4 | (2.69, 8.37) | 6.57 | (2.80, 11.76) | 0.597 |
| Smooth muscle actin stain | 14 | 2 | (1, 3) | 1 | (0, 2) | 0.027 |
| Kupffer | 14 | 1 | (0, 2) | 0.5 | (0, 1) | 0.474 |
| PMN | 14 | 0 | (0, 1) | 0 | (0,1) | 0.978 |
| Lipogranules | 14 | 0 | (0, 0) | 0 | (0, 0) | 0.970 |
| Lymphocytes | 14 | 1 | (0, 2) | 1 | (1, 1) | 0.960 |
| Balloon cells | 14 | 0 | (0, 1) | 1 | (0, 1) | 0.548 |
| Mallory-Denk bodies* | 14 | 1 | (0, 3) | 1 | (0, 2) | 0.473 |
| Duct metaplasia | 14 | 3 | (2, 4) | 2 | (2, 4) | 0.701 |
Denotes score types previously reported by Medici et al., 2011; however, now the treatment and placebo scores are combined
Discussion
Statistical analysis revealed no statistically significant difference in the twelve liver biopsy characteristics studied when comparing the SAMe treated group to the placebo group from week 0 to week 24. These results are an expansion of the previous report (Medici et al., 2011), which found no treatment differences in scores for steatosis, fibrosis, percent fibrosis, inflammation, and MDB over the duration of the study, but were analyzed using a different statistical method (Medici et al., 2011). The nine additional characteristics studied here also did not show statistically significant changes at 24 weeks. This is important since one would expect that many features of liver injury would improve from abstinence of alcohol consumption. However, the smooth muscle actin stain score improved when the results of the treatment and placebo groups were combined.
Even though the changes were not statistically significant, there were still minor changes that were interesting although not quantifiable. For example, MDB formation was seen in a perivenular location in one placebo participant at week 0, but at week 24, the MDB seemed to form more centrally (Figure 5). Also the MDB may be the same in number, but different in terms of size and thickness; for example one may be more ropey and long whereas others may be thin and short.
Figure 5.
Liver biopsy from a patient in the placebo group. Ubiquitin stain showing perivenular Mallory-Denk bodies located at week 0 but more in zone 3 at week 24. (Original magnification 200x)
We do need to take into account that all participants had moderate to severe baseline disease (with steatosis and fibrosis) to begin with and the response to SAMe treatment may require a larger number of normal functioning hepatocytes. Some liver biopsies consisted of mostly fibrosis, nodular degeneration, and duct metaplasia so that there were very few normal hepatocytes remaining (but this can be due to sampling). This advanced disease would make it hard to see even minimal improvement after six months. Other liver biopsies had centrolobular fibrosis, portal fibrosis, and bridging fibrosis to begin with, so that additional fibrosis is likely hard to quantify via scores alone, however, fibrosis may change in location, for example there may be reduced pericellular fibrosis but the centrolobular fibrosis remained the same. This study is unique in that most of the patients did not start off with high inflammation scores (median scores were 0 at baseline and at week 24), which is often thought to be high in ALD patients. Findings from this study also suggest that it may not be beneficial to wait for more definitive treatment, like liver transplant in ALD patients, since the liver tissue remained with the same degree of pathology six months out, regardless of treatment. This opposes the idea that delaying liver transplant by six months is beneficial for the repair process of the liver when alcohol consumption stops.
The greatest limitation in this study is the small number of participants, which decreased the study power considerably. To increase the n (and therefore the power) of the study, we combined the treatment and placebo groups since neither group showed a significant difference from biopsy #1 to biopsy #2 alone. This resulted in a decrease over time for all biopsies in the amount of activated stellate cells seen using the smooth muscle actin stain. Stellate cell activation is known to play a role in the initial stages of hepatitis B and C virus induced fibrosis but is not as active once the fibrosis activity remains stable (Lau et. al, 2005, Akpolat et. al, 2005). Other than increasing the n, future studies might also lengthen the follow-up biopsy to one year or two years, which might show a beneficial effect from alcohol abstinence.
We note that staining was not always consistent from week 0 to week 24 (for example the CAM5.2 stain may be darker in one group), which poses a problem during scoring. Another limitation was the variability in biopsy location in the liver: some liver biopsies clearly had a liver capsule and others did not. It is known that disease affects the different liver geographic locations differently. We noticed in one participant, the biopsy immediately beneath the capsule had more inflammation, lymphocytes, and balloon cells, but the repeat biopsy (showing no capsule), which is postulated to be deeper in position, appeared to be almost normal. Sometimes, the steatosis was macrovesicular to start with, and the repeat biopsy showed the same score of steatosis, but it was now microvesicular. Although we did look at fourteen characteristics, there are some characteristics that have not yet been quantified: some hepatocytes were more eosinophilic or oxyphilic than others, which may be a pre-neoplastic change. Future studies may want to include additional characteristics of liver histopathology to access change in SAMe treatment in ALD patients.
Figure 4.
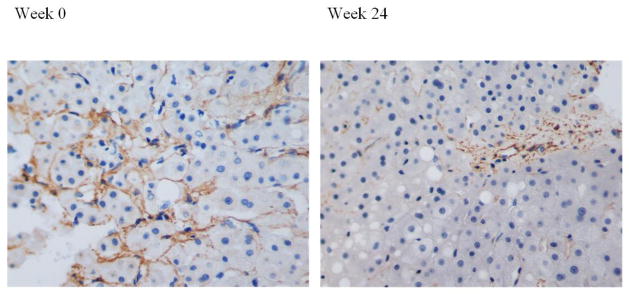
Liver biopsy with SMA stain showing decrease in stellate cell activation from week 0 with week 24. (Magnification 200x)
Highlights.
Liver biopsies were compared in alcoholic patients treated with SAMe versus placebo.
No difference in biopsy histology between groups was seen from week 0 to week 24.
With both groups added together, the smooth muscle actin stain score did decrease.
Acknowledgments
This report is supported by grants from the National Institutes of Health: R01 AA14562 to Dr. Charles H. Halsted; and AA 008116, AA 020585, and P50-11999 Morphology Core to Dr. Samuel W. French.
This report was partially presented in abstract form at the Experimental Biology Annual Meeting in April 2013.
Footnotes
Publisher's Disclaimer: This is a PDF file of an unedited manuscript that has been accepted for publication. As a service to our customers we are providing this early version of the manuscript. The manuscript will undergo copyediting, typesetting, and review of the resulting proof before it is published in its final citable form. Please note that during the production process errors may be discovered which could affect the content, and all legal disclaimers that apply to the journal pertain.
Contributor Information
Mary D. Le, Email: maryinpink@gmail.com, Harbor-UCLA Medical Center, Department of Pathology, Box 12, 1000 West Carson St, Torrance, CA, 90502, Phone: 8089272487, Fax: 3102228002
Elena Enbom, Email: eenbom@yahoo.com, Harbor-UCLA Medical Center, Department of Pathology, Box 12, 1000 West Carson St, Torrance, CA, 90502, Office: 3102222241, Fax: 3102228002
Peter K. Traum, Email: petertraum@gmail.com, Harbor-UCLA Medical Center, Department of Pathology, Box 12, 1000 West Carson St, Torrance, CA, 90502, Office: 3102222241, Fax: 3102228002
Valentina Medici, Email: valentina.medici@ucdmc.ucdavis.edu, Assistant Professor, University of California, Davis, Division of Gastroenterology & Hepatology, Department of Internal Medicine, 4150 V Street, Suite 3500, Sacramento, CA 95817, Office: 916-734-3751, Fax: 916-734-7908
Charles H. Halsted, Email: chhalsted@ucdavis.edu, Professor of Internal Medicine and Nutrition, Genome and Biomedical Research Facility, Room 6323, 451 E. Health Sciences Drive, University of California, Davis, Davis, CA 95616, Office: 530-752-4054
Samuel W. French, Email: sfrench@labiomed.org, Chair Anatomic Pathology, Harbor-UCLA Medical Center, Department of Pathology, Box 12, 1000 West Carson St, Torrance, CA, 90502, Office: 3102222643, Fax: 3102228002.
References
- 1.Akpolat N, et al. The value of alpha-SMA in the evaluation of hepatic fibrosis severity in hepatitis B infection and cirrhosis development: a histopathological and immunohistochemical study. Histopathol. 2005;47:276–80. doi: 10.1111/j.1365-2559.2005.02226.x. [DOI] [PubMed] [Google Scholar]
- 2.Cederbaum AI. Hepatoprotective effects of S-adenosyl-L-methionine against alcohol- and cytochrome P450 2E1-induced liver injury. World J Gastroenterol. 2010;16:1366–1376. doi: 10.3748/wjg.v16.i11.1366. [DOI] [PMC free article] [PubMed] [Google Scholar]
- 3.Esfandiari F, et al. Chronic ethanol feeding and folate deficiency activate hepatic endoplasmic reticulum stress pathway in micropigs. Am J Physiol Gastrointest Liver Physiol. 2005;289:G54–63. doi: 10.1152/ajpgi.00542.2004. [DOI] [PubMed] [Google Scholar]
- 4.French SW, et al. VA cooperative study group 119. Semin Liver Dis. 1993;13:154–69. doi: 10.1055/s-2007-1007346. [DOI] [PubMed] [Google Scholar]
- 5.Gong Z, et al. Effects of S-adenosylmethionine on liver methionine metabolism and steatosis with ethanol-induced liver injury in rats. Heapatol Int. 2008;2:346–352. doi: 10.1007/s12072-008-9082-1. [DOI] [PMC free article] [PubMed] [Google Scholar]
- 6.Lau DT, et al. Intrahepatic gene expression profiles and alpha-smooth muscle actin patterns in hepatitis C virus induced fibrosis. J Hepatol. 2007;42:273–81. doi: 10.1002/hep.20767. [DOI] [PubMed] [Google Scholar]
- 7.Lee TD, et al. Abnormal hepatic methionine and glutathione metabolism in patients with alcoholic hepatitis. Alcohol Clin Exp Res. 2004;28:173–81. doi: 10.1097/01.ALC.0000108654.77178.03. [DOI] [PubMed] [Google Scholar]
- 8.Mato JM, et al. S-adenosylmethionine in alcoholic liver cirrhosis: A randomized, placebo-controlled, double-blind, multicenter clinical trial. J Heaptol. 1999;30:1081–9. doi: 10.1016/s0168-8278(99)80263-3. [DOI] [PubMed] [Google Scholar]
- 9.Medici V, et al. S-adenosyl-L-methionine treatment for alcoholic liver disease: A double-blinded, randomized, placebo-controlled trial. Alcohol Clin Exp Res. 2011;35:1960–5. doi: 10.1111/j.1530-0277.2011.01547.x. [DOI] [PMC free article] [PubMed] [Google Scholar]
- 10.Powell CL, et al. Mechanism for prevention of alcohol-induced liver injury by dietary methyl donors. Toxicol Sci. 2010;115:131–139. doi: 10.1093/toxsci/kfq031. [DOI] [PMC free article] [PubMed] [Google Scholar]
- 11.Purohit V, et al. Role of S-adenosylmethionine, folate, and betaine in the treatment of alcoholic liver disease: summary of a symposium 1′2′3′4. Am J Clin Nutr. 2007;86:14–24. doi: 10.1093/ajcn/86.1.14. [DOI] [PubMed] [Google Scholar]
- 12.Villanueva JA, et al. S-adenosyl-L-methionine attenuates oxidative liver injury in micropigs fed ethanol with a folate-deficient diet. Alcohol Clin Exp Res. 2007;31:1934–43. doi: 10.1111/j.1530-0277.2007.00511.x. [DOI] [PubMed] [Google Scholar]