

Abstract
Melanoma brain metastasis (MBM) represents a frequent complication of cutaneous melanoma. Despite aggressive multi-modality therapy, patients with MBM often have a survival rate of <1 year. Alteration in DNA methylation is a major hallmark of tumor progression and metastasis; however, it remains largely unexplored in MBM. In this study, we generated a comprehensive DNA methylation landscape through the use of genome-wide copy number, DNA methylation and gene expression data integrative analysis of melanoma progression to MBM. A progressive genome-wide demethylation in low CpG density and an increase in methylation level of CpG islands according to melanoma progression were observed. MBM-specific partially methylated domains (PMDs) affecting key brain developmental processes were identified. Differentially methylated CpG sites between MBM and lymph node metastasis (LNM) from patients with good prognosis were identified. Among the most significantly affected genes were the HOX family members. DNA methylation of HOXD9 gene promoter affected transcript and protein expression and was significantly higher in MBM than that in early stages. A MBM-specific PMD was identified in this region. Low methylation level of this region was associated with active HOXD9 expression, open chromatin and histone modifications associated with active transcription. Demethylating agent induced HOXD9 expression in melanoma cell lines. The clinical relevance of this finding was verified in an independent large cohort of melanomas (n = 145). Patients with HOXD9 hypermethylation in LNM had poorer disease-free and overall survival. This epigenome-wide study identified novel methylated genes with functional and clinical implications for MBM patients.
INTRODUCTION
Cutaneous melanoma represents the most frequent life-threatening skin cancer, whereby its incidence has increased over the last three decades (1). This tumor evolves from the local transformation of normal melanocytes (MNC) to a primary melanoma (PRM), acquiring the capability of metastasizing to multiple organ sites – most commonly to the lung, liver and brain – via regional drainage to lymph node metastasis (LNM) or directly through the hematogenous route (2). Cutaneous melanoma has one of the highest potential to metastasize to distant organ sites. According to the American Joint Committee on Cancer (AJCC), 40% of Stage IV melanoma patients develop brain metastasis (MBM). However, data derived from autopsies reveal that almost 70% of patients have subclinical MBM (3). Despite aggressive multi-modality therapy, patients with MBM have a median survival rate of <1 year, with a majority of these patients dying as a result of their intracranial disease (3,4). The understanding of molecular alterations in MBM that could be used as diagnostic and therapeutic targets is still limited.
Metastasis is triggered by a combination of genetic and epigenetic alterations, which can affect the functionality and expression of multiple cancer-related genes. Epigenetic alterations, including histone modifications, non-coding RNA expression and DNA methylation, have been associated with metastasis initiation and progression (5). Methylation of cytosine residues occurs throughout the entire genome and is often found in a sequence context of CpG and less frequently in a context of CpH (where H can be A, C or T) (6). It has been largely described in human cancers that alterations in genomic DNA methylation patterns include two counteracting events: global demethylation occurring at CpG-poor regions and gene-focused de novo methylation (7,8). New evidence suggests that evaluating and understanding the epigenome-wide distribution of DNA methylation and its CpG context is needed to fully comprehend the impact of DNA methylation on gene expression and cellular phenotype (9,10). Recent technological advances in high-throughput epigenomic analysis have demonstrated that differentially methylated regions between tumor and normal tissues are not predominantly located at CpG islands, but rather in regions of lower CpG density (11). Based on CpG dinucleotide density and distribution, the CpG context has been divided into regions of high CpG density called ‘islands’, regions of lower CpG density located around the islands called ‘shores’ (up to 2 kb away from the island) and ‘shelves’ (2–4 kb away from the island), and intergenic and intragenic regions distant from CpG islands (>4 kb away from a CpG island) denominated as ‘open sea’ (6,11,12).
Our previous studies indicate that melanoma progression is prompted by changes in DNA methylation, which affect the normal expression of multiple melanoma-related genes, showing clinical (diagnostic and prognostic) utility in melanoma patients with localized or metastatic disease (13–17). Moreover, alterations in DNA methylation of multiple gene promoter regions have been reported in early passage melanoma cell lines (18). Recent findings suggest that epigenome-wide DNA methylation profiles can predict overall survival in patients with melanoma stage IIIC (19). Nevertheless, epigenome-wide DNA methylation changes involved in melanoma progression to MBM have been largely unexplored.
The aims of this study were to determine epigenome-wide DNA methylation changes during melanoma progression to MBM and to contribute to the identification of novel diagnostic and potential theranostic targets. To address this issue, we analyzed genome-wide copy number, DNA methylation and gene expression of specimens from different stages of cutaneous melanoma progression to brain metastasis: MNC, PRM (AJCC Stage II), LNM (AJCC Stage III) and MBM (AJCC Stage IV).
RESULTS
Data analysis
Using the Infinium HumanMethylation450K (HM450K) platform, the methylation status of 485 512 cytosines (482 169 CpG dinucleotides and 3343 CpNpG trinucleotides) in 40 melanoma-related specimens representing different stages of melanoma progression was analyzed (GEO accession number: GSE44661; Supplemental Material, Table S1). The HM450K platform provided coverage of 21 231 (99%) annotated genes with an average of 17.2 probes per gene distributed across the promoter, 5′ UTR, first exon, gene body and 3′ UTR regions. These probes were designed to target 26 658 (96%) annotated CpG islands and their CpG context of shores, shelves and distant regions (>4 kb) identified as ‘open sea’ (12). Analysis of HM450K probes distribution showed that CpG island and CpG shore probes were predominantly located at gene promoter regions, while CpG shelf and ‘open sea’ probes were predominantly located at gene body and intergenic regions (Supplemental Material, Fig. S1A). Analysis of CpG dinucleotide content for each HM450K probe identified that CpG island probes recognized regions with the highest CpG density (mean = 29.8%) while CpG shore, ‘open sea’ and CpG shelf probes recognized regions with lower CpG density (mean = 18.8, 17.4 and 15.6%, respectively; Supplemental Material, Fig. S1B). The study was based on the analysis of probes that recognize cytosines located in somatic chromosomes (probes recognizing sex chromosomes were excluded to avoid sex-related biases). Probes with ‘failed’ calls in any specimen were not considered for downstream analyses; consequently, 7040 probes (1.4%) were excluded (see Materials and Methods section). Figure 1 describes the outline of statistical filters and analysis workflow used in this study.
Figure 1.

Diagram of DNA methylation analysis pipeline. SNPa: probes designed to recognize SNP. SNPb: probes recognizing CpG sites with a common SNP within 20 bp of the recognition site. Repeat seqc probes containing repeated sequences. CNV, copy number variation.
Epigenome-wide DNA methylation changes during cutaneous melanoma progression to brain metastasis
To identify the changes in the distribution of DNA methylation during melanoma progression, we compared β-values of 466 824 probes in MNC, PRM, LNM and MBM specimens. Epigenome-wide DNA methylation level (mean β-value) significantly decreased with melanoma progression (Fig. 2A). The relative demethylation identified in melanoma specimens was focused on CpG shelf and ‘open sea’ regions and followed a progressive demethylation according to melanoma progression. On the other hand, CpG islands presented a significant progressive increase in DNA methylation level (Fig. 2B; Supplemental Material, Fig. S2). Significant differential distribution of DNA methylation level according to genomic compartments was also observed during melanoma progression. While DNA methylation in promoter-associated CpG sites significantly increased, methylation level of intergenic regions significantly decreased in melanoma specimens. Gene body DNA methylation was significantly lower in metastatic melanoma specimens (LNM and MBM) than that in MNC and PRM (Fig. 2C; Supplemental Material, Fig. S3). Based on the statistical mean of CpG percentage (10.18% ± 0.009), HM450 K probes were categorized in low and high CpG density. Significant progressive decrease in DNA methylation level in low CpG density was observed during progression to MBM. Conversely, significant increase in DNA methylation level in high CpG density regions was observed between MNC and melanoma specimens (Fig. 2D). A shift from a bimodal distribution with peaks at lowly methylated sites (LMS; β ≤ 0.2) and highly methylated sites (HMS; β ≥ 0.7) to a more flattened distribution increasing the representation of partially methylated sites (PMS; 0.2 > β < 0.7) was observed in melanoma progression to MBM (Fig. 2A). The number of LMS and HMS significantly decreased in cancer specimens compared with MNC, whereas the number of PMS significantly increased during melanoma progression to MBM (Fig. 2E–G). A significant and progressive increment in the number of PMS in CpG islands was observed according to melanoma progression (Fig. 2D–F; Supplemental Material, Fig. S4). Sequencing of bisulfite-treated human DNA has revealed the existence of large tissue-specific genomic regions of partially methylated domains (PMDs) that are associated with transcription repression (20,21). A three-state hidden Markov model (HMM) was used to infer PMDs for each specimen included in this study. A total of 747 genes were associated with MBM-specific PMDs; these genes presented enrichment in brain development and neurological system functions (Fig. 2H; Supplemental Material, Table S2).
Figure 2.

Distribution of methylated CpG sites in accordance with melanoma progression to the brain. (A) β-values were grouped every 0.1 increment, and the percentage of probes was represented for each specimen type. The mean β-value for each specimen type is shown between parentheses. Lowly, partially and highly methylated sites are indicated. (B–D) DNA methylation level of each specimen type according to CpG context (B), genomic compartment (C) and CpG density (D). Bonferroni-adjusted P-value < 0.05 was considered significant threshold, compared with MNC (*), compared with PRM (#), compared with LNM (‡) and compared with MBM (§). (E–G) Stacked bar plot depicting the number of lowly (E), partially (F) and highly (G) methylated sites for each specimen type according to CpG context. (H) Venn's diagram showing the relationship of PMDs between all the specimen types.
Identification of CpG sites differentially methylated between LNM from patients with good prognosis versus MBM
To identify significant changes in DNA methylation associated with MBM, differentially methylated CpG sites (DMSs) between LNM from patients with good prognosis (DFS > 5 years; n = 10) and MBM (n = 16) were evaluated. LNM specimens from patients with poor prognosis were excluded from this analysis (n = 7) to avoid the interference of DNA methylation alterations associated with distant organ metastasis that may be present in LNM from patients with poor prognosis. Initially, we identified 1593 CpG sites associated with annotated genes with a mean β-value difference of >0.3. Of these, 494 (31%) CpG sites presented lower and 1099 (69%) CpG sites presented higher DNA methylation level in MBM (Fig. 3A). We then considered whether the DMSs had common single-nucleotide polymorphisms (SNP) or contained a repeated sequence in the probe recognition site. A total of 230 probes met at least one of these conditions and were therefore excluded from the analysis (Fig. 1). In order to discard any potential influence of allele copy number (CN) variation, we estimated the CN status of a 500-bp region around the recognized CpG site (250 bp 5′ and 250 bp 3′ of the CpG site). Genome-wide Affymetrix Human SNP array 6.0 was used to establish the regional CN of specimens included in the DNA methylation analysis (9 LNM and 7 MBM; Supplemental Material, Table S1). This information enabled us to identify and exclude 73 CpG sites, which presented significant CN variation between LNM and MBM (Wilcoxon, P < 0.05; Supplemental Material, Table S3). Finally, we assessed the statistical significance of differential DNA methylation of the remaining 1290CpG sites. Using an FDR-corrected P ≤ 0.005 as the significant statistical threshold, 217 DMSs associated with annotated genes were identified. Of these, 41 (18.9%) CpG sites presented lower and 176 (81.1%) CpG sites presented higher DNA methylation level in MBM specimens (Fig. 3B; Supplemental Material, Table S4). These DMSs were most frequently located at CpG shores, specifically found at gene promoter regions (Supplemental Material, Fig. S5). In addition, 69 of these sites were located within a LNM- or MBM-specific PMD (Supplemental Material, Table S4).
Figure 3.

Identification of differentially methylated CpG sites in between LNM and MBM. (A) Scatter plot depicting the difference in the mean β-value of 466 824 CpG sites (dots) between LNM and MBM. This plot is organized by somatic chromosome and shows the threshold used in this study (difference in β-value ≥ 0.3). (B) Scatter plot showing 217 DMSs between LNM and MBM. Forty-one sites presented lower (green dots) and 176 presented higher (red dots) DNA methylation level in MBM. (C) Heat map showing a hierarchical cluster analysis performed with the Euclidean metric distance between MBM (n = 16; blue bar) and LNM from patients with good prognosis (n = 10; gray bar), represented in columns. DNA methylation profile of each specimen includes 217 DMSs, represented in rows. Bootstrap (Bt) support analysis value is shown.
Unsupervised hierarchical cluster analysis displayed a significant separation of LNM and MBM specimens into two clades. In the phenetic tree, the branch connecting these metastatic clades was supported by a bootstrap value of 100 (Fig. 3C). Analysis of the Euclidean metric distance verified the existence of two clusters in metastatic melanoma specimens (one containing LNM and the other MBM specimens) and two main clusters in the DMSs (one containing CpG sites with lower and the other containing CpG sites with higher DNA methylation level in MBM). The metric distances between metastatic melanoma specimens and between DMSs were examined using terrain maps and distance matrices (Supplemental Material, Fig. S6).
Functional implications of differentially methylated sites between LNM from patients with good prognostic versus MBM
The 217 DMSs are located within or surrounding 174 annotated genes (Supplemental Material, Table S4). To evaluate the impact of differential methylation on gene expression, the Pearson's correlation coefficient (r) was calculated between DNA methylation level of each DMS and transcript level of the associated genes. Gene expression was evaluated by Affymetrix Human Exon ST Array 1.0 (Supplemental Material, Table S1). Significant negative correlations (r, P < 0.05) between the methylation levels of 61 DMSs and the expression levels of 38 related genes were identified (Supplemental Material, Table S5). In addition, significant positive correlations (r, P < 0.05) between the methylation levels of 11 DMSs and the expression levels of 10 related genes were identified. Overall, the DNA methylation of 72 CpG sites influenced the expression of 48 genes, of which 14 were associated with a LNM- or MBM-PMD (Supplemental Material, Table S5). DMSs correlated with gene expression were most frequently located at CpG islands, specifically at gene promoter regions. Among the negatively correlated CpG sites, the most frequent location was gene promoter CpG island, whereas for the positively correlated CpG sites, there was no significant difference in the distribution with a higher frequency detected in ‘open sea’ regions located at gene bodies (Supplemental Material, Fig. S7). In addition to the differential DNA methylation, 12 of these 48 genes presented significant differential expression between LNM and MBM specimens (Wilcoxon, FDR-corrected P < 0.05; Fig. 4A). Of these 12 genes, three were up-regulated and nine were down-regulated in MBM. Unsupervised hierarchical cluster analysis showed that the expression of these 12 genes separated LNM and MBM specimens into two clades and the topology of the two main branches was supported by a bootstrap value of 100 (Fig. 4B).
Figure 4.
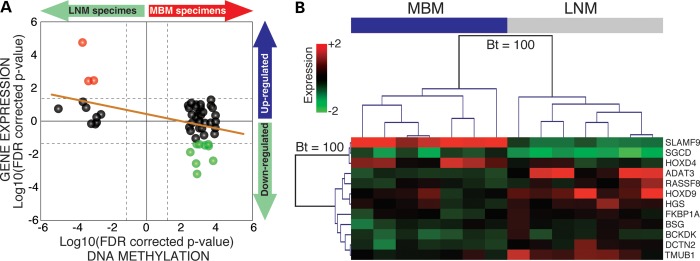
Genomic DNA methylation and gene expression data integration. (A) Correlation between DNA methylation and gene expression. Two-dimensional starburst plot of 48 differentially methylated genes. If the difference between mean gene expression was positive (MBM > LNM), log10 (FDR-corrected P-value) was multiplied by −1 generating positive values [same correction for positive β-value differences (MBM > LNM)]. Dashed lines represent the statistical threshold (FDR-corrected P = 0.05). The orange solid line indicates trend of the integration. Red dots indicate up-regulated and green dots indicate down-regulated genes in MBM. (B) Unsupervised hierarchical cluster analysis for gene expression. This analysis includes 12 differentially methylated and expressed genes between MBM (n = 7; blue bar) and LNM from patients with good prognosis (n = 7; gray bar). Bootstrap (Bt) support analysis value is shown.
Identification of affected gene networks and cellular functions in MBM
To identify potential functional changes associated with the alteration of 48 genes affected by differential DNA methylation, the Ingenuity Pathway Analysis software was used to investigate affected gene networks and the DAVID functional annotation tool was used to identify enriched gene ontology. The most affected network, containing 19 of these 48 genes, involved cell cycle, cell morphology and hematological system development functions. This network included genes related to melanoma and other cancer progression such as RASFF1A, RAS, AKT, MAPK, IRS2, BRCA1, PIK3CA, RAC2 and VEGF, among others. The second most-affected gene network was involved in functions related to RNA post-transcriptional modifications in which epigenetic processes including non-coding RNA expression have an important role. In this network, interactions with histones H2Bh, H2Bo and H2A were observed (Supplemental Material, Table S6). The panel of 48 genes was also associated with inflammatory response and cancer-related processes (Supplemental Material, Table S7). Alterations in three of these genes (FKBP1A, BRCA1 and BUB3) have been related to dermatological diseases (22,23). Gene ontology analysis showed enrichment of cell cycle regulation, morphology, and assembly, DNA repair, recombination, and replication functions in MBM (Supplemental Material, Table S8). Finally, analysis of physiological systems affected in MBM revealed significant enrichment in developmental processes highlighting the impact of alterations in Homeobox (HOX) genes (Supplemental Material, Table S9). From this point on, we focused on the analysis of DNA methylation alterations in HOX genes in melanoma specimens.
Aberrant DNA methylation level of HOX gene family detected in metastatic melanoma
The HOX gene family has been related to different human tumors, including malignant cutaneous melanoma (24). Our analysis identified 10 members of the HOX gene family containing 17 DMSs in MBM (Supplemental Material, Table S4). Two genes in the HOXA cluster, HOXA3 and HOXA5, were less methylated in MBM than those in LNM. Two genes in the HOXB cluster HOXB3 and HOXB5 and the antisense gene HOXB-AS3 were more methylated in MBM than those in LNM. Three genes in the HOXC cluster HOXC4, HOXC5 and HOXC6 were more methylated in MBM than those in LNM. In the HOXD cluster, we observed that while the HOXD4 gene was less methylated, the HOXD9 gene was more methylated in MBM than that in LNM. In addition to differential DNA methylation, the HOXD4 and HOXD9 genes were differentially expressed in MBM (Fig. 4B). A specific analysis of the genomic region coding HOXD cluster (chr2: 176 956 396–177 055 168) showed that HOXD11, HOXD12 and HOXD13 genes presented higher DNA methylation levels in metastatic melanoma specimens (LNM and MBM) than those in PRM and MNC. The HOXD9 gene presented a higher DNA methylation level in MBM in comparison with early stages of the disease and was associated with a 20-kb MBM-PMD, spanning from HOXD11 to HOXD8 (chr2: 176 973 275–176 993 841) (Supplemental Material, Fig. S8).
Analysis of the epigenomic environment of HOXD9 gene in melanoma-related specimens
A significant negative correlation between HOXD9 mRNA expression and DNA methylation level (r, P < 0.05) of 10 CpG sites located in a 946-bp region surrounding the TSS (from −753 to +193 bp) of the HOXD9 gene was detected (Fig. 5A and B). This region was included into the promoter CpG island of the gene and presented a higher DNA methylation level in MBM (Fig. 5C). Another CpG site located at the upstream CpG shore (−1151 bp) also presented a significant negative correlation with gene expression (Fig. 5B). The region surrounding the TSS was contained into a MBM-specific PMD (Fig. 5D). Open chromatin status in the human genome is identified by DNaseI Hypersensitive Sites (DHS), defining regions of accessible DNA with potentially active gene transcription (25,26). To evaluate the chromatin status around HOXD9 TSS, ENCODE project (27) DHS sequencing data of one melanocyte (Melano) and two metastatic melanoma cell lines (Colo 829 and Mel 2183) was integrated to our study as a reference. This analysis revealed lower accessibility in metastatic melanoma than that in MNC cell lines (Fig. 5E; data accessible at UCSC Genome browser under the track Duke DNaseI HS Open. GEO accession numbers: GSM816631, GSM1008571 and GSM1008599). Integrating data from human MNC generated by the NIH Roadmap Epigenomics Mapping Consortium (28), the relation between gene expression, DNA methylation, chromatin accessibility and histone modifications was analyzed. Active HOXD9 expression was associated with low DNA methylation level, open chromatin status and histone modifications associated with active transcription (H3K4me1 and H3K4me3) of the region surrounding the TSS of HOXD9 gene (Supplemental Material, Fig. S9).
Figure 5.

DNA methylation of HOXD9 gene during melanoma progression. (A) HOXD9 gene structure [based on RefSeq Feb. 2009 (GRCh37/hg19) assembly] and CpG islands (CpGI). Blue boxes represent the first and second exons and green boxes two different CpG islands. CpG context (CpG islands and CpG shores) has been highlighted in this figure. (B) Correlation analysis between DNA methylation and gene expression levels. Each point represents one CpG site and the dashed line indicates the variation of correlation throughout HOXD9 gene. Orange lines specify the statistical significant threshold for the correlation analysis (P = 0.05). (C) DNA methylation levels throughout HOXD9 gene in melanoma progression. The error bars represent the standard error mean (SEM). (D) Representation of PMDs for each specimen type. (E) Open chromatin analysis using ENCODE project data. Track visualized on USCS genome browser (www.genome.ucsc.edu). The darkness of color and the length of the bar are positively correlated with the accessibility of the chromatin fiber assessed by DHS analysis. Yellow vertical line represents the region with the highest signal.
Quantitative methylation-specific real-time PCR (qMSP) was used to analyze the DNA methylation level of six CpG sites located in HOXD9 promoter region (−1151, −753, −456, −251, −187 and −29 bp relative to the TSS) in 14 metastatic melanoma-derived cell lines. Based on the level of DNA methylation of these six CpG sites, hierarchical cluster analysis separated the melanoma cell lines into three clusters (Supplemental Material, Fig. S10A). Cluster 1 included cell lines with higher DNA methylation level (mean = 76%) than cluster 2 (mean = 53.8%) and cluster 3 (mean = 34%). Analysis of HOXD9 mRNA expression level, by Real-Time PCR, showed large variation between the melanoma cell lines, with overall lower level in cell lines from cluster 1, than that in cell lines from clusters 2 and 3 (Supplemental Material, Fig. S10B). HOXD9 expression difference was also observed at protein level when comparing two cell lines from cluster 1 with two cell lines from cluster 3 (Supplemental Material, Fig. S10C). To further demonstrate DNA methylation regulation of HOXD9 gene, we reversed DNA methylation level by demethylating agent treatment. 5-aza-2-deoxycytidine (5-aza-2-dC) was used to treat three cell lines from cluster 1, two cell lines from cluster 2 and one cell line from cluster 3. A significant enhancement of HOXD9 mRNA expression after 5-aza-2-dC treatment was observed in cell lines from cluster 1, but not in cell lines from clusters 2 and 3 (Supplemental Material, Fig. S10D). qMSP analysis showed overall decrease in DNA methylation level of HOXD9 in all the cell lines after 5-aza-2-dC treatment. The mean variation in cluster 1 (19%) was higher than that in cluster 2 and 3 (6.6%) (Supplemental Material, Figure S10E). All together, these results suggest an important role of DNA methylation of HOXD9 promoter region in HOXD9 gene expression.
Clinical significance of HOXD9 DNA methylation in cutaneous melanoma patients
An independent cohort of 145 melanoma patients and 14 normal nevi were selected to evaluate the clinical value of HOXD9 DNA methylation. The melanoma specimen cohort included 47 LNM, 57 MBM, 24 MLuM (melanoma lung metastasis) and 17 MLvM (melanoma liver metastasis) specimens. Initially, the methylation level of the six promoter CpG sites was assessed by qMSP in 14 nevi, 14 LNM and 14 MBM specimens. The methylation level of the −753 bp CpG site presented the largest difference between the three groups (Supplemental Material, Fig. S11). Using this CpG site as a target, we analyzed the entire cohort and verified a higher HOXD9 DNA methylation level in MBM than that in nevi (Wilcoxon, P = 2.5 × 10⁻⁷), LNM (Wilcoxon, P = 8.5 × 10⁻⁵) and MLuM (Wilcoxon, P = 0.009). No significant differences between MBM and MLvM (Wilcoxon, P = 0.93; Fig. 6A) were found. MLvM specimens had significantly higher HOXD9 DNA methylation level than nevi (Wilcoxon, P = 2.8 × 10⁻⁶), LNM (Wilcoxon, P = 0.006) and MLuM (Wilcoxon, P = 0.028; Fig. 6A).
Figure 6.

DNA methylation level of HOXD9 promoter region is associated with clinical prognosis. (A) Scatter plot depicting DNA methylation level of HOXD9 in nevi, LNM, MLuM, MLvM and MBM. Wilcoxon test-based P-values are represented by lowercase letters: a = 2.5 × 10⁻⁷, b = 8.5 × 10⁻⁵, c = 0.009, d = 2.8 × 10⁻⁶, e = 0.006 and f = 0.028. (B) Scatter plot depicting DNA methylation level of HOXD9 in LNM from patients with good (DFS > 5 years) and poor (DFS < 2 years) prognosis. (C and D) Kaplan–Meier survival curves for DFS (C) and OS (D) Patients were divided into two groups according to the methylation level of HOXD9 in LNM. The cutoff for this division was established based on the statistical mean (58.4% ± 2.1) value of DNA methylation of HOXD9 in LNM specimens.
LNM specimens were classified into good (DFS > 5 years; n = 15) and poor (DFS < 2 years; n = 18) prognosis groups. In this pilot study, a significantly higher HOXD9 DNA methylation level was observed in LNM from patients with poor prognosis (Wilcoxon, P = 0.025; Fig. 6B). From this observation, melanoma patients were grouped based on the statistical mean value of HOXD9 DNA methylation in LNM (58.4% ± 2.1) into hypo- and hyper-methylated HOXD9, and DFS and OS intervals between these two groups were compared. Melanoma patients with hypermethylation of HOXD9 in LNM presented significantly shorter DFS (Log rank, P = 0.004; Fig. 6C) and OS (Log rank, P = 0.002; Fig. 6D) than patients with HOXD9 hypomethylated in LNM. With a median follow-up period of 52.7 months, multivariate Cox proportional hazards regression analysis showed that HOXD9 methylation (HR = 2.7; CI95% 1.1–6.5; P = 0.026) and number of positive lymph nodes (HR = 1.1; CI95% 1.02–1.15; P = 0.014) were independently associated with worse overall survival rate by 10 years.
DISCUSSION
During cutaneous melanoma progression, tumor cells acquire plasticity and canalization of different phenotypes (29–31). Epigenetic aberrations such as histone modifications, non-coding RNA expression and DNA methylation are essential for this process (31). Our study identifies large DNA methylation changes in cutaneous melanoma progression to MBM. Previous studies reported, in other cancers, a global demethylation and increased DNA methylation in gene promoter CpG islands (32,33). Our study demonstrated a similar change between PRM and MNC, which was even more significant in metastatic melanoma specimens, showing a progressive pattern according to the advance of melanoma to late stages. There was an increase in the number of PMSs according to melanoma progression. Previous studies using bisulfite-based whole-genome sequencing have revealed the existence of PMDs that have been found to be relevant in differentiation and cell reprograming (20,21,34). Our analysis of PMDs in melanoma progression indicates that MBM-specific PMDs are associated with genes involved in the regulation of brain development and neurological system processes, suggesting a role of PMDs in the brain metastasis process. The pre-design of the probe distribution in the HM450K platform represents a disadvantage in identifying PMDs and differentially methylated regions owing to the low density of probes in some genomic regions that have been demonstrated as highly variable in previous comparisons of paired normal and tumors (11). To compensate for this limitation, we applied a three-state HMM similar to the strategy previously reported by Schroeder et al. (21,35) reinitiating the model after 100 kb.
Most of the 217 DMSs presented a higher methylation level in MBM than that in LNM from patients with good prognostic. The majority of genes associated with these DMSs have not been previously described in the melanoma progression to MBM. Seventy-two of the 217 DMSs significantly correlated with the expression of 48 genes. While most of the 217 DMSs were located at CpG shores (47.9%), most of the 72 DMSs correlated with gene expression were located at CpG islands (45.8%). It is important to note that this data reflect the relationships between DNA methylation and gene transcription levels of only the DMSs and do not represent a generalized mechanism for gene regulation, which has been investigated using unbiased whole-genome DNA methylation analyses (20,36). We observed negative correlation between 61 DMSs and 38 transcripts and positive correlation between 11 DMS and 10 transcripts. Traditionally, DNA methylation has been described as a ‘silencing’ epigenetic mark for gene expression; however, recent technological advances in whole-genome sequencing-based and genome-wide array-based DNA methylation approaches have shown that the influence of DNA methylation in gene expression varies with genomic and epigenomic context, rendering the relationship under constant revision (37). It has been demonstrated that DNA methylation can lead to an increase in gene expression through the regulation of non-coding RNA expression (38,39).
Analysis of potentially affected functions revealed that MBM cells harbor alterations in mechanisms related to cellular growth, proliferation, cycle, survival, movement, morphology, assembly, DNA repair and DNA replication. These processes have been considered to be the hallmarks of cancer (40). The identification of genes that contribute to these alterations is an important step in improving the management of patients with MBM.
HOX genes, which were significantly differentially methylated in MBM, constitute a family of transcription factors with binding affinity to DNA domains frequently found in enhancers that either activate or repress the expression of multiple genes (41). Previous studies have identified associations between alterations in different HOX genes and solid tumors, including cutaneous melanoma (24,42–46). However, little is known about the role of these key developmental genes in MBM. We identified HOXD cluster genes differentially methylated and expressed in MBM. As recently demonstrated in the mouse genome, the surrounding genomic landscape of HOXD genes plays a key role in expression regulation (47). We identified a 946-bp region surrounding the TSS of the HOXD9 gene where the methylation level correlated with the expression of HOXD9 mRNA and HOXD9 protein and was higher in MBM than in earlier stages of the disease. Data generated by the ENCODE and the NIH Roadmap Epigenomics projects allowed for the identification of a DHS and histone modification signature of the 946-bp region surrounding HOXD9 gene TSS. This data integration showed that this genomic region is more accessible in MNC cell lines than in metastatic melanoma cell lines and active transcription correlated with accessible chromatin, H3K4me1 and H3K4me3 histone modifications and low DNA methylation level of this region. Supporting this in silico analysis, our in vitro demethylation assay showed HOXD9 expression induction in cell lines presenting high DNA methylation level in the promoter region. However, as observed in our results, DNA methylation cannot be considered the only factor affecting HOXD9 gene expression. SR-07880-ME cell line presented a negligible mRNA expression level even with low HOXD9 promoter region DNA methylation level. JH-1173-ME cell line did not show significant HOXD9 induction after 5-aza-2dC treatment. Transcription repression by Polycomb-repressive complexes represents one of the DNA methylation alternative mechanism that have been involved in the regulation of HOX genes (48,49).
The HOXD9 gene methylation level was significantly higher in MBM and MLvM than that in MLuM and LNM. Based on a detailed clinical follow-up, our laboratory has reported that MBM and MLvM are more aggressive distant organ metastases than MLuM (50). Linked to this observation, we found that melanoma patients with poor prognosis presented higher HOXD9 methylation level in LNM than those with good prognosis and survival analyses ratified a shorter DFS and OS for those patients with HOXD9 hypermethylation in LNM. Multivariate analyses revealed that patients with HOXD9 hypermethylation in LNM have a 2.7-fold higher risk of death than those with HOXD9 hypomethylated in LNM. These findings identified in a pilot cohort suggest that methylation status of HOXD9 could have impact in melanoma disease outcome. Further studies in larger patient cohorts will be needed to verify the findings.
In summary, our study indicates that the change in DNA methylation landscape in melanoma progression is focused on regions of low CpG density. MBM harbors specific DNA methylation changes that can be targeted for diagnostic and prognostic purposes. Moreover, our data can serve as a starting point for further characterization of these epigenomic alterations enabling the discovery of pharmaco-epigenomic targets to improve the management of MBM patients. This report represents a comprehensive DNA methylation analysis of MBM and opens up new avenues to investigate the effects of DNA methylation changes at an epigenome-wide level in melanoma progression to the brain.
MATERIALS AND METHODS
Melanoma patients, specimens and cell lines included in the study
Cutaneous melanoma patients (n = 182) and healthy individuals (n = 14) were included in the study under protocols approved by Saint John's Health Center/JWCI joint institutional review board and Western institutional review board and the Sydney Local Health District, RPAH Zone, Human Ethics Review Committee. Informed consent was obtained from all subjects, and the experiments performed according to the principles set out in the WMA Declaration of Helsinki and the NIH Belmont Report. Tissue specimens were coded according to HIPAA recommendations to ensure the confidentiality of the patients. Epigenome-wide DNA methylation analysis included a cohort of 40 specimens: 3 were obtained from secondary culture of MNC extracted from normal skin (Life Technologies, Carlsbad, CA, USA), 4 from PRM of patients with AJCC Stage II, 17 from LNM of patients with AJCC Stage III and 16 from MBM of patients with AJCC Stage IV. HOXD9 DNA methylation analysis included an independent cohort of 159 specimens: 14 were obtained from nevi, 47 from LNM of patients with AJCC stage III, 17 from MLvM of patients with AJCC Stage IV, 24 from MLuM of patients with AJCC Stage IV and 57 from MBM of patients with AJCC stage IV. Fourteen melanoma cell lines were established from LNM (n = 9) and MBM (n = 5) and included in this study during early passages.
Genomic DNA isolation
DNA was extracted after microdissection from 10-μm-thick paraffin-embedded archival tissue (PEAT). Serial sections of PEAT were cut onto slides. Representative melanoma tissues were first identified under the microscope using hematoxylin and eosin stained serial sections. After deparaffinization, a hematoxylin staining was performed and melanoma tissues were either needle-dissected or laser-capture-microdissected (Veritas, Carlsbad, CA, USA), depending on the distribution, size and accessibility of the melanoma tissue as described previously (51). DNA was isolated using ZR FFPE DNA MiniPrep (Zymo Research, Irvine, CA, USA) according to the manufacturer's instruction. Genomic DNA from melanoma cell lines was extracted using DNAzol reagent (Life Technologies) following the manufacturer's protocol.
Epigenome-wide CpG methylation profiling
The epigenome-wide DNA methylation assays were performed using HM450K platform at the USC Epigenome Center following the manufacturer's protocol (Illumina, Inc., San Diego, CA, USA). Sodium bisulfite modification (SBM) was performed on 1 µg of DNA using Zymo EZ DNA methylation kit (Zymo Research). An aliquot of SBM-DNA was analyzed by MethyLight-based quality control to test bisulfite completeness (52). 200 ng of SBM-DNA was whole-genome amplified and enzymatically fragmented. Finally, the DNA was hybridized in HM450K BeadChip. The chips were scanned with Illumina iScan, and the data was extracted using the R package methylumi on Bioconductor. The methylation levels were reported as β-value [β = intensity of the methylated allele/(intensity of the unmethylated allele + intensity of the methylated allele)] and calculated using the signal intensity value for each CpG site. After background correction, probes with no significant difference from the background noise (P > 0.01) were called ‘failed’.
Genome-wide copy number profiling
Genotyping of DNA from melanoma specimens (n = 16) was performed using Affymetrix Genotyping Console 4.0 (Affymetrix, Santa Clara, CA, USA) at the USC/CHLA Genome Core Laboratory. Quality control (QC) of arrays was conducted using the Contrast Quality Control algorithm, with a minimal call rate of >95%. Copy number variation (CNV) analysis was performed using regional GC correction and default software settings. CNV segments were reported with an HMM algorithm using the default CNV map in Genotyping Console 4.0 (Toronto DGV map).
Genome-wide gene expression profiling
Total RNA was extracted from melanoma specimens by using the miRNeasy Mini kit (Qiagen GmbH, Hilden, Germany) including an on-column DNase digestion step following the protocol provided by the manufacturer. RNA concentration was quantified using Quant-iT™ RiboGreen® RNA assay kit (Life Technologies). The quality of the RNA was assessed by RNA Integrity Number (RIN) score on the Agilent 2100 Bioanalyzer. Twenty-two RNA samples, which passed the QC (RIN score ≥8), were analyzed by GeneChip Human Exon ST Array 1.0 (HuEx) following manufacturer's protocol (Affymetrix) at the USC/CHLA Genome Core laboratory. Data were analyzed in Expression Console 1.1 software (Affymetrix) using the core transcript set and employing the robust multi-array average algorithm (RMA) for background correction and normalization of data.
Quantitative real-time DNA methyl-specific PCR
SBM was performed on 1 µg of DNA using EpiTech® (Qiagen GmbH). HOXD9-methylated (M) and -unmethylated (U) alleles were amplified by using 12 primer sets to cover six different CpG sites in the promoter region of HOXD9 gene (−1151 to −29 bp; Supplementary Material, Table S10). The quantitative amplification of M and U alleles was performed in CFX96 Touch™ Real-Time PCR detection system (Bio-Rad Laboratories #185–5196), and the ΔCt (ΔCt = CtM −CtU) was calculated for each CpG site. The relative CN of M alleles was established by the 2−ΔCt method. The percentage of DNA methylation was estimated by using a standard curve of serial dilutions of the universal methylated control in universal unmethylated control as previously shown (53,54).
Quantitative real-time PCR
Total RNA was extracted from melanoma cell lines using TRI Reagent (Molecular Research Center, Cincinnati, OH, USA). Quality and quantity of extracted RNA were measured by UV absorption spectrophotometry and RiboGreen (Life Technologies). Retrotranscription reaction was performed using MMLV-RT enzyme (Promega, Madison, WI, USA) with oligo-dT primers. HOXD9 mRNA was amplified by using a previously published primer set (42). Beta-2-microglobulin (B2M) mRNA was targeted as an internal control of RNA quantity and quality using the primers: 5′ TGTCACAGCCCAAGATAG 3′ and 5′ CAAGCAAGCAGAATTT GGAA 3′. The quantitative amplification was performed in CFX96 Touch™ Real-Time PCR detection system (Bio-Rad Laboratories #185–5196) and the ΔCt (ΔCt = CtHOXD9 −CtB2M) was calculated for each cell line. The normalized expression of HOXD9 mRNA was established by the 2−ΔΔCt method using the corresponding external reference (JH-1173-ME cell line for the comparison between cell lines and non-treated respective cell line for 5-aza-2dC treatments).
Protein extraction and western blot analysis
Total protein extracts were obtained in lysis buffer (50 mM Tris–HCl, pH = 7.4, 10% (v/v) glycerol, 1% (v/v) Nonidet P40, 150 mM NaCl, 2 mM EDTA and 2 mM DTT) with protease inhibitor (Roche, San Francisco, CA, USA) and phosphatase inhibitor cocktail I, II (Sigma–Aldrich, St. Louis, MO, USA) from cell lines M16-ME and M12-ME, WP-0614-ME and EB-1075-ME. Proteins were cleared by centrifugation (12 000 g for 10 min at 4°C), and the concentration was measured using the Coomassie Plus assay (Pierce, Rockford, IL, USA). Samples were separated on SDS/PAGE (Life Technologies) and electrotransferred onto nitrocellulose membranes (Millipore, Billerica, MA, USA). The membranes were immunoblotted with primary antibodies against HOXD9 (1 : 1000; Sigma–Aldrich Cat# SAB4200029-25UL) and β-actin (1 : 10 000; Sigma–Aldrich Cat# A1978-200UL) overnight at 4°C, followed by peroxidase-conjugated secondary antibody against rabbit IgG (1:4000; GE healthcare, Pittsburgh, PA, USA) and against mouse IgG (1:6000 GE healthcare). Detection was carried out using the Pierce SuperSignal West Pico chemiluminescent substrate followed by scanning using a Fluorchem 5500 chemiluminescence imager (Alpha Innotech Corp., San Leandro, CA, USA).
Demethylating agent treatment
Six melanoma-derived cell lines were treated with 2.5, 5 and 10 μmol/l of 5-aza-2-deoxycytidine (Sigma–Aldrich) for 72 h in refreshing medium every 24 h as previously described (55). As a non-treated control, 0.1% DMSO was used.
Statistical analysis
Data analyses and results visualization including heat map, terrain map and distance matrix were performed using MultiExperiment Viewer (MeV) v4.7.1 (56). To identify repeated sequences into the probe recognition sites, we used RepeatMasker v3.3.0 software (hg19-Feb 2009, Repeat Library 20120124; http://www.repeatmasker.org/species/homSap.html) and Tandem Repeat Finder database (57). Chi-square was applied to compare DNA methylation levels of different groups. Copy number variation, gene expression and DMSs level between LNM and MBM were analyzed using the non-parametric Wilcoxon rank-sum test. Multiple-comparisons correction was performed using Benjamini and Hochberg FDR correction (FDR-corrected P-value). We selected loci with an FDR-corrected P-value lower than 0.005 and β-value difference larger than 0.3. We tested the data using a less strict FDR-corrected P-value (0.05), but the CpG regions that passed this filter could not separate MBM and LNM into two independent clusters. Unsupervised hierarchical cluster analyses were performed using the average linkage method and Euclidean metric distance. To assess the stability of the phenetic tree topologies, Bootstrap support value using 1000 iterations in MeV v4.7.1 was calculated. The correlation between DNA methylation and gene expression levels was performed using linear regression and calculating the Pearson's r correlation coefficient. The mean of HOXD9 DNA methylation level in nevi, Stage III and Stage IV disease was compared using the Wilcoxon's test and Kaplan–Meier curve with Log-rank significance test and Cox proportional hazard models were used to assess survival and estimate hazard ratios adjusted for potential confounders [including gender, age at PRM resection, tumor size (T), number of positive LN, tumor burden in LN (macro or micrometastasis) and HOXD9 methylation (low or high)].
Inferring PMD from HM450K data
A first-order three-state Gaussian HMM was used to smooth noisy β-values in order to infer locations of PMD using scikit-learn: machine learning in Phyton (58). The first hidden state, which corresponded with LMD, emitted a β-value normally distributed around 0.1; the second hidden state, which corresponded with PMD, emitted a β-value normally distributed around 0.45; the third hidden state, which corresponded with HMD, emitted a β-value normally distributed around 0.9. The model was initialized such that all three states had an equally likely start probability. A transition probability of 10−3 was chosen, and the Viterbi algorithm was used to generate the most likely segmentation of the data. Given that the median size of methylated domains is 28 kb, the upper quartile is 87 kb (59) and that the coverage of the HM450 K array is highly concentrated around gene, probes linearly adjacent on the chromosome, but >100 kb apart, were separated into distinct emission sequences. These values were chosen arbitrarily to override the biased and low coverage design of HM450 K and reflect methods used by Schroeder et al. (21,35). Genes were assigned to a specimen type-specific PMD when the variance across the individual specimens of each group was <0.3.
Gene network analysis and functional classification
The list of genes associated with the DMS was analyzed for gene ontology enrichments using the web-based DAVID functional annotation tool (60) and the affected gene networks, molecular and cellular function, disease disorder and physiological system using Ingenuity pathway analysis (Ingenuity Systems, Redwood City, CA, USA; www.ingenuity.com).
Data access
DNA methylation, gene expression and copy number data for the study have been submitted to Gene Ontology Omnibus (GEO) under the accession numbers GSE44661, GSE44660 and GSE44019, respectively.
SUPPLEMENTARY MATERIAL
Supplementary Material is available at HMG online.
Conflict of Interest statement. None declared.
FUNDING
This work was supported by National Institute of Health; National Cancer Institute (grant number PO1 CA029605 Project II and Core C to D.H. and D.L.M.; grant number 1R01CA167967-01A1 to D.H.); the Dr Miriam and Sheldon G. Adelson Medical Research Foundation (D.H. and D.L.M.); Ruth and Martin H. Weil Foundation (D.H.).
Supplementary Material
ACKNOWLEDGEMENTS
We are grateful to Dr Daniel Weisenberger and the USC Epigenome Center for their assistance with analysis of DNA methylation data. We are also grateful to Dr Laurent Lessard for his advice and critical revisions of the manuscript. We are grateful to the Melanoma Institute Australia. We acknowledge ENCODE project and the Institute for Genome Science and Policy, Duke University for generating the DNaseI HS Peaks data sets for melanoma-related cell lines.
REFERENCES
- 1.Siegel R., Naishadham D., Jemal A. Cancer statistics, 2013. CA Cancer J. Clin. 2013;63:11–30. doi: 10.3322/caac.21166. [DOI] [PubMed] [Google Scholar]
- 2.Miller A.J., Mihm M.C., Jr Melanoma. N. Engl. J. Med. 2006;355:51–65. doi: 10.1056/NEJMra052166. [DOI] [PubMed] [Google Scholar]
- 3.Denkins Y., Reiland J., Roy M., Sinnappah-Kang N.D., Galjour J., Murry B.P., Blust J., Aucoin R., Marchetti D. Brain metastases in melanoma: roles of neurotrophins. Neuro. Oncol. 2004;6:154–165. doi: 10.1215/S115285170300067X. [DOI] [PMC free article] [PubMed] [Google Scholar]
- 4.Lonser R.R., Song D.K., Klapper J., Hagan M., Auh S., Kerr P.B., Citrin D.E., Heiss J.D., Camphausen K., Rosenberg S.A. Surgical management of melanoma brain metastases in patients treated with immunotherapy. J. Neurosurg. 2011;115:30–36. doi: 10.3171/2011.3.JNS091107. [DOI] [PMC free article] [PubMed] [Google Scholar]
- 5.Valastyan S., Weinberg R.A. Tumor metastasis: molecular insights and evolving paradigms. Cell. 2011;147:275–292. doi: 10.1016/j.cell.2011.09.024. [DOI] [PMC free article] [PubMed] [Google Scholar]
- 6.Sandoval J., Heyn H., Moran S., Serra-Musach J., Pujana M.A., Bibikova M., Esteller M. Validation of a DNA methylation microarray for 450 000 CpG sites in the human genome. Epigenetics. 2011;6:692–702. doi: 10.4161/epi.6.6.16196. [DOI] [PubMed] [Google Scholar]
- 7.Jones P.A., Baylin S.B. The epigenomics of cancer. Cell. 2007;128:683–692. doi: 10.1016/j.cell.2007.01.029. [DOI] [PMC free article] [PubMed] [Google Scholar]
- 8.Esteller M. Epigenetics in cancer. N. Engl. J. Med. 2008;358:1148–1159. doi: 10.1056/NEJMra072067. [DOI] [PubMed] [Google Scholar]
- 9.Jones P.A. Functions of DNA methylation: islands, start sites, gene bodies and beyond. Nat. Rev. Gene.t. 2012;13:484–492. doi: 10.1038/nrg3230. [DOI] [PubMed] [Google Scholar]
- 10.Varley K.E., Gertz J., Bowling K.M., Parker S.L., Reddy T.E., Pauli-Behn F., Cross M.K., Williams B.A., Stamatoyannopoulos J.A., Crawford G.E., et al. Dynamic DNA methylation across diverse human cell lines and tissues. Genome Res. 2013;23:555–567. doi: 10.1101/gr.147942.112. [DOI] [PMC free article] [PubMed] [Google Scholar]
- 11.Irizarry R.A., Ladd-Acosta C., Wen B., Wu Z., Montano C., Onyango P., Cui H., Gabo K., Rongione M., Webster M., et al. The human colon cancer methylome shows similar hypo- and hypermethylation at conserved tissue-specific CpG island shores. Nat. Genet. 2009;41:178–186. doi: 10.1038/ng.298. [DOI] [PMC free article] [PubMed] [Google Scholar]
- 12.Bibikova M., Barnes B., Tsan C., Ho V., Klotzle B., Le J.M., Delano D., Zhang L., Schroth G.P., Gunderson K.L., et al. High density DNA methylation array with single CpG site resolution. Genomics. 2011;98:288–295. doi: 10.1016/j.ygeno.2011.07.007. [DOI] [PubMed] [Google Scholar]
- 13.Mori T., Martinez S.R., O'Day S.J., Morton D.L., Umetani N., Kitago M., Tanemura A., Nguyen S.L., Tran A.N., Wang H.J., et al. Estrogen receptor-alpha methylation predicts melanoma progression. Cancer Res. 2006;66:6692–6698. doi: 10.1158/0008-5472.CAN-06-0801. [DOI] [PMC free article] [PubMed] [Google Scholar]
- 14.Tanemura A., Terando A.M., Sim M.S., van Hoesel A.Q., de Maat M.F., Morton D.L., Hoon D.S. CpG island methylator phenotype predicts progression of malignant melanoma. Clin. Cancer Res. 2009;15:1801–1807. doi: 10.1158/1078-0432.CCR-08-1361. [DOI] [PMC free article] [PubMed] [Google Scholar]
- 15.Hoon D.S., Ferris R., Tanaka R., Chong K.K., Alix-Panabieres C., Pantel K. Molecular mechanisms of metastasis. J. Surg. Oncol. 2011;103:508–517. doi: 10.1002/jso.21690. [DOI] [PubMed] [Google Scholar]
- 16.Koyanagi K., Mori T., O'Day S.J., Martinez S.R., Wang H.J., Hoon D.S. Association of circulating tumor cells with serum tumor-related methylated DNA in peripheral blood of melanoma patients. Cancer Res. 2006;66:6111–6117. doi: 10.1158/0008-5472.CAN-05-4198. [DOI] [PMC free article] [PubMed] [Google Scholar]
- 17.Hoshimoto S., Kuo C.T., Chong K.K., Takeshima T.L., Takei Y., Li M.W., Huang S.K., Sim M.S., Morton D.L., Hoon D.S. AIM1 and LINE-1 epigenetic aberrations in tumor and serum relate to melanoma progression and disease outcome. J. Invest. Dermatol. 2012;132:1689–1697. doi: 10.1038/jid.2012.36. [DOI] [PMC free article] [PubMed] [Google Scholar]
- 18.Koga Y., Pelizzola M., Cheng E., Krauthammer M., Sznol M., Ariyan S., Narayan D., Molinaro A.M., Halaban R., Weissman S.M. Genome-wide screen of promoter methylation identifies novel markers in melanoma. Genome Res. 2009;19:1462–1470. doi: 10.1101/gr.091447.109. [DOI] [PMC free article] [PubMed] [Google Scholar]
- 19.Sigalotti L., Covre A., Fratta E., Parisi G., Sonego P., Colizzi F., Coral S., Massarut S., Kirkwood J.M., Maio M. Whole genome methylation profiles as independent markers of survival in stage iiic melanoma patients. J. Transl. Med. 2012;10:185. doi: 10.1186/1479-5876-10-185. [DOI] [PMC free article] [PubMed] [Google Scholar]
- 20.Lister R., Pelizzola M., Dowen R.H., Hawkins R.D., Hon G., Tonti-Filippini J., Nery J.R., Lee L., Ye Z., Ngo Q.M., et al. Human DNA methylomes at base resolution show widespread epigenomic differences. Nature. 2009;462:315–322. doi: 10.1038/nature08514. [DOI] [PMC free article] [PubMed] [Google Scholar]
- 21.Schroeder D.I., Lott P., Korf I., LaSalle J.M. Large-scale methylation domains mark a functional subset of neuronally expressed genes. Genome Res. 2011;21:1583–1591. doi: 10.1101/gr.119131.110. [DOI] [PMC free article] [PubMed] [Google Scholar]
- 22.Cao L., Li W., Kim S., Brodie S.G., Deng C.X. Senescence, aging, and malignant transformation mediated by p53 in mice lacking the Brca1 full-length isoform. Genes. Dev. 2003;17:201–213. doi: 10.1101/gad.1050003. [DOI] [PMC free article] [PubMed] [Google Scholar]
- 23.Baker D.J., Jeganathan K.B., Malureanu L., Perez-Terzic C., Terzic A., van Deursen J.M. Early aging-associated phenotypes in Bub3/Rae1 haploinsufficient mice. J. Cell Biol. 2006;172:529–540. doi: 10.1083/jcb.200507081. [DOI] [PMC free article] [PubMed] [Google Scholar]
- 24.Maeda K., Hamada J., Takahashi Y., Tada M., Yamamoto Y., Sugihara T., Moriuchi T. Altered expressions of HOX genes in human cutaneous malignant melanoma. Int. J. Cancer. 2005;114:436–441. doi: 10.1002/ijc.20706. [DOI] [PubMed] [Google Scholar]
- 25.Song L., Zhang Z., Grasfeder L.L., Boyle A.P., Giresi P.G., Lee B.K., Sheffield N.C., Graf S., Huss M., Keefe D., et al. Open chromatin defined by DNaseI and FAIRE identifies regulatory elements that shape cell-type identity. Genome Res. 2011;21:1757–1767. doi: 10.1101/gr.121541.111. [DOI] [PMC free article] [PubMed] [Google Scholar]
- 26.Pandiyan K., You J.S., Yang X., Dai C., Zhou X.J., Baylin S.B., Jones P.A., Liang G. Functional DNA demethylation is accompanied by chromatin accessibility. Nucleic Acids Res. 2013;41:3973–3985. doi: 10.1093/nar/gkt077. [DOI] [PMC free article] [PubMed] [Google Scholar]
- 27.The ENCODE Project Consortium. A user's guide to the encyclopedia of DNA elements (ENCODE) PLoS Biol. 2011;9:e1001046. doi: 10.1371/journal.pbio.1001046. [DOI] [PMC free article] [PubMed] [Google Scholar]
- 28.Bernstein B.E., Stamatoyannopoulos J.A., Costello J.F., Ren B., Milosavljevic A., Meissner A., Kellis M., Marra M.A., Beaudet A.L., Ecker J.R., et al. The NIH roadmap epigenomics mapping consortium. Nat. Biotechnol. 2010;28:1045–1048. doi: 10.1038/nbt1010-1045. [DOI] [PMC free article] [PubMed] [Google Scholar]
- 29.Mihic-Probst D., Ikenberg K., Tinguely M., Schraml P., Behnke S., Seifert B., Civenni G., Sommer L., Moch H., Dummer R. Tumor cell plasticity and angiogenesis in human melanomas. PLoS One. 2012;7:e33571. doi: 10.1371/journal.pone.0033571. [DOI] [PMC free article] [PubMed] [Google Scholar]
- 30.Pujadas E., Feinberg A.P. Regulated noise in the epigenetic landscape of development and disease. Cell. 2012;148:1123–1131. doi: 10.1016/j.cell.2012.02.045. [DOI] [PMC free article] [PubMed] [Google Scholar]
- 31.Wu C.Y., Tsai Y.P., Wu M.Z., Teng S.C., Wu K.J. Epigenetic reprogramming and post-transcriptional regulation during the epithelial–mesenchymal transition. Trends Genet. 2012;28:454–463. doi: 10.1016/j.tig.2012.05.005. [DOI] [PubMed] [Google Scholar]
- 32.Martinez R., Esteller M. The DNA methylome of glioblastoma multiforme. Neurobiol. Dis. 2010;39:40–46. doi: 10.1016/j.nbd.2009.12.030. [DOI] [PubMed] [Google Scholar]
- 33.Torano E.G., Petrus S., Fernandez A.F., Fraga M.F. Global DNA hypomethylation in cancer: review of validated methods and clinical significance. Clin. Chem. Lab. Med. 2012;50:1733–1742. doi: 10.1515/cclm-2011-0902. [DOI] [PubMed] [Google Scholar]
- 34.Hon G.C., Hawkins R.D., Caballero O.L., Lo C., Lister R., Pelizzola M., Valsesia A., Ye Z., Kuan S., Edsall L.E., et al. Global DNA hypomethylation coupled to repressive chromatin domain formation and gene silencing in breast cancer. Genome Res. 2012;22:246–258. doi: 10.1101/gr.125872.111. [DOI] [PMC free article] [PubMed] [Google Scholar]
- 35.Schroeder D.I., Blair J.D., Lott P., Yu H.O., Hong D., Crary F., Ashwood P., Walker C., Korf I., Robinson W.P., et al. The human placenta methylome. Proc. Natl. Acad. Sci. U S A. 2013;110:6037–6042. doi: 10.1073/pnas.1215145110. [DOI] [PMC free article] [PubMed] [Google Scholar]
- 36.Lister R., Ecker J.R. Finding the fifth base: genome-wide sequencing of cytosine methylation. Genome Res. 2009;19:959–966. doi: 10.1101/gr.083451.108. [DOI] [PMC free article] [PubMed] [Google Scholar]
- 37.Gutierrez-Arcelus M., Lappalainen T., Montgomery S.B., Buil A., Ongen H., Yurovsky A., Bryois J., Giger T., Romano L., Planchon A., et al. Passive and active DNA methylation and the interplay with genetic variation in gene regulation. Elife. 2013;2:e00523. doi: 10.7554/eLife.00523. [DOI] [PMC free article] [PubMed] [Google Scholar]
- 38.Deaton A.M., Webb S., Kerr A.R., Illingworth R.S., Guy J., Andrews R., Bird A. Cell type-specific DNA methylation at intragenic CpG islands in the immune system. Genome Res. 2011;21:1074–1086. doi: 10.1101/gr.118703.110. [DOI] [PMC free article] [PubMed] [Google Scholar]
- 39.Orom U.A., Derrien T., Beringer M., Gumireddy K., Gardini A., Bussotti G., Lai F., Zytnicki M., Notredame C., Huang Q., et al. Long noncoding RNAs with enhancer-like function in human cells. Cell. 2010;143:46–58. doi: 10.1016/j.cell.2010.09.001. [DOI] [PMC free article] [PubMed] [Google Scholar]
- 40.Hanahan D., Weinberg R.A. Hallmarks of cancer: the next generation. Cell. 2011;144:646–674. doi: 10.1016/j.cell.2011.02.013. [DOI] [PubMed] [Google Scholar]
- 41.Marty T., Vigano M.A., Ribeiro C., Nussbaumer U., Grieder N.C., Affolter M. A HOX complex, a repressor element and a 50 bp sequence confer regional specificity to a DPP-responsive enhancer. Development. 2001;128:2833–2845. doi: 10.1242/dev.128.14.2833. [DOI] [PubMed] [Google Scholar]
- 42.Tabuse M., Ohta S., Ohashi Y., Fukaya R., Misawa A., Yoshida K., Kawase T., Saya H., Thirant C., Chneiweiss H., et al. Functional analysis of HOXD9 in human gliomas and glioma cancer stem cells. Mol. Cancer. 2011;10:60. doi: 10.1186/1476-4598-10-60. [DOI] [PMC free article] [PubMed] [Google Scholar]
- 43.Gao L., Smit M.A., van den Oord J.J., Goeman J.J., Verdegaal E.M., van der Burg S.H., Stas M., Beck S., Gruis N.A., Tensen C.P., et al. Genome-wide promoter methylation analysis identifies epigenetic silencing of MAPK13 in primary cutaneous melanoma. Pigment Cell Melanoma Res. 2013;26:542–554. doi: 10.1111/pcmr.12096. [DOI] [PubMed] [Google Scholar]
- 44.Wardwell-Ozgo J., Dogruluk T., Gifford A., Zhang Y., Heffernan T.P., van Doorn R., Creighton C.J., Chin L., Scott K.L. HOXA1 drives melanoma tumor growth and metastasis and elicits an invasion gene expression signature that prognosticates clinical outcome. Oncogene. 2013 doi: 10.1038/onc.2013.30. doi:10.1038/onc.2013.30. [DOI] [PMC free article] [PubMed] [Google Scholar]
- 45.Cantile M., Scognamiglio G., Anniciello A., Farina M., Gentilcore G., Santonastaso C., Fulciniti F., Cillo C., Franco R., Ascierto P.A., et al. Increased HOX C13 expression in metastatic melanoma progression. J. Transl. Med. 2012;10:91. doi: 10.1186/1479-5876-10-91. [DOI] [PMC free article] [PubMed] [Google Scholar]
- 46.Braig S., Mueller D.W., Rothhammer T., Bosserhoff A.K. MicroRNA miR-196a is a central regulator of HOX-B7 and BMP4 expression in malignant melanoma. Cell Mol. Life Sci. 2010;67:3535–3548. doi: 10.1007/s00018-010-0394-7. [DOI] [PMC free article] [PubMed] [Google Scholar]
- 47.Tschopp P., Duboule D. A regulatory ‘landscape effect’ over the HoxD cluster. Dev. Biol. 2011;351:288–296. doi: 10.1016/j.ydbio.2010.12.034. [DOI] [PubMed] [Google Scholar]
- 48.Simon J.A. Chromatin compaction at Hox Loci: a Polycomb tale beyond histone tails. Mol. Cell. 2010;38:321–322. doi: 10.1016/j.molcel.2010.04.018. [DOI] [PubMed] [Google Scholar]
- 49.Isono K., Mizutani-Koseki Y., Komori T., Schmidt-Zachmann M.S., Koseki H. Mammalian polycomb-mediated repression of Hox genes requires the essential spliceosomal protein Sf3b1. Genes Dev. 2005;19:536–541. doi: 10.1101/gad.1284605. [DOI] [PMC free article] [PubMed] [Google Scholar]
- 50.Barth A., Wanek L.A., Morton D.L. Prognostic factors in 1,521 melanoma patients with distant metastases. J. Am. Coll. Surg. 1995;181:193–201. [PubMed] [Google Scholar]
- 51.van Hoesel A.Q., van de Velde C.J., Kuppen P.J., Liefers G.J., Putter H., Sato Y., Elashoff D.A., Turner R.R., Shamonki J.M., de Kruijf E.M., et al. Hypomethylation of LINE-1 in primary tumor has poor prognosis in young breast cancer patients: a retrospective cohort study. Breast Cancer Res. Treat. 2012;134:1103–1114. doi: 10.1007/s10549-012-2038-0. [DOI] [PubMed] [Google Scholar]
- 52.Hinoue T., Weisenberger D.J., Lange C.P., Shen H., Byun H.M., Van Den Berg D., Malik S., Pan F., Noushmehr H., van Dijk C.M., et al. Genome-scale analysis of aberrant DNA methylation in colorectal cancer. Genome Res. 2011;22:271–282. doi: 10.1101/gr.117523.110. [DOI] [PMC free article] [PubMed] [Google Scholar]
- 53.Sunami E., de Maat M., Vu A., Turner R.R., Hoon D.S. LINE-1 hypomethylation during primary colon cancer progression. PLoS One. 2011;6:e18884. doi: 10.1371/journal.pone.0018884. [DOI] [PMC free article] [PubMed] [Google Scholar]
- 54.Umetani N., de Maat M.F., Mori T., Takeuchi H., Hoon D.S. Synthesis of universal unmethylated control DNA by nested whole genome amplification with phi29 DNA polymerase. Biochem. Biophys. Res. Commun. 2005;329:219–223. doi: 10.1016/j.bbrc.2005.01.088. [DOI] [PubMed] [Google Scholar]
- 55.Shinojima T., Yu Q., Huang S.K., Li M., Mizuno R., Liu E.T., Hoon D.S., Lessard L. Heterogeneous epigenetic regulation of TIMP3 in prostate cancer. Epigenetics. 2012;7:1279–1289. doi: 10.4161/epi.22333. [DOI] [PMC free article] [PubMed] [Google Scholar]
- 56.Saeed A.I., Bhagabati N.K., Braisted J.C., Liang W., Sharov V., Howe E.A., Li J., Thiagarajan M., White J.A., Quackenbush J. TM4 microarray software suite. Methods Enzymol. 2006;411:134–193. doi: 10.1016/S0076-6879(06)11009-5. [DOI] [PubMed] [Google Scholar]
- 57.Benson G. Tandem repeats finder: a program to analyze DNA sequences. Nucleic Acids Res. 1999;27:573–580. doi: 10.1093/nar/27.2.573. [DOI] [PMC free article] [PubMed] [Google Scholar]
- 58.Pedregosa F., Varoquaux G., Gramfort A., Michel V., Thirion B., Grisel O., Blondel M., Prettenhofer P., Weiss R., Dubourg V., et al. Scikit-learn: Machine Learning in Python. J. Mach. Learn. Res. 2011;12:2825–2830. [Google Scholar]
- 59.Hansen K.D., Timp W., Bravo H.C., Sabunciyan S., Langmead B., McDonald O.G., Wen B., Wu H., Liu Y., Diep D., et al. Increased methylation variation in epigenetic domains across cancer types. Nat. Genet. 2012;43:768–775. doi: 10.1038/ng.865. [DOI] [PMC free article] [PubMed] [Google Scholar]
- 60.Huang D.W., Sherman B.T., Lempicki R.A. Systematic and integrative analysis of large gene lists using DAVID bioinformatics resources. Nat. Protocols. 2008;4:44–57. doi: 10.1038/nprot.2008.211. [DOI] [PubMed] [Google Scholar]
Associated Data
This section collects any data citations, data availability statements, or supplementary materials included in this article.