

Abstract
Objectives
This study examined how physicians perceive pharmaceutical companies’ medication assistance programs (MAPs).
Methods
The study was conducted using a survey of 373 primary care physicians from four southern states; they were surveyed within the formative evaluation phase of a larger study (MI-Plus). Respondents were queried about use and usefulness of MAPs for patients who cannot afford drugs, and barriers to using them. Bivariate associations between physician-level variables (patients without drug coverage) and usefulness and barriers to using MAPs were assessed using Chi square tests. Independence of associations was assessed using multiple logistic regressions.
Results
Of the 364 (97.6%) respondents who used MAPs, 70% used them regularly, the rest occasionally; 63% found MAPs very useful in caring for patients who cannot afford drugs. About 89% reported one or more barriers to using MAPs; 47% saw “inability of patients to apply directly;” and 57% saw “enrollment process being time-consuming for staff” as barriers. Compared to physicians with fewer elderly patients without drug coverage, those with more of these patients were less likely to find MAPs very useful; less likely to report no barriers to using MAPs; and more likely to see “low income thresholds” and “inability of patients to apply directly” as barriers.
Conclusion
While MAPs are considered useful in caring for patients in need of assistance, there are many barriers to their use. Pharmaceutical companies should address these barriers. Limitations include a low response rate (about 10%).
Keywords: drug affordability, indigent patients, pharmaceutical medication assistance programs, primary care physician
Introduction
In a New York Times interview, the president of product development for a pharmaceutical company defended the high price of their newest cancer drug while pointing out that the company had many programs to help patients afford their drugs.1 Pharmaceutical companies’ medication assistance programs (MAPs) are part of the industry’s philanthropic efforts and provide medications to eligible patients at no or reduced cost. In 1999, these programs offered 53% of the top 200 prescribed medications.2 In 2004, more than six million people received free or low cost prescription drugs through pharmaceutical companies.3
Use of MAPs have contributed positively to patients’ health outcomes.4, 5 In a sample of heart disease patients, assistance in obtaining prescription drugs free of charge using MAPs, drug samples and other state-funded prescription assistance programs, improved adherence to treatment, cardiovascular outcomes, and reduced hospitalizations.5 In addition, MAPs have been used successfully by a few medical centers to reduce their drug expenses.6–11 However, barriers such as lack of familiarity with these programs and the burden of the enrollment process for physicians’ offices may limit their use. 2, 8
To the best of our knowledge, there are no published reports of how physicians perceive the usefulness of MAPs for taking care of indigent patients and whether these are indeed more useful for physicians who have larger proportions of patients without drug coverage. Thus, we surveyed 364 primary care physicians about MAPs’ usefulness and the perceived barriers to using them, specifically when caring for patients who could not afford drugs. We added questions to a survey assessing the need for education about post myocardial (post-MI) infarction care that targeted physicians in four states of the Southern United States.
Methods
In 2003, we surveyed primary care physicians in Tennessee, Mississippi, Georgia, and Florida to determine current practice patterns in the outpatient management of post-MI patients and perceived barriers to optimal care. The survey’s primary purpose was to obtain data for a formative evaluation that would lead to the development of a performance improvement intervention. This was subsequently tested in a randomized trial targeting physicians in Alabama (the MI-Plus study). Therefore, recruitment for this survey was designed to ensure a minimum number of survey respondents, not a high response rate. The four states were chosen because they are contiguous to Alabama.
The survey instrument was developed in three parallel forms that included different case vignettes representing post-MI patients. The three forms were sent at random to a total of 11,788 primary care physicians who took care of adults; thus, about a third of this universe population received one of the three survey forms. Valid responses were obtained from a total of 1243 physicians: 469 were responses to the first survey form, 372 to the second, and 402 to the third form. In this study, we examined responses to the third survey form, ie, one that included questions about use of MAPs for patients who cannot afford drug prescriptions, and about barriers to using them (Table 1). Therefore, if 3930 responders (11,788/3) received this survey form, our response rate would be about 10% (402/3,930). Barriers to using MAPs included: 1) lack of familiarity with these programs; 2) MAP enrollment being time-consuming for office staff; 3) patients being unable to apply directly; 4) income thresholds for MAP eligibility being too low; and 5) MAP enrollment being too time consuming for patients.
Table 1.
Questions on use of Medication Assistance Programs (MAPs) included in a survey of primary care physicians in four southern US states
| When patients cannot afford drugs, does your office enroll patients in pharmaceutical companies’ indigent patient programs? | ||||||
| Yes □ | Sometimes □ | No □ | ||||
| How helpful are pharmaceutical companies’ indigent patient programs in obtaining drugs for patients who cannot afford them? | ||||||
| Not Helpful | 1 | 2 | 3 | 4 | 5 | Very Helpful |
| Who in your office initiates and/or oversees the processing of required drug assistance program enrollment materials? | ||||||
| □ Myself | □ Nurse | □ Social Worker | □ Support Staff Member | □ Other, Please Specify | ||
| What are the barriers to enrolling patients in pharmaceutical companies’ indigent patient programs? | ||||||
| □ There are no barriers | □ I am not familiar with indigent patient programs | |||||
| □ The income level threshold is set too low for my patients | □ It is too time-consuming for staff to attempt to enroll patients | |||||
| □ It is too time-consuming for patients to be enrolled | □ Patients cannot directly apply for indigent patient programs | |||||
| □ Other ___________________________________ | ||||||
Physician demographic items included gender, specialty, practice setting, and location. Practice characteristics included the number of patients seen per week, the proportion of patients older than 65 and that of patients without drug insurance coverage. We categorized physicians into those with less than 34%, 34 to 65%, and more than 65% patients without drug insurance coverage. We defined these categories for all patients and for patients older than 65. Our main objective was to determine whether physicians with more patients without drug coverage were more likely to find MAPs useful and to report fewer barriers to their use.
We examined bivariate associations between physician level variables and their views on usefulness and barriers to using MAPs. To assess the independence of associations between physician characteristics (proportion of patients without drug coverage) and their views, we conducted multiple logistic regressions where the dichotomized dependent variables were the responses on the usefulness and barriers of MAPs. In these regressions we controlled for other factors that may make use of MAPs more challenging, such as practice size or location in rural and urban settings. We also controlled for factors that may make use of MAPs more needed, such as an older patient population. Thus, we classified physicians into: 1) those with <100, 100 to 150, and more than 150 patients per week (median=100); 2) those who practiced in rural, urban, or suburban settings; and 3) those with 34%, 34 to 65%, and more than 65% of patients over age 65. We also included variables that indicated whether there were missing values for the included variables. This allowed us to use all the observations we had.
Results
Of 402 responses received, 29 were eliminated: 6 because the page with relevant questions was not returned and 23 because the respondents did not answer the questions about MAPs. Of the 373 remaining respondents, 9 (2.4%) indicated they did not use MAPs, and 364 reported that they used these programs either regularly or occasionally. We restricted the remaining analyses to the latter group of physicians.
The sample of respondents had similar characteristics to the population from which it was drawn, although we had a higher representation of family practice physicians. About 22% were female, 51.6% were in family medicine, 36.3% in internal medicine, and 6.9% were in general practice. According to the American Medical Association 2002 Physician Masterfile, primary care physicians in the four targeted states were 24% female, 52% were in internal medicine, 39% in family practice and 9% in general practice. In addition, 34% of our respondents practiced in a solo setting, 38% in a group setting, and 3% in “other” settings such as academic, health maintenance organization (HMO), or Veteran Administration (24% did not report the practice setting). Characteristics of the respondents’ patient population are reported in Table 2. More than 21% reported having over 65% of patients without drug coverage, and more than 36% reported having over 65% of their elderly patients without drug coverage (Table 1).
Table 2.
Patient population characteristics of 364 physicians who use Medication Assistance Programs (MAPs) regularly or occasionally. Community-based survey of physicians in Tennessee, Mississippi, Georgia and Florida, 2003
| All responents (N= 364) | MAPs Regular Users (N = 254) | MAPs occasional users (N = 110) | P values | |
|---|---|---|---|---|
| Proportion of Patients Without Drug Coverage | ||||
| All patients | 0.58 | |||
| - > 65% | 21.4 | 23.2 | 17.3 | |
| - 34–65% | 34.6 | 34.2 | 35.4 | |
| - <34% | 29.4 | 30.7 | 26.4 | |
| - Missing | 14.6 | 11.8 | 20.9 | |
| Patients older than 65 | 0.09 | |||
| - > 65% | 36.3 | 39.4 | 29.1 | |
| - 34–65% | 30.5 | 28.7 | 34.5 | |
| - <34% | 14.3 | 12.6 | 18.2 | |
| - Missing | 19.0 | 19.3 | 18.2 | |
|
| ||||
| Number of Patients Seen per Week | 0.44 | |||
| - < 100 | 22.5 | 20.9 | 26.4 | |
| - 100–150 | 50.3 | 51.6 | 47.3 | |
| - > 150 | 11.5 | 12.2 | 10.0 | |
| - Missing | 15.7 | 15.3 | 16.4 | |
|
| ||||
| Practice Location | 0.08 | |||
| - Urban | 18.1 | 16.5 | 21.8 | |
| - Suburban | 31.0 | 30.3 | 32.7 | |
| - Rural | 27.2 | 30.7 | 19.1 | |
| - Missing | 23.6 | 22.4 | 26.4 | |
|
| ||||
| Proportion of patients older than 65 | 0.11 | |||
| - > 65% | 22.2 | 24.8 | 16.4 | |
| - 34–65% | 48.1 | 48.0 | 48.2 | |
| - <34% | 26.1 | 23.6 | 31.8 | |
| - Missing | 3.6 | 3.5 | 3.6 | |
Numbers may not add up to 100% because of rounding
Statistical analysis conducted not including missing values
About 70% of respondents indicated that they used MAPs regularly, while the rest indicated they used them occasionally (Table 1). There were no significant differences in characteristics of the patient population between regular and occasional users (Table 1). Regular MAP users were more likely than occasional users to be female physicians (24.8% vs. 14.5%, P = 0.03) but did not significantly differ in specialty (P = 0.44). Moreover, there was a significant difference in the practice setting between the two groups: 34.6%, 39.8% and 1.6% of regular MAP users practiced in solo, group and “other” setting vs 34.5%, 34.5% and 6.4% of occasional users, respectively (P = 0.04). For both regular and occasional users, enrollment of patients in MAPs was initiated by a nurse for 48.1% of the respondents, by the physician him/herself for another 25.3%, and by other staff for 19.2% (7.4% of respondents did not answer this question).
Sixty three percent indicated that MAPs were very helpful in obtaining drugs for patients who cannot afford them, with regular users of MAPs being more likely than occasional users to think so (Table 3). It did not appear that having higher proportions of patients without drug coverage was associated with finding MAPs very helpful; in fact, overall, there was a trend in the direction of having more patients without drug coverage being associated with not finding MAPs very helpful (Table 3). Respondents with 34% or more of elderly individuals without drug coverage were significantly less likely to find MAPs useful than those with less than 34% of these patients (Table 3).
Table 3.
Percentage and Odds Ratios (95% Confidence Intervals) of finding Medication Assistance Programs (MAPs) very helpful, by physician patient population and practice characteristics
| N‡ | Respondents indicating MAPs are very helpful (%) | Odds Ratio† | |
|---|---|---|---|
|
| |||
| 364 | 63.2 | ||
| MAPs Users | |||
| Occasional | 110 | 40.0 | -- |
| Regular | 254 | 73.2 | 5.20 (3.07 – 8.80) |
|
| |||
| Proportion of patients without drug coverage | |||
| All patients | |||
| - < 34% | 107 | 69.2 | -- |
| - 34–65% | 126 | 68.2 | 1.25 (0.66 – 2.36) |
| - > 65% | 78 | 55.1 | 0.60 (0.30 – 1.22) |
| Patients older than 65 | |||
| - < 34% | 52 | 76.9 | -- |
| - 34–65% | 111 | 57.7 | 0.23 (0.10–0.56) |
| - > 65% | 132 | 65.1 | 0.35 (0.15–0.82) |
|
| |||
| Location | |||
| Urban | 66 | 62.1 | -- |
| Suburban | 113 | 66.4 | 1.06 (0.56 – 2.00) |
| Rural | 99 | 61.6 | 0.63 (0.33 – 1.22) |
|
| |||
| Patients per week | |||
| - < 100 | 82 | 62.2 | -- |
| - 100–150 | 183 | 66.1 | 0.99 (0.57 – 1.74) |
| - > 150 | 42 | 64.3 | 0.81 (0.35 – 1.88) |
| Proportion of older patients | |||
| - < 34% | 95 | 61.0 | -- |
| - 34–65% | 175 | 65.7 | 1.07 (0.61 – 1.89) |
| - > 65% | 81 | 59.3 | 0.53 (0.26 – 1.11) |
Number of respondents in subcategories do not add up to 364 because those with missing information are omitted
Odds ratios are adjusted for the variables listed here and for dummy variables indicating missing data using logistic regressions
Overall, only 11.3% of physicians reported no barriers to the use of MAPs (Fig.). The barriers most commonly indicated were 1) enrollment process being time-consuming for the office staff (54.7%); 2) inability of a patient to apply directly to MAPs (45.9%); and 3) low income thresholds (36.5%). Only about 6.0% of respondents indicated that they were not familiar with MAPs (Figure 1).
Figure 1.
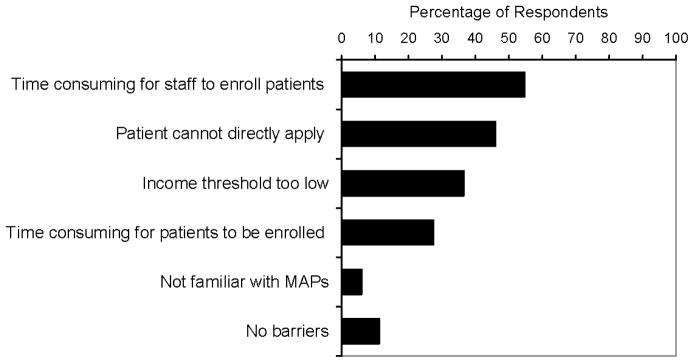
Percentage of physicians perceiving specific barriers to using Medication Assistance Programs (MAPs)
Regarding barriers to using MAPs, physicians with more patients without drug insurance coverage did not differ in their responses from physicians who had fewer patients without drug insurance (Table 4). Physicians with more elderly patients without drug insurance coverage were less likely to think that there were no barriers to using MAPs (P=0.004 for bivariate association) (Table 3). Compared to physicians who had < 34% of their elderly patient population without drug coverage, those who had 34 to 65% of these patients were more likely to indicate that patients not being able to apply directly was a barrier to using MAPs (Adjusted odds ratio [OR] 2.24, 95% confidence interval [CI] 1.08–4.67). Similarly, those who had 34 to 65% and more than 65% of elderly patients without drug coverage were more likely to indicate that income thresholds being too low was a barrier (adjusted OR 3.03, 95% CI 1.27–7.21, and 2.98, 95% CI 1.25–7.15, respectively).
Table 4.
Percentage of physicians perceiving specific barriers to using Medication Assistance programs (MAPs) by the reported proportion of patient population without drug coverage
| Perceived Barriers to using MAPs | ||||||
|---|---|---|---|---|---|---|
|
| ||||||
| Practice related barriers | Patient related barriers | |||||
|
|
|
|||||
| No barriers (%) | Lack of familiarity (%) | Enrollment time consuming for staff (%) | Patient cannot directly apply (%) | Income thresholds too low (%) | Enrollment time consuming for patients (%) | |
|
|
|
|||||
| Respondents by reported proportion of patients without drug coverage | ||||||
| All patients | ||||||
| <34% (N = 107) | 15.9 | 2.8 | 58.9 | 49.5 | 29.9 | 30.8 |
| 34–65% (N = 126) | 7.9 | 8.7 | 54.8 | 51.6 | 39.7 | 21.4 |
| > 65% (N = 78) | 9.0 | 7.7 | 50.0 | 38.5 | 39.7 | 28.2 |
| Missing (N=53) | 13.2 | 3.8 | 52.8 | 35.8 | 37.7 | 34.0 |
| Patients older than 65 | ||||||
| <34% (N = 52) | 25.0 | 9.6 | 51.9 | 34.6 | 17.3 | 28.8 |
| 34–65% (N = 111) | 9.9 | 10.8 | 54.9 | 56.8 | 40.5 | 19.8 |
| >65% (N = 132) | 7.7 | 2.3 | 59.1 | 46.2 | 37.1 | 35.6 |
| Missing (N = 69) | 10.1 | 2.9 | 47.8 | 36.2 | 43.5 | 23.2 |
Over 7% of respondents additionally commented that MAPs were problematic because each program requires different forms and procedures that make the paperwork more burdensome, because it is necessary to apply every three months to assure that the patient receives continuous treatment; and because it is necessary to fill out several applications for patients on multiple medications.
Discussion
Among 364 regular and occasional users of pharmaceutical medication assistance programs (MAPs), about two thirds reported that MAPs were very helpful in caring for patients who cannot afford drugs. Respondents reporting higher proportion of patients without drug insurance coverage tended to find these programs less helpful compared to physicians with fewer of these patients. This may be surprising considering that these programs’ objective is to help indigent patients. On the other hand, physicians who care for patients in need may be more familiar with the challenges of obtaining needed treatment; they may also be more aware of MAPs’ limitations in addressing them.
The response rate for this survey was quite small (about 10%) and this sample may not be representative of the universe population we targeted. However, we may have reached a selected group of physicians who were familiar with these programs and were motivated to answer our questions. Therefore, we believe that the responses we received, although from a small and selected sample of physicians, provide useful information to understand how these programs are used in practice and whether they actually help in the management of indigent patients.
Of all respondents, more than 95% indicated they used MAPs. This is surprisingly high. In a recent survey of Medicare patients, Tseng et al reported that about 30% had used free drug samples in the previous year, but only 1 to 2% had used pharmaceutical companies’ discounts.12, 13 The high use of MAPs in this survey may reflect not only the fact that we may have surveyed a selected group of physicians who were more likely to use MAPs than the general physician population, but also the fact that respondents were from some of the poorest US states where there may be more patients in need of drug assistance. In addition, we have queried physicians rather than patients and used a community-based physician survey.
Almost 90% of respondents reported at least one barrier to the use of MAPs. Lack of familiarity, as suggested in the literature, was not one of them.2 A substantial portion of the respondents indicated that the barriers to using MAPs were related to the enrollment process, which cannot be done directly by the patients and is time consuming for the office staff. Hotchkiss et al also found that there are “maintenance” barriers (recording patients’ supplies, reordering from manufacturer, and making sure that patients do not exhaust supplies before new ones come in), that are more challenging and time consuming than the barriers related to the enrollment process.8 This may explain why we found a significant association between having more patients in need and reporting that these assistance programs are less helpful as the higher proportion of needy patients would increase the burden on the staff. Further, physicians with more elderly patients without drug coverage, i.e., those patients who may have been more in need of MAPs, were also more likely to indicate the inability of patients to apply directly and the low income thresholds as barriers to the use of these programs.
Limitations
Our study has limitations. First, we have used simple methods to reach physicians (faxed survey) and obtained a low response rate. It is not uncommon to obtain such low response rates when unanticipated surveys are sent to places of business -- in this case medical practices.14 For example, in a two-wave mail survey of 6691 health care organization employees, Hikmet and Chen reported an overall response rate of 8.47%. Our low response rate suggests the possibility of response bias as discussed above. We regard this study as a preliminary and useful effort to assess what types of attitudes exist towards MAPs as tools to care for patients who cannot afford drugs. Estimating the true prevalence of the attitudes and barriers discussed here will require an additional study with greater resources available to encourage higher response rates. On the other hand, and unlike previous studies that have investigated the attitudes of physicians toward other pharmaceutical company services such as the provision of drug samples, our study is community-based and not restricted to academic medical centers, or a single health plan or a single payment modality.
Another limitation is that we defined patients in need of assistance as those without coverage for prescription drugs. This may not be accurate depending on the income of these patients. In addition, this information was reported by the physicians who may have inaccurately estimated the characteristics of their patient population. The results should also be interpreted considering that this survey was conducted in 2003, before the implementation of Medicare Part D, the insurance plan that covers brand-name and generic prescription drugs for individuals older than 65 enrolled in Medicare. Thus, physician may feel different about MAPs now that more elderly patients have drug coverage. However, it is estimated that 10% of elderly people remain without such coverage after Part D implementation.15 Moreover, more than 8% still reports some cost-related barrier to medication adherence, especially those with lower incomes; 5% report spending less on basic needs to pay for medications.15 The younger population is also at risk of non adherence due to the cost of drugs: a study that summarizes results from nine surveys found that non adherence due to cost was found in 2 to 22% of respondents, with higher rates in surveys that included younger populations.16 As many as 15.2% of working age adults, more than 5 million people, with chronic conditions did not fill prescription at least once during 2003.17
Conclusions
Pharmaceutical companies’ medication assistance programs were perceived to be very helpful in the care of patients who could not afford drugs by about two thirds of our primary care physician respondents. However, almost all physicians reported at least one barrier to MAP use. Several aspects of the enrollment process are perceived to be barriers to using MAPs, particularly for physicians with more patients in need of these programs. Pharmaceutical companies provide MAPs “as part of their commitment to improving access to medicines” for uninsured and low income individuals.3 However, it has also been suggested that MAPs serve as a marketing tool as they encourage use of new and expensive medicines while deflecting current concerns about affordability of prescription drugs.17 If philanthropy is the goal, pharmaceutical companies should address the barriers faced by physicians’ offices in using MAPs, for example revisiting the income thresholds that are considered by many to be too low, or simplifying the enrollment process that imposes a significant burden on physicians’ offices.
Acknowledgments
Supported in part by Grant number R01 HL70786 from the National Heart, Lung, and Blood Institute, Washington, DC.
The research involved in this article was part of a study that received approval from the University of Alabama at Birmingham’s Institutional Review Board for Human Use.
Footnotes
None of the authors have any commercial or proprietary interest in any drug, device, or equipment mentioned in this article. None of the authors have any financial interest in any item mentioned in this article.
References
- 1.Berenson A. New York Times, February 15. Feb 15, 2006. A Cancer Drug Shows Promise, at a Price That Many Can’t Pay. [PubMed] [Google Scholar]
- 2.Chisholm MA, DiPiro JT. Pharmaceutical manufacturer assistance programs. Arch Intern Med. 2002 Apr 8;162(7):780–784. doi: 10.1001/archinte.162.7.780. [DOI] [PubMed] [Google Scholar]
- 3.Hartsfield JAt. Pharmaceutical companies meet the needs of the poor and uninsured: an important element in the healthcare safety net. N C Med J. 2005 Mar-Apr;66(2):144–146. [PubMed] [Google Scholar]
- 4.Dent LA, Stratton TP, Cochran GA. Establishing an on-site pharmacy in a community health center to help indigent patients access medications and to improve care. J Am Pharm Assoc (Wash) 2002 May-Jun;42(3):497–507. doi: 10.1331/108658002763316932. [DOI] [PubMed] [Google Scholar]
- 5.Schoen MD, DiDomenico RJ, Connor SE, Dischler JE, Bauman JL. Impact of the cost of prescription drugs on clinical outcomes in indigent patients with heart disease. Pharmacotherapy. 2001 Dec;21(12):1455–1463. doi: 10.1592/phco.21.20.1455.34473. [DOI] [PubMed] [Google Scholar]
- 6.Decane BE, Chapman J. Program for procurement of drugs for indigent patients. American Journal of Hospital Pharmacy. 1994 Mar;51(5):669–671. 1991. [PubMed] [Google Scholar]
- 7.Harmon GN, Lefante J, Roy W, et al. Outpatient medication assistance program in a rural setting. Am J Health Syst Pharm. 2004 Mar 15;61(6):603–607. doi: 10.1093/ajhp/61.6.603. [DOI] [PubMed] [Google Scholar]
- 8.Hotchkiss BD, Pearson C, Lisitano R. Pharmacy coordination of an indigent care program in a psychiatric facility. American Journal of Health System Pharmacy. 1998;55(12):1293–1296. doi: 10.1093/ajhp/55.12.1293. [DOI] [PubMed] [Google Scholar]
- 9.Viale PH, Mister S. Utilization of medication-assistance programs for medically uninsured patients: one public teaching hospital’s experience. Clin J Oncol Nurs. 2001 Nov-Dec;5(6):247–252. [PubMed] [Google Scholar]
- 10.Mounts VL, Ringenberg DG, Rhees K, Partridge C. Implementation of a patient medication assistance program in a community pharmacy setting. J Am Pharm Assoc (Wash DC) 2005 Jan-Feb;45(1):76–81. doi: 10.1331/1544345052843039. [DOI] [PubMed] [Google Scholar]
- 11.Williams K. Accessing patient assistance programs to meet clients’ medication needs. J Am Acad Nurse Pract. 2000 Jun;12(6):233–235. doi: 10.1111/j.1745-7599.2000.tb00187.x. [DOI] [PubMed] [Google Scholar]
- 12.Tseng CW, Brook RH, Keeler E, Mangione CM. Impact of an annual dollar limit or “cap” on prescription drug benefits for Medicare patients. Jama. 2003 Jul 9;290(2):222–227. doi: 10.1001/jama.290.2.222. [DOI] [PubMed] [Google Scholar]
- 13.Tseng CW, Brook RH, Keeler E, Steers WN, Mangione CM. Cost-lowering strategies used by medicare beneficiaries who exceed drug benefit caps and have a gap in drug coverage. Jama. 2004 Aug 25;292(8):952–960. doi: 10.1001/jama.292.8.952. [DOI] [PubMed] [Google Scholar]
- 14.Hikmet N, Chen SK. An investigation into low mail survey response rates of information technology users in health care organizations. Int J Med Inform. 2003 Dec;72(1–3):29–34. doi: 10.1016/j.ijmedinf.2003.09.002. [DOI] [PubMed] [Google Scholar]
- 15.Madden JM, Graves AJ, Zhang F, et al. Cost-related medication nonadherence and spending on basic needs following implementation of Medicare Part D. Jama. 2008 Apr 23;299(16):1922–1928. doi: 10.1001/jama.299.16.1922. [DOI] [PMC free article] [PubMed] [Google Scholar]
- 16.Kirking DM, Lee JA, Ellis JJ, Briesacher B, McKercher PL. Patient-reported underuse of prescription medications: a comparison of nine surveys. Med Care Res Rev. 2006 Aug;63(4):427–446. doi: 10.1177/1077558706288845. [DOI] [PubMed] [Google Scholar]
- 17.Carroll NV. Pharmaceutical patient assistance programs: don’t look a gift horse in the mouth or there’s no such thing as a free lunch. J Manag Care Pharm. 2007 Sep;13(7):614–616. doi: 10.18553/jmcp.2007.13.7.614. [DOI] [PMC free article] [PubMed] [Google Scholar]