Summary
In this study a K+ current, IKx, in isolated salamander rod photoreceptors was characterized and its role in shaping small photovoltages was examined. IKx is a standing outward current of about 40 pA at –30 mV that deactivates slowly when the cell is hyperpolarized (τmax = 0.25 s). The voltage and time dependence of IKx are similar to that of M-current, but IKx can be distinguished from M-current because it is not suppressed by acetylcholine and is “blocked” by external Ba2+ in a surprising manner: the activation range of IKx is shifted strongly in the positive direction. Using current-clamp recordings and a computer simulation of the photoresponse, we show that IKx figures prominently in setting the dark resting potential and accelerates the voltage response to small photocurrents.
Introduction
The slow nature of rod phototransduction near visual threshold, evidenced by the full second it takes photocurrent to peak in response to a dim flash, is compensated at proximal stages in the retina to improve temporal fidelity (Baylor and Fettiplace, 1977; Attwell, 1986). The first compensatory step occurs in the photoreceptors themselves, in which the voltage response of individual rods is briefer than the photocurrent waveform at all light intensities (Baylor et al., 1984). This acceleration is due to voltage-dependent gating of ion channels in the rod inner segment (Fain and Lisman, 1981; Owen and Torre, 1981; Baylor et al., 1984; Owen, 1987).
Light absorption leads to the closure of cGMP-gated channels in the outer segment, reducing a steady flow of inward current and hyperpolarizing the rod from the dark resting potential, which is between –30 and –40 mV. Large hyperpolarizations elicited by bright light activate a Cs+-sensitive inward current (Fain et al., 1978). This inward current, now called Ih (Bader et al., 1982), produces, within a few hundred milliseconds, a reduction in the hyperpolarization, by up to 20 mV, that makes the photovoltage peak well in advance of the photocurrent (Bader et al., 1979; Baylor et al., 1984). However, a dim light response of only a few millivolts also peaks sooner than the corresponding photocurrent (Baylor et al., 1984). Since this voltage waveform is unchanged by Cs+ (Fain et al., 1978; Owen and Torre, 1983), there has been speculation that currents other than Ih shape small signals (Fain et al., 1978; Werblin, 1979; Attwell and Wilson, 1980; Fain and Lisman, 1981; Owen and Torre, 1981, 1983; Baylor et al., 1984). These may be K+ currents because the “negative conduction velocity” of small transient signals propagating in the rod network, which is mediated by voltage-gated ion channels (Detwiler et al., 1978; Attwell and Wilson, 1980), is inhibited by high external K+ concentrations (Owen and Torre, 1983).
Two studies have provided evidence for K+ currents activated in the voltage range over which rods normally respond to light. Attwell and Wilson (1980) have suggested that one of two current components contributing to the net current elicited by hyperpolarization was a deactivating outward current, Ix, which could be recorded in the presence of Cs+ and reversed in the region of the K+ equilibrium potential. Bader et al. (1982) have described a voltage-gated K+ current (IK) and a Ca2+-activated K+ current, but the role of these currents in the response to dim light has not been addressed. Using whole-cell, patch-clamp techniques applied to isolated rod photoreceptors for high-resolution recording, we characterize the activity of a population of K+ channels that gate in the voltage range from –30 to –70 mV. We provide evidence that the current, called IKx, has at least two essential roles in rod function: accelerating (i.e., high-pass filtering) the dim light response and setting the resting potential in the dark.
Results
Cs+- and Cd2+-Insensitive Current in the Voltage Range over which Rods Respond to Light
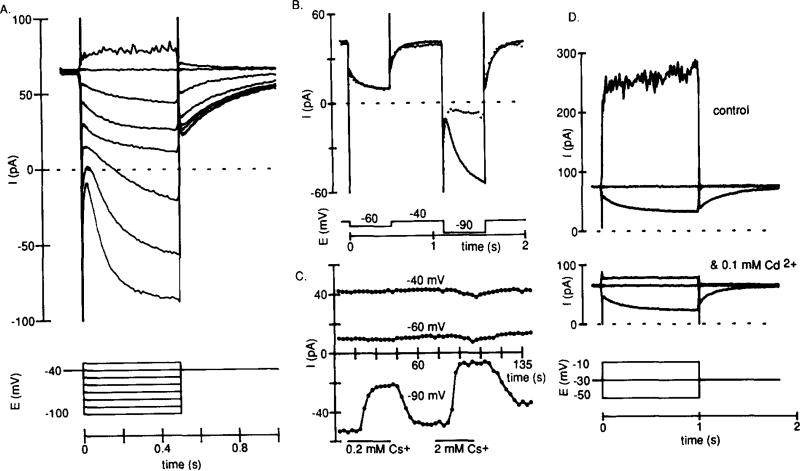
When a light-adapted rod was voltage-clamped to a potential approximating the dark resting potential (–40 mV) there was a large standing outward current (Figure 1A). Voltage steps applied from this potential elicited time-dependent current changes. Hyperpolarizing steps produced currents with downward trajectories (i.e., becoming less outward or more inward) that became larger as the membrane potential was made more negative. The single depolarizing step to –30 mV produced a noisy outward current. These current responses arose from the activity of several types of pharmacologically distinguishable ion channels. Bath-applied Cs+ (2 mM) blocked the time-dependent inward current (Ih) activated by hyperpolarization to –90 mV (Figures 1B and 1C). Bath-applied Cd2+ (0.1 mM) abolished the large, noisy outward current elicited by depolarization to –10 mV (Figure 1D). The latter component is probably Ca2+-activated K+ current, since 0.1 mM Cd2+ also abolished isolated Ca2+ or Ba2+ currents (data not shown). As in cones (Barnes and Hille, 1989), Cd2+ also abolishes Ca2+-activated Cl– current, a type of current found in rods (Bader et al., 1982) that was not evident in all of the cells from which we recorded. However, neither Cs+ nor Cd2+ affected the standing outward current at –40 mV, the time-dependent current at –60 mV, or the tail currents generated on return to the holding potential from –60 or –90 mV (Figures 1B and 1C). We called this Cs+- and Cd2+-insensitive current IKx and investigated its characteristics in isolation using cells bathed in Ringer solution containing both Cs+ and Cd2+.
Figure 1. Separation of IKx from Ih (Using Cs+) and from ICa and IK(Ca) (Using Cd2+) in a Rod.
(A) Voltage-clamped whole-cell current in a rod bathed in Ringer solution. Voltage command steps (500 ms; drawn below the current records) were applied every 3 s to a cell held at –40 mV.
(B) Superimposed current responses to a two-step hyperpolarizing protocol showed that 2 mM Cs+ blocked only the inward current elicited by steps to –90 mV. Voltage steps (500 ms) to –60 and –90 mV, separated by 500 ms, were applied every 3 s. The current record in the presence of Cs+ is plotted in dots. The two records shown are from the 2d and the 32d sweeps of the experiment in (C).
(C) Block of Ih by Cs+. Current measurements made at the holding potential of –40 mV and at the end of the steps to –60 and –90 mV from the same experiment as in (B). Application of 0.2 mM Cs+ reduced the inward current at –90 mV. The 0.2 mM Cs+ was washed out, and 2 mM Cs+ was applied, resulting in more block of inward current.
(D) Block of IK(Ca) by Cd2+ without affecting IKx. Voltage steps (1 s) were applied every 5 s to a rod held at –30 mV. Currents elicited by test steps to –10 and –50 mV are shown. Upper traces, before application of Cd2+; lower traces, after application.
IKx Is Time- and Voltage-Dependent and Is Carried Mostly by K+
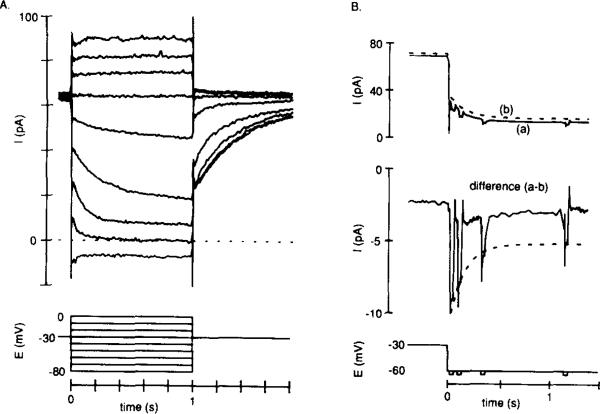
Figure 2A shows a standing outward current of about 60 pA at a holding potential of –30 mV in a cell bathed in 5 mM Cs+ and 0.1 mM Cd2+. Depolarizing voltage steps elicited no time- or voltage-dependent change in current, but hyperpolarizing steps caused a pronounced slow decay of current that reversed near –75 mV. When the cell was returned to –30 mV after a hyperpolarizing step, current increased slowly to the previous level. Tests with small superimposed voltage steps showed that the decay of current during a hyperpolarizing voltage step to –60 mV was due to a decrease in membrane conductance (Figure 2B). Using the same method, we found that the increasing outward current evident when stepping back to –30 mV was due to an increase in membrane conductance (data not shown).
Figure 2. IKx Is a Standing Outward Current That Turns Off with Hyperpolarization.
Recordings were made from cells bathed in Ringer solution containing 5 mM Cs+ and 0.1 mM Cd2+.
(A) Current elicited by 1 s voltage steps applied every 5 s from a holding potential of –30 mV.
(B) Averaged currents (n = 3) elicited by steps to –60 mV from a holding potential of –30 mV: (a) brief (20 ms) –4 mV steps were applied during the –60 mV step; (b) –4 mV steps were not applied. The difference current (a–b) shows that the –4 mV steps gradually resulted in less current as time progressed at –60 mV. The superimposed broken line has the same time constant as an exponential fitted to the decaying current in (b), showing a correlation between the rate of conductance decrease and current decay.
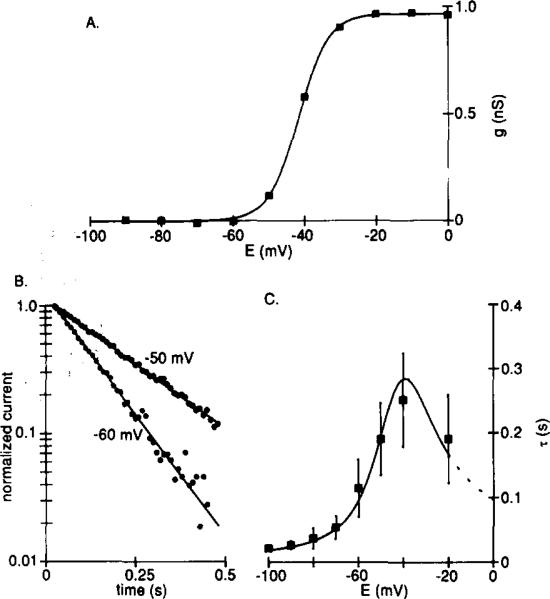
The voltage range over which IKx is activated was determined by measuring the peak amplitude of the tail current upon return to the holding potential of –30 mV after applying conditioning voltage steps to more positive or negative membrane potentials. We found that IKx was activated by voltage over the range –70 to –30 mV (Figure 3A). Half-maximal activation occurred at –46.4 ± 7.3 mV, and conductance increased e-fold every 4.6 ± 0.8 mV (means ± SD, n = 23). The deactivation kinetics of IKx were described well by single exponentials that had time constants of a few hundred milliseconds (Figure 3B). The time constants were voltage-dependent, having a maximum value of about 250 ms at –40 mV and decreasing to a minimum of about 25 ms at –90 mV (Figure 3C). We have not observed any inactivating component of IKx, and no inactivation was revealed upon depolarization to –30 mV after a 20 s conditioning step at –90 mV (data not shown). In addition, no appreciable delay to activation of IKx was observed when depolarizing from –90 mV (data not shown).
Figure 3. Time and Voltage Dependence of IKx.
Recordings were made from ceils bathed in Ringer solution containing 5 mM Cs+ and 0.1 mM Cd2+.
(A) Voltage dependence of activation for a typical experiment. Peak tail currents at –30 mV (the same protocol as shown in Figure 2A) were converted to conductance and plotted against conditioning potential. The reversal potential for IKx was taken as –74 mV (see Figure 4), zero conductance corresponds to the minimum value of gKx, and the smooth curve is the Boltzmann equation fitted using a least-squares method.
(B) Deactivation of IKx described by a single exponential. Hyperpolarizing voltage steps (1 s) were applied from a holding potential of –30 mV, and exponentials were fitted to the current decay using a nonlinear least-squares method. The currents (circles) and exponentials (continuous lines) are shown normalized and on a semilogarithmic scale for two test potentials.
(C) Time constants (τ) of exponentials fitted to the decay of IKx (means ± SD, n = 5–8) plotted against test potential. The smooth curve is 1/(α + β), in which α and β are rate constants for transitions between the closed and open states of the channels. Mean values for α and β (n = 6) were calculated from α = A∞/τ and β = (1 – A∞)/τ (Hodgkin and Huxley, 1952), in which A∞ is the normalized steady-state conductance, and τ is the time constant (s) of the fitted exponential. α and β were fitted by eye with the functions: α = 0.23(E + 45)/(1 – exp(– (E + 45)/7)); β = 1.2(E + 55)/(exp((E + 55)/5.5) – 1), in which E is the membrane potential (mV).
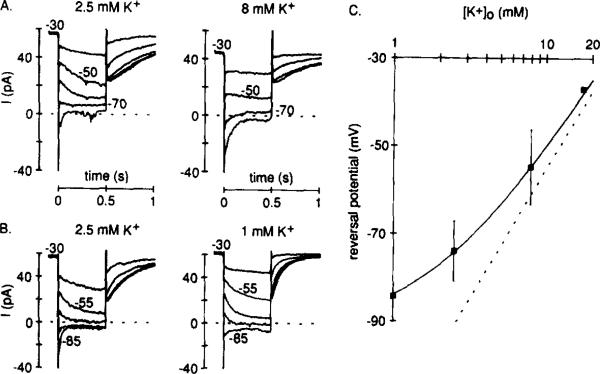
We measured the reversal potential of IKx by determining the membrane potential at which the current trajectory switched from being decaying outward to decaying inward current (Figures 4A and 4B). For example, in Figure 4A (2.5 mM K+), IKx reversed between –70 and –80 mV. This procedure was repeated in different external K+ concentrations (Figures 4A and 4B), and the results of these experiments are summarized in Figure 4C. IKx reversed close to the K+ equilibrium potential, indicating that the major charge carrier was K+. However, IKx reversed (near –85 mV) even when cells were superfused constantly with K+-free Ringer solution and a holding potential of –60 mV was used, conditions that minimized the extracellular K+ concentration. This suggests that the channels responsible for IKx are permeable to ions other than K+. We have fitted the reversal potential measurements with the Goldman-Hodgkin-Katz voltage equation on the assumption that the channels have a small Na+ permeability (Figure 4C, solid line). The value for PNa/PK (0.024) is close to that commonly estimated for other K+ channel types (for review see Hille, 1984), but we did not further assess the deviation from the behavior of a pure K+ electrode.
Figure 4. Reversal Potential for IKx.
Recordings were made from cells bathed in Ringer solution containing 5 mM Cs+ and 0.1 mM Cd2+.
Hyperpolarizing voltage steps (not shown) wereapplied from a holding potential of –30 mV. Current (shown) was measured at the beginning and the end of the hyperpolarizing steps: the difference (beginning minus end) was then plotted against test voltage, and the reversal potential was estimated (data not shown). Recordings were first made in 2.5 mM external K+ and then the external K+ concentration was (A) raised to 8 mM or (B) lowered to 1 mM. (C) Reversal potentials plotted against the logarithm of the external K+ concentration. The points are means (±SD) measured in 1 (n = 3), 2.5 (n = 8), 8 (n = 4), and 17.5 (n = 1) mM K+. The broken line shows the Nernst relation for a pure K+ electrode, and the continuous line is the Goldman-Hodgkin-Katz voltage equation fitted by eye (PNa/PK = 0.024).
Extracellular Ba2+ Shifts the Activation Range of IKx Strongly in the Positive Direction
The characteristics of IKx shown in Figures 1–3 resemble those of M-current, a class of K+ current found in a variety of cell types (Adams et al., 1982; Brown, 1988). In addition, we have found IKx to be blocked about 40% by bath-applied 10 mM tetraethylammonium (TEA) (n = 4), but less than 10% by 5 mM 4-aminopyridine (4-AP) at –60 mV (n = 4) (data not shown). This pharmacology compares well with that of M-current (Brown and Adams, 1980). To further this comparison, we examined the effect of external Ba2+ on IKx, since Ba2+ is known to block M-current in the millimolar concentration range (Adams et al., 1982).
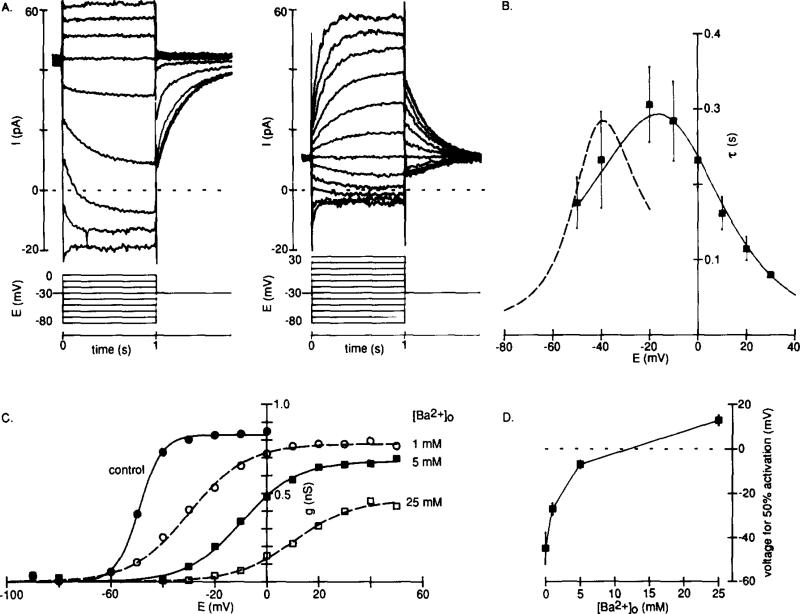
We found that IKx at –30 mV was reduced substantially by 5 mM external Ba2+ (Figure 5A). However, at positive potentials a time-dependent outward current appeared that was not present in the control. This “new” component seemed to represent IKx activating in a different potential range, about 40 mV more positive, since it still reversed near the K+ equilibrium potential and the kinetics of the current in the presence of Ba2+ were very similar to those observed prior to the application of Ba2+ (Figure 5B). This effect could be explained if Ba2+ modifies the voltage sensitivity of the channels underlying IKx, inducing a concentration-dependent positive shift in the activation curve and reducing its slope (Figures 5C and 5D). The same concentration of added Ca2+ caused little change in IKx (data not shown). Protons also shifted the activation curve of IKx; a 10-fold increase in concentration moved the midpoint by +5.9 ± 4.0 mV (mean ± SD, n = 4), and a 10-fold decrease moved it by about –10 mV (n = 2). However, the effect of protons differed from that of Ba2+, since the slope of the activation curve and the maximum amplitude of IKx were unaffected.
Figure 5. Modification of IKx by External Ba2+.
Recordings were made from cells bathed in Ringer solution containing 5 mM Cs+ and 0.1 mM Cd2+.
(A) Whole-cell current in response to voltage steps from –30 mV before (left) and after (right) 5 mM Ba2+ was added to the Cs+- and Cd2+-containing Ringer solution (note that more depolarizing steps are shown after Ba2+ application).
(B) Time-dependent current in 5 mM Ba2+ had kinetics similar to those of the control IKx. The points are mean time constants, τ (±SD, n = 3–6), of single exponentials fitted to the time-dependent current component elicited by test steps from –30 mV in 5 mM Ba2+. The continuous smooth curve describes 1/(α + β) (derived as in Figure 3C) and was estimated for data from six experiments in 5 mM BaCl2. The broken curve is the control repeated from Figure 3C.
(C) Activation curves, from tail currents measured at –30 mV, for IKx in 0 (closed circles), 1 (open circles), 5 (closed squares), and 25 (open squares) mM added Ba2+. The smooth curves are the Boltzmann equation fitted using a least-squares method. The midpoint of the activation curve in 5 mM Ba2+ was –6.9 ± 1.7 mV, with a slope factor of 11.2 ± 0.9 mV (means ± SD, n = 7).
(D) Concentration dependence of the Ba2+-induced shifts in the midpoint of the activation curve for IKx. The points are means (±SD) for cells in 0 (n = 7), 1 (n = 4), 5 (n = 7), or 25 (n = 3) mM added Ba2+.
This distinctive, reversible effect of Ba2+ on IKx revealed a clear difference between IKx and M-current. In four experiments on frog (Rana catesbeiana) sympathetic ganglion cells, 5 mM external Ba2+ produced only a minor shift (less than +10 mV) in the activation curve of M-current. In addition, M-current is suppressed by neurotransmitters such as acetylcholine or luteinizing hormone releasing hormone (LHRH; for review see Brown, 1988). However, we found IKx to be unaffected by bath-applied 1 mM acetylcholine (n = 7) or 1 mM LHRH (n = 2). IKx was also unaffected by GABA, dopamine, glycine, and glutamate (0.1–1 mM, n = 2–4).
Small Hyperpolarizations Are Accelerated by IKx but Not by Ih
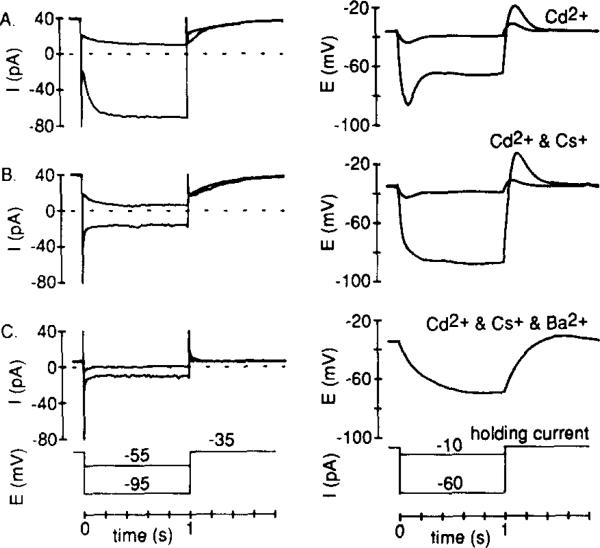
The voltage range for activation of IKx and its slow kinetics indicated that it could shape the rod voltage response to light. This hypothesis was first assessed by recording membrane potential changes during steps of constant current injection. When both Ih and IKx were present in a Cs+-free Cd2+-containing solution, the voltage response to both small (–10 pA) and large (–60 pA) hyperpolarizing current injections sagged back to a less negative potential within about 300 ms (Figure 6A). However, when Ih was blocked by Cs+ (Figure 6B), leaving IKx, the response to the small current injection still decreased with time, but the response to the large current injection became sustained. The role of IKx in shaping the small signal was then demonstrated by adding Ba2+ (Figure 6C) to inhibit IKx in this voltage range (Figure 5). This allowed the small injected current to induce a large and slow electrotonic potential. Thus, IKx attenuates and produces an early peak in the small-signal response, whereas Ih shapes larger signals that approach the reversal potential for IKx.
Figure 6. Effects of IKx and Ih on the Voltage Response to Current Injection.
Current components were identified in the voltage-clamp mode, and voltage responses to square pulses of injected current were assessed in the same cell. In each condition, cells were made to “rest” at about –38 mV by injection of a constant holding current (Axopatch 1-C).
(A) To reveal Ih, recordings were made in the absence of Cs+ but in the presence of Cd2+. With both Ih (dominant at –95 mV) and IKx (dominant at –55 mV) present, a time-dependent decrease in both small and large voltage signals occurred.
(B) Recordings in both (B) and (C) were made from cells bathed in Ringer solution containing 5 mM Cs+ and 0.1 mM Cd2+. Bath application of 5 mM Cs+ blocked Ih, but left IKx. The small voltage signal was similar to the control but the large signal became sustained.
(C) Bath-applied 5 mM Ba2+ inhibited IKx in this voltage range (see Figure 5). No time- or voltage-dependent currents (other than capacity currents) were evident, and the response to the small hyperpolarizing current injection was much larger and did not decrease with time (the larger hyperpolarizing current step was not applied).
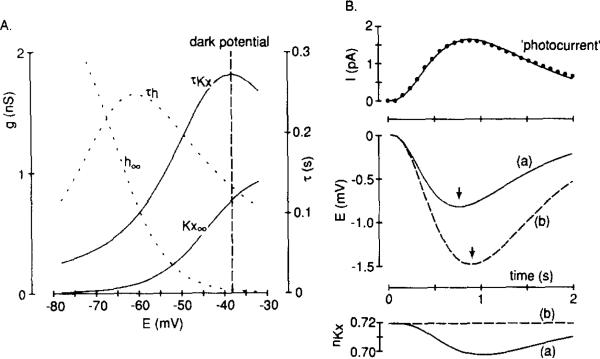
We next reconstructed membrane potential changes in a computer model with a simulation of IKx and photocurrent to ask whether the channels underlying IKx gate appropriately to shape small signals. Figure 7A shows the activation and τ curves and the reversal potentials from our experiments used to simulate IKx; those for Ih (from Hestrin, 1987) are included for comparison. Two voltage responses to a photocurrent induced by a dim flash of light were calculated; the conductance changed according to the model for IKx (Figure 7B, trace a), and the conductance was held constant at the resting value (Figure 7B, trace b). When IKx changed according to the model, the voltage response was accelerated; we found that a 2.2% deactivation of IKx (or a conductance decrease of 23 pS), lagging just behind the peak current response, shifted the peak of the voltage response by 140 ms. During this simulation, the maximum,change in the magnitude of IKx was 1.36 pA, and this offset the photocurrent change of 1.63 pA. Including Ih in the model had no effect on signals of this small amplitude (data not shown), presumably because the maximum conductance change underlying this current increased during the simulation by just 0.1 pS (or 0.004% of the maximum Ih conductance), and this, coupled with the less than 10 mV driving force, produced an Ih current change of only 0.6 fA.
Figure 7. Comparrson of the Voltage Ranges over Which IKx and Ih Gate and the Simulated Effect of IKx on the Photovoltage.
Recordings were made from cells bathed in Ringer solution containing 5 mM Cs+ and 0.1 mM Cd2+.
(A) Activation and τ curves for IKx and Ih as used in our computer reconstruction of the light response. The reversal potentials for IKx and Ih were –74 and –32 mV, respectively, and the rod's dark resting potential is marked by the vertical broken line. The data for salamander rod Ih come from Hestrin (1987).
(B, top) The photocurrent in response to a dim flash measured from published data for salamander rods (Baylor et al., 1984, their Figure 2A; response to 0.98 photons mm–2) with the points (closed circles) fitted by eye using the Independence equatron (I = (15.5(exp(–1.6t)))(1 – exp(–1.6t))3) from Baylor et al. (1974), in which I is the photocurrent (pA) and t is time (s). Zero on the vertical axis corresponds to an inward dark current of 40 pA. This current trajectory was applied to a computer model circuit with the following current components: gKxnKx(E – EKx) and gL(E – EL), in which E is membrane potential, EKx and EL are reversal potentials with values equal to –74 and –77 mV, respectively, gKx is the maximum conductance underlying IKx (1.04 ± 0.23 nS, mean ± SD, n = 12), and nKx is a value between 0 and 1 that represents the proportion of channels in the open state. A voltage-independent leak conductance, gL, of 0.35 nS and a membrane capacitance of 21 pF (Baylor et al., 1984) were assumed. (B, middle) Two calculated voltage responses to the photocurrent are shown: (a) the continuous line, when nKx was allowed to vary according to the differential equation: dnKx/dt = α(1 – nKx) – β(nKx) (α and β from Figure 3C); (b) the broken line, when the nKx term was held constant at the resting value of 0.719 (i.e., IKx with no voltage dependence). Zero on the vertical axis corresponds to a resting potential of –38.2 mV. The vertical arrows point to the peaks of the voltage responses. (B, bottom) Cating of the channels underlying IKx (described by nKx) during the photocurrent, correspondrng to the two voltage responses described above.
Discussion
Our results show the existence of a specialized population of voltage-gated K+ channels in rods that generate a standing outward current at –30 mV but close upon hyperpolarization in a simple voltage-dependent manner. On the basis of current-clamp recording and a computer model circuit, we propose two roles for this current in rods: to act as the major outward current component at the dark resting potential and to accelerate the voltage response to small current signals.
Properties of IKx
We compared IKx with known types of K+ current (Adams et al., 1982; Hille, 1984). IKx seems most similar to M-current because both currents are activated by depolarization over about the same voltage range, they do not inactivate, and they show simple, first-order kinetics. However, the kinetics of IKx are slightly slower than those of M-current, and the slope of the IKx activation curve is steeper. But, we have found differences of greater significance: IKx is not suppressed by acetylcholine or LHRH, as M-current is (Brown and Adams, 1980; Brown, 1988); and external Ba2+ shifts the voltage dependence of IKx gating strongly in the positive direction, but has much less effect on the voltage dependence of M-current gating.
The effect of external Ba2+ on IKx is interesting for two reasons: Ba2+ does not have a similar effect on the activation curve of either the M-current (this study) or the delayed rectifier (Armstrong and Taylor, 1980). In addition, Ba2+ is known to prolong the light response in rods (Brown and Flaming, 1978; Fain et al., 1980) and to delay dark adaptation (Walter et al., 1982). Ba2+ also may be concentrated normally in rods of some species (Bellhorn and Lewis, 1976). The effect of pH is also interesting because increases in extracellular pH duringthe light response (Ward and Ostroy, 1972) would shift the IKx activation curve in the negative direction.
Two classes of mechanism could account for the strong positive shift of the IKx activation and τ curves brought about by Ba2+. Ba2+ might interact with the channel voltage sensor or gate, or Ba2+ might block the channel in a voltage-dependent manner such that the block is alleviated slowly (i.e., τmax = 250 ms) at positive potentials, imitating gating. The similarity of the time dependence of the currents in the control and in the presence of Ba2+ (Figure 5B) suggests that voltage-dependent block is the less likely explanation. The strong shift is not explained by simple shielding of surface charges, since Ca2+ at the same concentration failed to produce the same effect as Ba2+. There are precedents for specific divalent cations shifting the activation range of voltage-dependent ion channels by amounts exceeding those predicted by simple shielding of surface charges (e.g., Byerly et al., 1984), but such an effect of Ba2+ on K+ channels is novel (for review see Yellen, 1987), and the mechanism for these interactions is unknown.
Roles for IKx in the Rod Response to Light
IKx is nearly fully activated at a holding potential of –30 mV and produces a standing outward current in illuminated rods of about 40 pA at this potential. Normally, in dark-adapted rods, a “dark current” of about 35 pA (Bader et al., 1979; Baylor et al., 1984) flows into the outer segment through the cGMP-gated channels, passes through the connectingcilium to the inner segment, and then leaves the rod at the inner segment. Our work identifies IKx as the major pathway by which the dark current leaves the rod, since it is the principal component of outward current at this potential, its magnitude is similar to that of the dark current, and its sign is opposite. As a consequence, IKx figures prominently in setting the rod resting potential, providing a hyperpolarizing influence that stabilizes the membrane. We know that Ba2+ or TEA induces oscillations of the membrane potential (Brown and Flaming, 1978; Fain et al., 1980; Owen and Torre, 1984), and our results suggest that this instability could be caused by Ba2+ or TEA blocking IKx at the dark resting potential. It is tempting to speculate that modulation of IKx would be an effective means by which to influence the resting potential and membrane stability of rods (and possibly cones), and hence affect their output to second-order cells. We have observed IKx to “run-down” after break-through to the whole-cell, suggesting that internal messengers may regulate the channels underlying IKx. However, so far our search for modulation of IKx by putative neurotransmitters has yielded negative results.
Both IKx and Ih shape the rod response, but they do so over separate voltage ranges, with IKx performing the role in the small response range. Activation curves for IKx and Ih (Figure 7A) show that small hyperpolarizing perturbations from the dark resting potential would turn off IKx a little and turn on Ih much less. The driving force for Ih would be small for small signals because of the proximity of its reversal potential (–32 mV). However, even a small reduction in the activation of IKx produces a large decrease in outward current, pushing the voltage response back to less negative potentials. With a larger hyperpolarizing current injection, membrane potential approaches or exceeds the reversal potential of IKx, which also turns off quickly in this voltage range (τ = 35 ms at –80 mV; Figure 3C); but Ih is activated significantly, and there is now a strong driving force for this current. Thus the bright-light voltage response sags because Ih is activated. This strong inward rectification produced by Ih could be a mechanism to restore the rod membrane potential to a level at which signal clipping by the rod output synapse is reduced (Leeper and Copenhagen, 1979; Attwell et al., 1987). It is unlikely that the role of IKx is to reduce signal clipping, since even a 1 mV hyperpolarization, which would not exceed the synapse output range, is shaped by IKx.
Our model did not account for all of the experimentally observed acceleration of the light response. The voltage response recorded by Baylor et al. (1984) actually peaked about 100 ms earlier than our reconstructed voltage response. What ion channels could also contribute to the acceleration? We rule out a contribution from Ih because it made no difference in our modeled response. Also, others have shown that small voltage responses are not changed by Cs+ (Owen and Torre, 1983), and in our current-clamp experiments addition of Cs+ to the bath produced little change in the response to a small current injection (Figures 6A and 6B). Other ionic currents, not present in our experiments, because Cd2+ was in the bath, could accelerate or slow the small-signal response. Owen and Torre (1983) considered the possibility that Ca2+-activated current was involved in the high-pass filtering of small signals, Voltage-gated Ca2+ current, which activates positive to –45 mV in rods (Bader et al., 1982; Corey et al., 1984), would slow membrane potential changes, not accelerate them; but the Ca2+ influx might activate K+ current (Bader et al., 1982), which would speed the response. Ca2+-activated Cl– current (Bader et al., 1982) may accelerate or slow the response depending on whether the Cl– equilibrium potential is more negative or positive, respectively, than the dark resting potential.
What is gained by accelerating responses to light? We might consider that, in rods, temporal resolution was compromised as a trade-off for quanta1 sensitivity. By producing a slow response to very dim lights, single absorption events may overlap in time and, since these occur in the linear range of the rod photocurrent response, produce a larger current with a higher probability of detection. An accelerated voltage response would increase temporal resolution and counteract this integrative feature of the visual response.
As signals spread through the rod network they become more transient, suggesting that response acceleration in individual rods is important in network function (Attwell and Wilson, 1980). Detwiler et al. (1978) found that the voltage response to a bar of light peaked earlier in rods farther away from the bar. They described the rod network as a conductor of electrical spread with a “negative conduction velocity,” attributing this to voltage-dependent gating of (unknown) ion channels that produced an effective space constant which becomes shorter with time after the onset of illumination. IKx gives indivldual rods high-pass filter characteristics that could account for this specialized cable property of the network.
Contrasts between IKx in rods and cones may support our view that IKx functions to counteract the slow nature of the rod response. Transduction mechanisms are faster in cones than in rods, and although cones have been shown to express most of the same channel types as rods, one corresponding to IKx has not been described (Attwell et al., 1982; Maricq and Korenbrot, 1988; Barnes and Hille, 1989). In preliminary experiments we identified a current similar to IKx in cones, but found it to be about 4 times smaller (12 ± 3 pA at –30 mV, n = 5) than that in rods. The diminutive nature of this current in cones is consistent with studies of cone function in isolated cells and in the network. In contrast to the case in rods, individual cones respond to light without a prominent acceleration (Baylor et al., 1974; Attwell et al., 1982), and signals spread with a positive conduction velocity in the cone network (Detwiler et al., 1978). Apparently the cone response is fast enough without a substantial accelerating influence from voltage-gated ion channels.
Experimental Procedures
Photoreceptor Isolation
Aquatic tiger salamanders (Kens Scientific Supply, Germantown, WI) were decapitated, the heads were hemisected, and the eyes were removed under normal room light. The retina was peeled away from the eyecup in Ringer solution (see below) and then triturated with a cut-off, fire-polished Pasteur pipette, without the use of enzymes. Isolated rods, often with axon terminals, were easily identified in the cell suspension.
Electrical Recording
Membrane current or voltage was measured from cells at room temperature (22°C–25°C) in constant bright light from the microscope illuminator (Nikon Diaphot) using the whole-cell configuration of the patch-clamp technique (Hamill et al., 1981). Patch pipettes were made from unheparinized hematocrit glass (VWR, Seattle, WA) on a vertical puller (David Kopf Instruments, Tujunga, CA) and had resistances of about 5 MΩ after coating with Sylgard 182 (Dow Corning, Midland, MI) and fire-polishing.
Cells were bathed in a modified Ringer solution (90 mM NaCl, 2.5 mM KCl, 3 mM CaCl2, 8 mM glucose, 10 mM HEPES, titrated to pH 7.4 with NaOH); changes in the KCl concentration (see Figure 4) were made by substituting an equivalent amount of NaCl, and for most experiments 0.1 mM CdCl2 and 5 mM CsCl were added as described in the text and figures. The bathing solution was changed completely in about 20 s (see Figure 1C for the time course of a solution change). The pipette solution contained 80 mM KCl, 20 mM NaCl, 3.5 mM MgCl2, 1 mM EGTA, 1.5 mM ATP (disodium salt), 0.1 mM GTP (sodium salt), and 10 mM HEPES, titrated to pH 7.4 with KOH. EGTA, 4-AP, ATP, GABA, acetylcholine chloride, l-glutamic acid, and dopamine were obtained from Sigma (St. Louis, MO). HEPES was from Calbiochem (San Diego, CA), glycine from Eastman (Rochester, NY), GTP from P-L Biochemicals (Milwaukee, WI), and teleost LHRH from Peninsula Laboratories (Belmont, CA).
Currents were amplified and filtered at 200 Hz and partially capacity- and series resistance-compensated using an Axopatch 1-C (Axon Instruments, Burlingame, CA). We did not correct a junction potential arising between the pipette and bath solutions, which we measured to be 2 mV (pipette negative) using a Beckman ceramic junction, saturated KCl reference electrode. Current or voltage was digitized, recorded, analyzed, and plotted with BASIC-FASTLAB (Indec Systems, Sunnyvale, CA).
Acknowledgments
We thank Professor B. Hille (in whose laboratorythe work was completed) for his advice and support, P. B. Detwiler, W. G. Owen, L. Bernheim, M. Bosma, M. Leibowitz, and J. Yang for comments on drafts of the manuscript. D. Anderson gave technical assistance. M. Bosma and L. Bernheim provided the isolated frog sympathetic ganglion cells. This work was supported by National Institutes of Health grant NS08174 and a McKnight Neuroscience Research Award to B. Hille.
References
- Adams PR, Brown DA, Constanti A. M-currents and other potassium currents in bullfrog sympathetic neurones. J. Physiol. 1982;330:537–572. doi: 10.1113/jphysiol.1982.sp014357. [DOI] [PMC free article] [PubMed] [Google Scholar]
- Armstrong CM, Taylor SR. Interaction of barium ions with potassium channels in squid giant axons. Biophys. J. 1980;30:473–488. doi: 10.1016/S0006-3495(80)85108-3. [DOI] [PMC free article] [PubMed] [Google Scholar]
- Attwell D. Ion channels and signal processing in the outer retina. Quart. J. Exp. Physiol. 1986;71:497–536. [PubMed] [Google Scholar]
- Attwell D, Wilson M. Behavior of the rod network in tiger salamander retina mediated by properties of individual rods. J. Physiol. 1980;309:287–315. doi: 10.1113/jphysiol.1980.sp013509. [DOI] [PMC free article] [PubMed] [Google Scholar]
- Attwell D, Werblin FS, Wilson M. The properties of single cones isolated from the tiger salamander retina. J. Physiol. 1982;328:259–283. doi: 10.1113/jphysiol.1982.sp014263. [DOI] [PMC free article] [PubMed] [Google Scholar]
- Attwell D, Borges S, Wu SM, Wilson M. Signal clipping by the rod output synapse. Nature. 1987;328:522–524. doi: 10.1038/328522a0. [DOI] [PubMed] [Google Scholar]
- Bader CR, MacLeish PR, Schwartz EA. A voltage-clamp study of the light response in solitary rods of the tiger salamander. J. Physiol. 1979;296:1–26. doi: 10.1113/jphysiol.1979.sp012988. [DOI] [PMC free article] [PubMed] [Google Scholar]
- Bader CR, Bertrand D, Schwartz EA. Voltage-activated and calcium-activated currents studied in solitary rod inner segments from the salamander retina. J. Physiol. 1982;331:253–284. doi: 10.1113/jphysiol.1982.sp014372. [DOI] [PMC free article] [PubMed] [Google Scholar]
- Barnes S, Hille B. Ionic channels of the inner segment of tiger salamander cone photoreceptors. J. Gen. Physiol. 1989 doi: 10.1085/jgp.94.4.719. in press. [DOI] [PMC free article] [PubMed] [Google Scholar]
- Baylor DA, Fettiplace R. Kinetics of synaptic transfer from receptors to ganglion cells in turtle retina. J. Physiol. 1977;271:425–448. doi: 10.1113/jphysiol.1977.sp012007. [DOI] [PMC free article] [PubMed] [Google Scholar]
- Baylor DA, Hodgkin AL, Lamb TD. The electrical response of turtle cones to flashes and steps of light. J. Physiol. 1974;242:685–727. doi: 10.1113/jphysiol.1974.sp010731. [DOI] [PMC free article] [PubMed] [Google Scholar]
- Baylor DA, Matthews G, Nunn BJ. Location and function of voltage-sensitive conductances in retinal rods of the salamander, Ambystoma tigrinum. J. Physiol. 1984;354:203–223. doi: 10.1113/jphysiol.1984.sp015372. [DOI] [PMC free article] [PubMed] [Google Scholar]
- Bellhorn MB, Lewis RK. Localization of ions in retina by secondary ion mass spectrometry. Exp. Eye Res. 1976;22:505–518. doi: 10.1016/0014-4835(76)90188-3. [DOI] [PubMed] [Google Scholar]
- Brown DA. M-currents: an update. Trends Neurosci. 1988;11:294–299. doi: 10.1016/0166-2236(88)90089-6. [DOI] [PubMed] [Google Scholar]
- Brown DA, Adams PR. Muscarinic suppression of a novel voltage-sensitive K+-current in a vertebrate neurone. Nature. 1980;283:673–676. doi: 10.1038/283673a0. [DOI] [PubMed] [Google Scholar]
- Brown KT, Flaming DG. Opposing effects of calcium and barium in vertebrate rod photoreceptors. Proc. Natl. Acad. Sci. USA. 1978;75:1587–1590. doi: 10.1073/pnas.75.3.1587. [DOI] [PMC free article] [PubMed] [Google Scholar]
- Byerly L, Meech R, Moody W. Rapidly activating hydrogen ion currents in perfused neurones of the snail, Lymnaea stagnalis. J. Physiol. 1984;351:199–216. doi: 10.1113/jphysiol.1984.sp015241. [DOI] [PMC free article] [PubMed] [Google Scholar]
- Corey DP, Dubinsky JM, Schwartz EA. The calcium current in inner segments of rods from the salamander (Ambystoma tigrinum) retina. J. Physiol. 1984;354:557–575. doi: 10.1113/jphysiol.1984.sp015393. [DOI] [PMC free article] [PubMed] [Google Scholar]
- Detwiler PB, Hodgkin AL, McNaughton PA. A surprising property of electrical spread in the network of rods in the turtlés retina. Nature. 1978;274:562–565. doi: 10.1038/274562a0. [DOI] [PubMed] [Google Scholar]
- Fain GL, Lisman JE. Membrane conductances of photoreceptors. Prog. Biophys. Mol. Biol. 1981;37:91–147. doi: 10.1016/0079-6107(82)90021-9. [DOI] [PubMed] [Google Scholar]
- Fain GL, Quandt FN, Bastian BL, Gerschenfeld HM. Contribution of a caesium sensitive conductance increase to the rod photoreceptors. Nature. 1978;272:467–469. doi: 10.1038/272467a0. [DOI] [PubMed] [Google Scholar]
- Fain GL, Gerschenfeld HM, Quandt FN. Calcium spikes in toad rods. J. Physiol. 1980;303:495–513. doi: 10.1113/jphysiol.1980.sp013300. [DOI] [PMC free article] [PubMed] [Google Scholar]
- Hamill OP, Marty A, Neher E, Sakmann B, Sigworth SJ. Improved patch-clamp techniques for high-resolution current recording from cells and cell-free membrane patches. Pflügers Arch. 1981;391:85–100. doi: 10.1007/BF00656997. [DOI] [PubMed] [Google Scholar]
- Hestrin S. The properties and function of inward rectification in rod photoreceptors of the tiger salamander. J. Physiol. 1987;390:319–333. doi: 10.1113/jphysiol.1987.sp016703. [DOI] [PMC free article] [PubMed] [Google Scholar]
- Hille B. Ionic Channels of Excitable Membranes. Sinauer Associates; Sunderland, MA: 1984. [Google Scholar]
- Hodgkin AL, Huxley AF. A quantitative description of membrane current and its application to conduction and excitation in nerve. J. Physiol. 1952;117:500–544. doi: 10.1113/jphysiol.1952.sp004764. [DOI] [PMC free article] [PubMed] [Google Scholar]
- Leeper HF, Copenhagen DR. Mixed rod-cone responses in horizontal cells of snapping turtle retina. Vis. Res. 1979;19:407–412. doi: 10.1016/0042-6989(79)90105-6. [DOI] [PubMed] [Google Scholar]
- Maricq AV, Korenbrot JI. Calcium and calcium-dependent chloride currents generate action potentials in solitary cone photoreceptors. Neuron. 1988;1:503–515. doi: 10.1016/0896-6273(88)90181-x. [DOI] [PubMed] [Google Scholar]
- Owen WG. Ionic conductances in rod photoreceptors. Annu. Rev. Physiol. 1987;49:743–763. doi: 10.1146/annurev.ph.49.030187.003523. [DOI] [PubMed] [Google Scholar]
- Owen WG, Torre V. Ionic studies of vertebrate rods. Curr. Top. Membr. Trans. 1981;15:33–57. [Google Scholar]
- Owen WG, Torre V. High-pass filtering of small signals by retinal rods. Biophys. J. 1983;41:325–339. doi: 10.1016/S0006-3495(83)84444-0. [DOI] [PMC free article] [PubMed] [Google Scholar]
- Owen WG, Torre V. Regenerative responses in toad rods. In: Borsellino A, Cervetto L, editors. Photoreceptors. Plenum Publishing Corp.; New York: 1984. pp. 201–220. [Google Scholar]
- Walter AE, Bolnick DA, Haynes LW, Sillman AJ. Rapid dark adaptation of bullfrog rods is delayed by barium. Invest. Ophthalmol. Vis. Sci. 1982;23:351–356. [PubMed] [Google Scholar]
- Ward JA, Ostroy SE. Hydrogen ion effects and the vertebrate late receptor potential. Biochim. Biophys. Acta. 1972;283:373–380. doi: 10.1016/0005-2728(72)90253-8. [DOI] [PubMed] [Google Scholar]
- Werblin FS. Time- and voltage-dependent ionic components of the rod response. J. Physiol. 1979;294:613–626. doi: 10.1113/jphysiol.1979.sp012949. [DOI] [PMC free article] [PubMed] [Google Scholar]
- Yellen G. Permeation in potassium channels: implications for channel structure. Annu. Rev. Biophys. Chem. 1987;16:227–246. doi: 10.1146/annurev.bb.16.060187.001303. [DOI] [PubMed] [Google Scholar]


