Abstract
Background
In patients with sinoatrial nodal (SAN) dysfunction, atrial pauses lasting several seconds may follow rapid atrial pacing or paroxysmal tachycardia (tachy-brady arrhythmias). Clinical studies suggest that adenosine may play an important role in SAN dysfunction, but the mechanism remains unclear.
Objective
To define the mechanism of SAN dysfunction induced by the combination of adenosine and tachycardia.
Methods
We studied the mechanism of SAN dysfunction produced by a combination of adenosine and rapid atrial pacing in isolated coronary-perfused canine atrial preparations using high-resolution optical mapping (n=9). Sinus cycle length (SCL) and sinoatrial conduction time (SACT) were measured during adenosine (1–100μM) and 1μM DPCPX (A1 receptor antagonist, n=7) perfusion. Sinoatrial node recovery time was measured after one minute of “slow” pacing (3.3Hz) or tachypacing (7–9Hz).
Results
Adenosine significantly increased SCL (477±62 vs. 778±114 ms, p<0.01), and SACT during sinus rhythm (41±11 vs. 86±16 ms, p<0.01) dose-dependently. Adenosine dramatically affected SACT of the first SAN beat after tachypacing (41±5 vs. 221±98ms, p<0.01). Moreover, at high concentrations of adenosine (10–100μM), termination of tachypacing or atrial flutter/fibrillation produced atrial pauses of 4.2±3.4 seconds (n=5) due to conduction block between the SAN and atria, despite a stable SAN intrinsic rate. Conduction block was preferentially related to depressed excitability in SAN conduction pathways. Adenosine-induced changes were reversible upon washout or DPCPX treatment.
Conclusions
These data directly demonstrate that adenosine contributes to post-tachycardia atrial pauses through SAN exit block rather than slowed pacemaker automaticity. Thus, these data suggest an important modulatory role of adenosine in tachy-brady syndrome.
Keywords: Sinoatrial node, optical mapping, adenosine, atrial flutter/fibrillation, tachy-brady syndrome
INTRODUCTION
Sino-atrial node (SAN), the primary pacemaker of the human heart, is a specialized and complex structure.1–3 Dysfunction of the SAN leads to more than 50% (>100,000) of the annual pacemaker implants in the US.4 One of the main manifestations of SAN dysfunction is tachy-brady syndrome, characterized as the heart rate alternating between too fast and too slow.5 In patients with SAN dysfunction, termination of rapid pacing or paroxysmal tachycardia may be followed by long atrial pauses lasting several seconds,6–8 which can provoke another tachyarrhythmia paroxysm. However, the cause of the post-tachycardia pause remains elusive.
One possible reason for the pause could be the effect of adenosine, an endogenous metabolite of the heart.9 In 1929, Drury and Szent-Gyorgyi demonstrated for the first time that adenosine significantly slowed sinus rhythm, produced AV block and facilitated both atrial flutter (AFL) and fibrillation (AF) by shortening the refractory period.10 In 1985, Watt11 hypothesized that increased endogenous production of adenosine and/or hypersensitivity to adenosine could result in SAN dysfunction, particularly tachy-brady syndrome. This is supported by the clinical findings that (1) bolus injection of adenosine suppresses SAN function and produces pauses especially in patients with SAN dysfunction12, 13 and (2) orally administrated theophylline, a potent nonselective antagonist of adenosine receptors, reduces both the frequency and duration of the pauses in patients with sick sinus syndrome.14
Despite abundant evidence of a suppressive effect of adenosine in the SAN, the causal relationship between adenosine and post-tachycardia pauses has not been experimentally demonstrated. Furthermore, due to a lack of direct clinical mapping data from the SAN, the mechanism by which adenosine leads to atrial pauses has not been determined. The atrial pauses during tachy-brady syndrome could result from (1) poor function of SAN as an impulse generator (reduced automaticity and sinus arrest) or (2) conduction block of the generated pulses from the SAN to the atria (SAN exit block). In the present study, we propose that adenosine induces post-tachycardia atrial pauses via suppression of SAN conduction, rather than by slowing pacemaker automaticity. To test this hypothesis, we used high-resolution multi-structural near-infrared fluorescence optical imaging to map functionally the coronary-perfused canine SAN preparation.
METHODS
All animal procedures and protocols (n=9 dogs, 9.9 ± 1.1 months of age, 4 males and 5 females) were approved by the Ohio State University Institutional Animal Care and Use Committee. Detailed description of the heart isolation procedure, data analysis, histology and immunohistochemistry can be found in the Online Supplementary Materials.
Experimental protocol
Optical mapping of the canine SAN has been described previously.15, 16 The excitation-contraction uncoupler blebbistatin17 (10–20 μM) and the near-infrared voltage-sensitive dye, di-4-ANBDQBS,18 (10–40 μM) were added to the perfusate. Optical mapping was performed at a rate of 1000 frames/sec with the MiCam Ultima-L CMOS camera (SciMedia, Costa Mesa, CA) with an optical field of view of 25x25 mm2 (250 μm/pixel).
After control measurements, the preparations (n=7) were perfused with 1, 10 and 100 μM adenosine for 10–30 min, followed by perfusion with the selective A1 antagonist DPCPX (1μM, n=5) for an additional 30 minutes and/or washout of all drugs (n=7). Sinus cycle length (SCL), direct sino-atrial conduction time (SACT) and SAN recovery time (SNRT) were measured.16 SNRT was measured after one minute of slow atrial pacing (3.3 Hz) or tachypacing (7–9 Hz). To assess the potential effects of endogenous adenosine, we conducted two experiments where DPCPX (1μM) was applied before the perfusion of adenosine (100μM) and no significant effects were observed (online Supplemental Results and online Table 1). Histology was performed and anatomic structures of the canine SAN pacemaker complex were identified as previously described.15, 19, 20
Optical mapping data analysis and interpretations
Since canine SAN is surrounded by atrial tissue layers, the near-infrared optical recordings were weighted averages of signals from both atria and SAN structures. The analysis of these multi-component intramural optical action potentials (OAPs) has been previously described.15, 16, 21 To determine the SAN activities during pacing, we developed a new method to extract SAN signals (online Figure 1). The details of the method are described in online Supplemental Materials.
Three different methods were used to measure SNRT (see online Figure 1), including indirect SNRT (SNRTi), direct SNRT (SNRTd), and real SNRT (SNRTr). SNRTi was calculated as the interval from the last atrial pacing to the first post-pacing atrial beat, which is the traditional way of SNRT measurement in the clinical setting. SNRTd was calculated as the interval from last atrial pacing to the first spontaneous SAN activation as described previously by Gomes et al. in 1984 (online Table 2).22 The real SNRT (or SNRTr) was calculated as the interval from the last SAN beat during pacing and the first post-pacing SAN beat. Corrected SNRT (cSNRT) was measured by subtracting preceding SCL from the measured SNRT.
Statistics
Quantitative data are shown as mean ± SD. Hypothesis testing was carried out using an unpaired Student’s t-test or repeated measurements ANOVA (Minitab 16) where appropriate. Following ANOVA, significance of the pairwise difference between SAN compartments (head, center and tail) was determined by post-hoc Tukey’s test. A value of P<0.05 was considered to be statistically significant.
RESULTS
Experimental preparations and anatomy of the canine SAN pacemaker complex
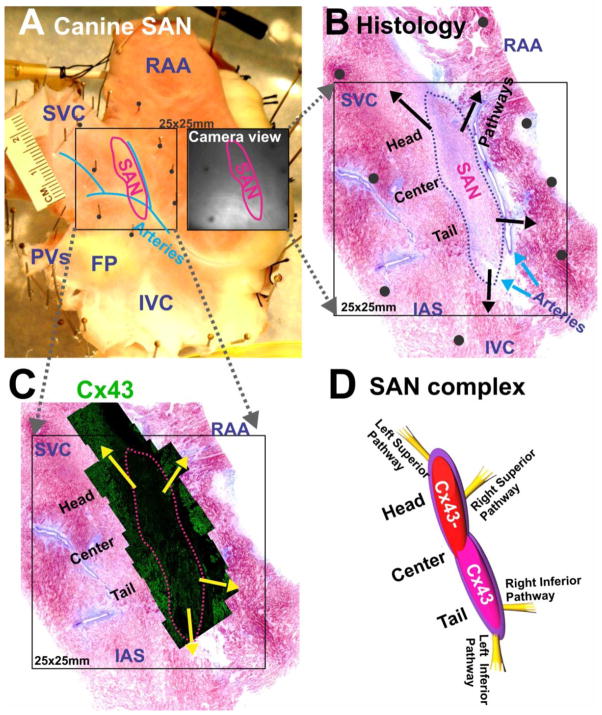
Figure 1 illustrates that the functionally-defined SAN correlates precisely with the SAN structure, which is defined by cell morphology, fiber organization, and a lack of connexin 43 (Cx43) expression in the head of the SAN as previously reported.15 It has been previously recognized that the SAN is insulated from the atria except at specialized SAN conduction pathways (SACPs), via which SAN activation exits to the atrial myocardium.15, 16, 21
Figure 1. Experimental preparation and histology of the canine sino-atrial node (SAN).
(A) An epicardial view of a canine SAN preparation. The SAN is demarcated by a red line. The black square shows the mapped area containing the SAN. The adjacent black-and-white image shows the same area seen from a camera. (B) A parallel histology section of SAN close to the epicardial surface. Arrows indicate locations of SAN conduction pathways. Black dots indicate locations of pins in panel A. (C) Immunolabeling of connexin 43 (Cx43) of SAN confirms the boundary of functionally defined SAN. (D) A graphic representation showing the SAN complex and the superior and inferior SACPs.
SVC: superior vena cava; IVC: inferior vena cava; RAA: right atrial appendage; PVs: pulmonary veins; FP: fat pad; IAS: interatrial septum.
Effect of adenosine on SAN complex during sinus rhythm
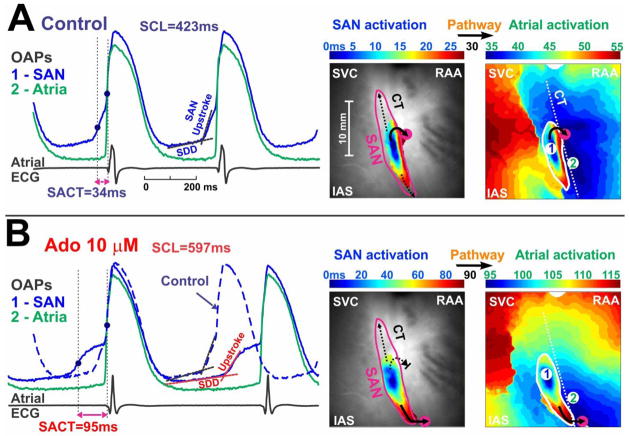
Adenosine (1–100 μM) dose-dependently increased SCL and SACT (Table 1). Adenosine (10 μM) slows sinus rhythm (SR) and sino-atrial conduction, as evident from increased SCL and SACT in Figure 2. This depression in conduction may be partially explained by the depression of slow diastolic depolarization (SDD) and SAN OAP upstroke (Figure 2). Moreover, adenosine might have depressed conduction more in the SAN head than in the SAN tail, leading to a switch of preferential conduction from the right superior to the inferior SACP and a significant change in the atrial activation pattern (Figure 2). A switch in the preferential conduction pathway was observed in 4 out of 7 preparations during perfusion with adenosine (10–100 μM). Moreover, inferior pacemaker shift inside the SAN complex (from head-center to center-tail) was observed in 3 out of 7 preparations. Pacemaker shift outside of SAN complex was not observed during regular spontaneous rhythm.
Table 1.
Effects of Adenosine on canine SAN
| Parameters | Control | Adenosine (1μM) | Adenosine (10μM) | Adenosine (100μM) | DPCPX (1μM) | Washout |
|---|---|---|---|---|---|---|
| SCL (ms) | 477 ± 62 | 551 ± 82† | 661 ± 120† | 778 ± 114† | 447 ± 58 | 440 ± 42 |
| SACT (ms) during sinus rhythm | 41 ± 11 | 52 ± 21 | 75 ± 25* | 86 ± 16† | 44 ± 11 | 50 ± 19 |
| cSNRTi at 3.3 Hz (ms) | 65 ± 28 | 143 ± 21‡ | 277 ± 86‡ | 230 ± 46‡ | 120 ± 49 | 135 ± 87 |
| cSNRTr at 3.3 Hz (ms) | 25 ± 20 | 60 ± 31† | 53 ± 27* | 2 ± 15* | 19 ± 32 | 2 ± 2 |
| cSNRTi at 7.5 Hz (ms) | 95 ± 73 | 124 ± 42 | 198 ± 110 | 184 ± 182 | 136 ± 72 | 108 ± 137 |
| cSNRTr at 7.5 Hz (ms) | 89 ± 37 | 39 ± 39 | 34 ± 20† | 12 ± 19‡ | 8 ± 35‡ | 29 ± 20* |
| SACT of first sinus beat after 7.5Hz SNRT (ms) | 41 ± 5 | 64 ± 42 | 104 ± 16‡ | 221 ± 98† | 120 ± 52* | 58 ± 17 |
| Atrial pause duration (s) | NA | NA | 3.8 | 4.2 ± 3.4 | NA | NA |
| Sustained AF/AFL | 0/7 | NA | 0/7 | 3/7 | 0/5 | NA |
| Post-tachy SAN exit block | 0/7 | NA | 1/7 | 5/7 | 2/5 | NA |
| APD80% (ms) | 164 ± 6 | 165 ± 6 | 161 ± 8 | 141 ± 10† | 162 ± 12 | 164 ± 16 |
p<0.05;
p<0.01;
p<0.001 vs. control
Note that cSNRTs and SACT in this table do not contain SAN exit block, which is summarized in atrial pause duration(s).
Figure 2. Adenosine depresses SAN conduction during sinus rhythm.
On the left are the optical action potentials (OAPs) and pseudo atrial ECG in control condition (A) and during perfusion of 10 μM adenosine (B). The blue OAP (#1) is from the SAN; the green (#2) is from the atria. Optical recordings from the SAN exhibit the slow diastolic depolarization (SDD), slowly rising upstroke of the SAN (SAN component) and the rapidly rising upstroke of the atrial myocardium (atrial component). SAN activation time (SACT) is the delay between the SAN activation and the atrial activation. On the right are maps for SAN activation and subsequent atrial activation in control (A) and 10 μM adenosine (B). Black arrows indicate the pathways through which the activation exits from the SAN to the atria.
Effects of adenosine on post-pacing atrial pauses: role of SAN exit block
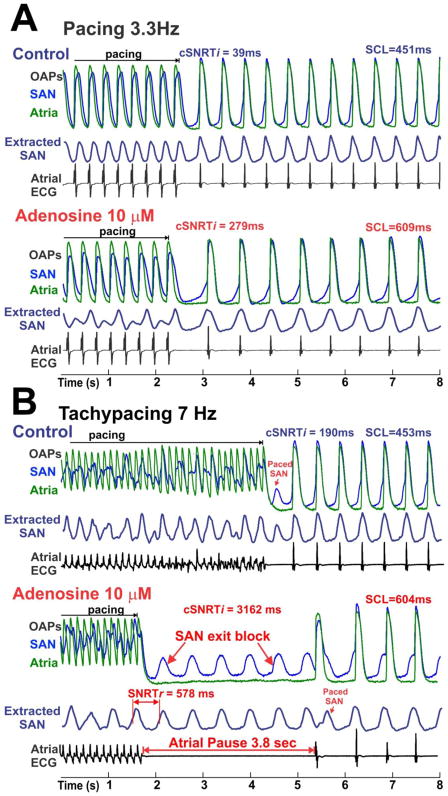
Adenosine (1–100 μM) significantly prolonged the cSNRTi after “slow-”atrial pacing in a dose-dependent manner (Table 1). Figure 3 shows the effect of adenosine (10 μM) on cSNRTi. After “slow” atrial pacing (3.3Hz), cSNRTi was prolonged by adenosine due to a slower recovery of SAN pacemaker activity and conduction (Figure 3A). Atrial tachypacing during adenosine exposure produced a long atrial pause of 3.8 seconds, while the SAN was not quiescent but maintained its regular rhythm (Figure 3B). These data strongly suggest that the post-tachypacing atrial pause is due to the SAN exit block rather than due to reduced SAN automaticity. Atrial pauses of 4.2 ± 3.4 seconds were recorded in 5 out 7 preparations after tachypacing during the highest concentration of adenosine (100 μM).
Figure 3. Adenosine increases the corrected indirect SAN recovery time (cSNRTi).
Optical action potential (OAP) and atrial ECG during and after termination of pacing at 3.3Hz (A) and 7Hz (B) are shown. The blue OAPs are from the low center part of the SAN; the green atrial OAPs are from the CT. The extracted SAN signals (dark blue) are indicated as “extracted SAN”. Corrected indirect SAN recovery time (cSNRTi) and sinus cycle length (SCL) are shown for each recording. Real SNRT (cSNRTr) is shown for the last recording where SAN exit block was present. “Paced SAN” means that SAN was paced by atria.
While it is evident in Figure 3B that abnormally long SNRTi (or atrial pauses) is mainly due to suppressed SAN conduction, it is possible that reduced automaticity of SAN may still contribute. To quantify the specific changes in the automaticity of SAN after tachypacing, we introduced a new SNRT measurement, the real SNRT (or SNRTr) (Figure 3B and online Figure 1). The results (Table 1) show that the corrected SNRTr (cSNRTr) at 3.3Hz pacing first increased and then decreased with increasing dose of adenosine, and that at 7.5Hz pacing, cSNRTr decreased with increasing dose of adenosine. Thus, the inhibitory effects of rapid pacing on the SAN pacemaker automaticity was decreased by adenosine due to a reduced frequency of paced SAN (entrance block) under adenosine (Figure 3B and Figure 4) that prevented SAN automaticity overdrive suppression. These results further emphasized that reduced automaticity is not the mechanism for atrial pauses in our study.
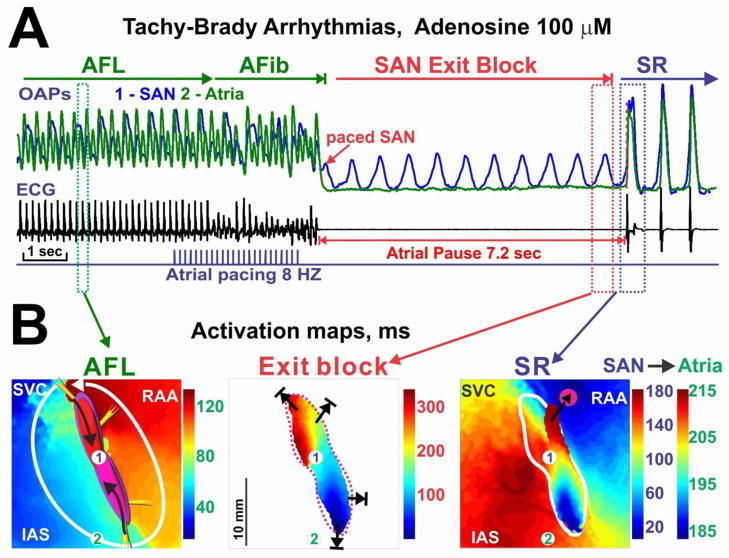
Figure 4. Adenosine-induced tachy-brady arrhythmias.
(A) Optical action potential (OAP) recordings atrial ECG recording during an episode of tachy-brady pattern during adenosine (100 μM). Atrial flutter (AFL) was converted to atrial fibrillation (AFib) by rapid atrial pacing. AFib spontaneously terminated and was followed by an atrial pause, which is evident from the ECG and atrial OAP (green). (B) Activation maps during AFL, SAN exit block, and the first sinus rhythm (SR) beat of the same recording in panel A. Numbers 1 and 2 in the maps indicate the signal origins of OAPs in panel A.
The extracted SAN signals in Figure 3 show that SAN was paced 1:1 at the slow atrial pacing rate but not at the rapid pacing in control. This suggests that the last atrial pacing beat often does not correspond to the onset of the last paced SAN beat during tachypacing. Therefore, tachypacing cSNRTi (Table 1) and cSNRTd (online Table 2) are highly variable parameters that depend on the timing of the last SAN beat relative to the last atrial pacing beat.
Adenosine and Tachy-Brady arrhythmia
Adenosine induced significant shortening of the atrial action potential duration (APD) and refractoriness at 100 μM adenosine (Table 1), that allowed the induction of AFL by rapid pacing in three preparations. In tachy-brady syndrome, termination of AFL is followed by atrial pauses. Figure 4 is an example that recapitulates this phenomenon and shows a post-tachycardia atrial pause of more than 7 seconds. During this long atrial pause, the SAN remains active suggesting SAN exit block as the primary mechanism for post-tachycardia atrial pauses. Similar to the acetylcholine (ACh)-induced AFL reported previously,16 the AFL induced in isolated RA preparations in this study was consistently found to be reentry around SAN (Figure 4B). DPCPX (selective adenosine receptor A1 antagonist) or washout recovered adenosine-induced changes in SCL, SACT, cSNRTi and atrial APD back to values no different from control (Table 1).
SAN activity during atrial pacing
As shown in Figure 3B and previously,16 the frequency in the SAN during tachypacing was lower than that in the atria but faster than its spontaneous rate in control conditions,16 suggesting that the atrial waves entered the SAN with variable entrance block (from 2:1 to 5:1). Online Figure 2 shows a detailed example of how atrial excitation entered the SAN at the end of atrial tachycardia.
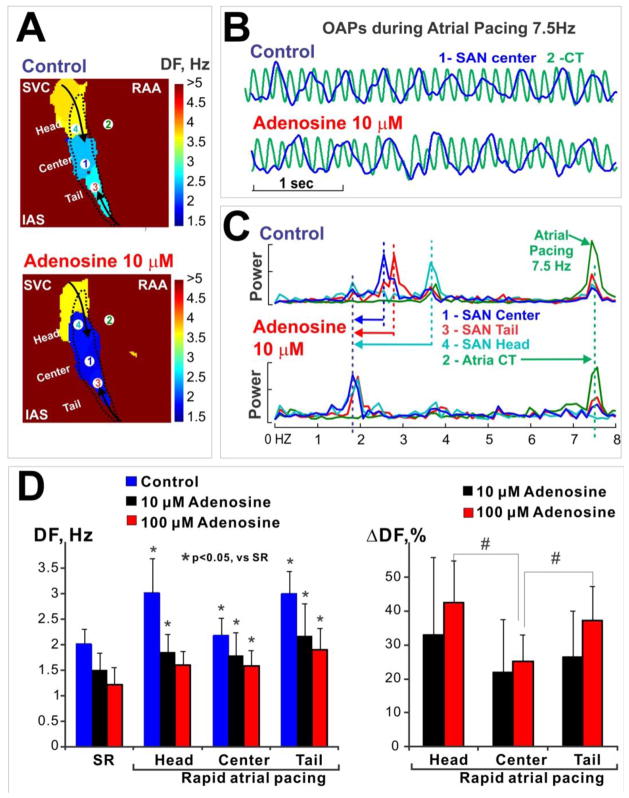
Dominant frequency (DF) 21 was used to quantify adenosine effects on SAN activity during atrial tachypacing (7–9 Hz). The DF was significantly decreased by adenosine (10–100 μM) in all three SAN compartments (head, center, tail, Figure 5A&C). This is consistent with the adenosine-induced reduced SAN frequency rapid pacing, shown in the extracted SAN signals in Figure 3. These results confirm that adenosine depressed the conduction from the atria to the SAN. Furthermore, the decrease of the DF with adenosine was heterogeneous, with the most significant effects on the head and tail of SAN compared with the center of the SAN (Figure 5D).
Figure 5. Adenosine slows the activation frequency of SAN complex during atrial tachypacing (7.5 Hz).
(A) Dominant frequency (DF) maps during rapid pacing. SAN is outlined by a dashed line. Note that the frequency decreased from the head and tail of SAN toward the center of the SAN, and that 10 μM adenosine reduced the frequencies in the SAN.
(B) Optical action potentials (OAP) during pacing under control conditions and 10 μM adenosine. The blue OAP (#1) is from the center of SAN; the green OAP (#2) is from the crista terminalis (CT) in the atria. The exact origins of these OAPs are shown in panel A.
(C) Adenosine-induced SAN frequency shift. Frequency power spectra for four locations are shown, including SAN center (#1), atrial CT (#2), SAN tail (#3) and SAN head (#4). The exact locations are indicated in the maps in panel A. Note that 10 μM adenosine significantly decreased DF, especially in the head of SAN.
(D) Summary of DF and DF change during adenosine perfusion. Left: DF during sinus rhythm (SR) and during rapid atrial pacing at control, 10 μM and 100 μM adenosine. * indicates p<0.05 vs. SR. Right: DF change during adenosine perfusion relative to control condition. # indicates the p<0.05 between the ends (head and tail) and the center of SAN.
Depression of excitability in SAN conduction pathways by adenosine
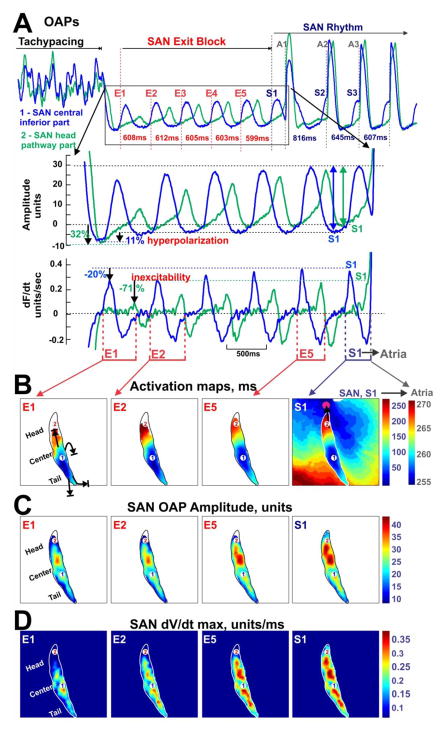
To determine the spatial distribution of depression of SAN excitability after termination of tachypacing, we examined the post-tachypacing changes in SAN AP amplitude, AP upstrokes (dV/dt max), and hyperpolarization. Figure 6 shows the inhibition of excitability in the head of SAN near the superior SACP induced by atrial tachypacing during adenosine perfusion. This depression in excitability is reflected by decreased SAN AP amplitude (Figure 6A&C), reduced upstroke velocity (dV/dt, Figure 6A&D), and hyperpolarization (Figure 6A). This suppression is more significant at the head and tail of SAN compared to the central part, and is therefore heterogeneous. Online Figure 3 also shows that tachycardia nonuniformly suppressed SAN excitability during post-tachycardia pauses.
Figure 6. Adenosine-induced inhibition of SAN excitability by rapid pacing.
(A) OAPs from the center (blue) and the head (green) of SAN during an episode of SAN exit block induced by 10 μM adenosine and tachypacing. Below the OAPs are a close-up view of five beats of SAN exit block (E1-E5) and signal derivatives (maximum derivative of each beat indicates the excitability). (B) Activation maps showing the restoration of SAN conduction toward the head of SAN and the conduction through the superior SAN conduction pathway (black arrow) to the atria. SAN OAP amplitude maps (C) and maximum OAP derivative (dV/dtmax) maps (D) show the recovery of excitability in the head of SAN.
Figure 6 demonstrates that after the termination of atrial pacing, the leading pacemaker in the center-inferior part of the SAN continues to generate regular activity with almost the same frequency as before pacing. However, the SAN activation waves (E1-E5) could not exit to the atrial myocardium due to complete inexcitability of the SAN region next to the SACPs. The significant depression in the superior SAN is correlated with the larger reduction of DF in the SAN head by adenosine during tachypacing (Figure 5). More than 3 seconds were required for the recovery of excitability at the SAN head, which leads to the recovery of conduction through the superior SACP, restoring SR (Figure 6B, S1).
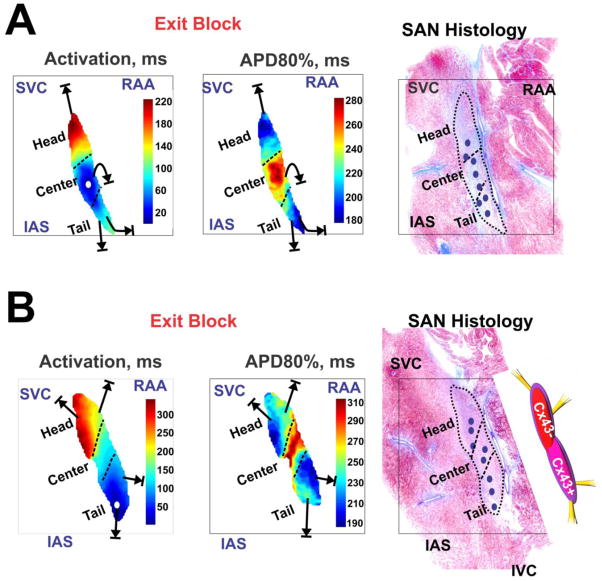
We also successfully measured the APD of various SAN compartments due to complete separation of SAN OAPs from atrial signals during adenosine-induced exit block (Figure 7). Figure 7B shows two representative examples (data from Figures 4 and 6) that indicate that the APD in the center part of SAN (277 ± 10 ms) was significantly longer than the APD in the head (224 ± 15 ms) and tail (201 ± 28 ms) of the SAN (p<0.001 for head vs. center vs. tail APDs). Moreover, the shortest APD areas of the SAN complex (Figure 7-middle) were connected to the preferential entrance conduction pathways through which the SAN was paced by atria (online Figure 2). Furthermore, drift of the leading pacemaker sites was usually observed during the first 3–5 beats of post-tachycardia pauses (SAN exit block) as well as after recovery of sino-atrial conduction and restoration of SR. The leading pacemaker would either drift towards the superior part (Figure 6) or towards the inferior part (Online Figure 3) by 1 to 10 mm. Figure 7C shows a summary of leading pacemaker sites in these two SANs.
Figure 7. SAN activation and repolarization during SAN exit block.
(A) and (B) show the activation maps and action potential duration (APD) maps at 80% recovery (APD80%) for two canine SANs. Note that conduction in the head of SAN is slower compared to the tail of SAN, consistent with more Cx43 expression in the inferior part of SAN compared to the superior part. Far right, histology overlays display a graphic representation of SAN complexes. Blue small ovals indicate locations of leading pacemaker sites during adenosine-induced exit block and recovery from it.
DISCUSSION
In this study of a canine SAN preparation, we found that adenosine heterogeneously depressed SAN conduction and excitability leading to post-tachycardia atrial pauses up to several seconds and an apparent tachy-brady syndrome pattern. We observed that the post-tachycardia atrial pauses during adenosine resulted from SAN exit block rather than inhibition of pacemaker automaticity.
Electrophysiological consequences of adenosine in SAN pacemaker cells include activation of a potassium outward current (IKAdo,ACh), as well as the suppression of inward calcium current (ICa) and the hyperpolarization-activated current (“funny” current or If).9, 23–25 These effects could explain our observations of reduced excitability of the SAN. West and Belardinelli demonstrated that the response to adenosine was heterogeneous in the rabbit SAN.9 In the same study, this heterogeneous response was suggested to lead to the pacemaker shift during adenosine treatment,9 and echoes the heterogeneous conduction depression and pacemaker shift during sinus rhythm and post-tachycardia atrial pauses observed in our canine study. The mechanism for this heterogeneous suppression is less well defined. It could be related to variable expression of adenosine receptors and their downstream effectors, such as the IK,Ado channels, in different compartments of SAN complex. The heterogeneous sensitivity to adenosine might also be explained by the complex specialized structure of the SAN. SAN pacemaker tissue near the superior and inferior SACPs might be more susceptible to overdrive suppression by rapid atrial pacing due to their proximity to the atria and shorter repolarization time (and presumably shorter refractory periods, see Figure 7). This would potentially filter the rapid frequency of stimulation and thus attenuate the overdrive suppression of the SAN center. This may explain why rapid atrial pacing did not suppress SAN automaticity during higher concentrations of adenosine (Figure 3B, and cSNRTr in Table 1).
The endogenous production of adenosine in vivo is relatively low in a normal heart at resting physiological conditions without ischemia or hypoxia (<1μM in coronary sinus plasma and interstitial fluid26). The absence of DPCPX effect on the basic SAN function (online Table 1) supports our assumption that the effects of endogenous adenosine are minor in our experimental conditions. Thus, in our study, we mimicked the conditions with high production of adenosine (such as ischemia26 and hypoxia27) by adding adenosine to the perfusate. However, only the combination of adenosine and rapid atrial rates (pacing or tachycardia) led to pauses. The observation that adenosine alone did not induce pauses might be due to the absence of any pre-existing SAN dysfunction in normal dogs. In patients with SAN dysfunction, it has been shown that either pacing alone or bolus injection of adenosine alone can produce atrial pauses.12, 13 In the absence of SAN dysfunction in normal dogs, adenosine alone or rapid atrial rates15, 16 alone only increase susceptibility to atrial pauses, but are insufficient to reach the threshold for the induction of exit block and atrial pauses.
SAN dysfunction could result from intrinsic changes in the node itself, or result from extrinsic causes.4 Our results support adenosine as an extrinsic cause of SAN dysfunction and provide experimental evidence to support Watt’s hypothesis11 on the causal relationship between adenosine and tachy-brady syndrome. As we have shown, adenosine contributes to tachy-brady activation patterns by both producing post-tachycardia pauses and facilitating AFL/AF by shortening the APD, the latter of which is consistent with the findings reported in previous pioneering studies.10, 24
Ideally, the role of adenosine in SAN dysfunction should be studied in the human heart with SAN dysfunction. Indeed, the normal canine heart is different from the diseased human heart with SAN dysfunction. However, access to intact explanted human hearts is limited.21 Both anatomical1, 28, 29 and functional20, 30 studies suggest that the canine SAN preparation is a realistic model for the human SAN.15, 21 Therefore, information gained from the canine SAN preparation improves our mechanistic understanding of human SAN dysfunction.
CONCLUSIONS
These data directly demonstrate that adenosine-induced post-tachycardia atrial pauses resulted from depressed conduction between the SAN and atria (exit block) rather than from slowed pacemaker automaticity in canine atria. Conduction block was preferentially related to adenosine-induced excitability depression within the SAN superior and inferior conduction pathways. We suggest that local targeting of adenosine receptors in SACPs could be sufficient to prevent SAN arrhythmias by restoring proper conduction between the SAN and atrial myocardium without affecting other cardiac functions.
Supplementary Material
Acknowledgments
FUNDING SOURCES
Davis Heart and Lung Research Institute (VVF), and NIH grants R01 NHLBI/HL089836 (CAC) and NHLBI/HL086700 (GEB).
We thank Dr. Stanislav Zakharkin for his help in statistical data analysis and Jeanne Green for her technical assistance.
ABBREVIATIONS
- ACh
acetylcholine
- AFL
atrial flutter
- AF
atrial fibrillation
- APD
action potential duration
- APD80%
APD at 80% repolarization
- cSNRT
corrected sinoatrial node recovery time
- Cx43
connexin 43
- DF
dominant frequency
- FP
fat pad
- IAS
interatrial septum
- IVC
inferior vena cava
- OAP
optical action potential
- PVs
pulmonary veins
- RAA
right atrial appendage
- SAN
sinoatrial node
- SACP
sinoatrial node conduction pathway
- SACT
sinoatrial conduction time
- SCL
sinus cycle length
- SNRT
sinoatrial node recovery time
- SNRTi
indirect SNRT
- SNRTd
direct SNRT
- SNRTr
real SNRT
- SDD
slow diastolic depolarization
- SR
sinus rhythm
- SVC
superior vena cava
Footnotes
DISCLOSURES
None.
Publisher's Disclaimer: This is a PDF file of an unedited manuscript that has been accepted for publication. As a service to our customers we are providing this early version of the manuscript. The manuscript will undergo copyediting, typesetting, and review of the resulting proof before it is published in its final citable form. Please note that during the production process errors may be discovered which could affect the content, and all legal disclaimers that apply to the journal pertain.
Reference List
- 1.James TN. Anatomy of the human sinus node. Anat Rec. 1961;141:109–39. doi: 10.1002/ar.1091410205. [DOI] [PubMed] [Google Scholar]
- 2.Boyett MR, Honjo H, Kodama I. The sinoatrial node, a heterogeneous pacemaker structure. Cardiovasc Res. 2000;47:658–87. doi: 10.1016/s0008-6363(00)00135-8. [DOI] [PubMed] [Google Scholar]
- 3.Opthof T. The mammalian sinoatrial node. Cardiovasc Drugs Ther. 1988;1:573–97. doi: 10.1007/BF02125744. [DOI] [PubMed] [Google Scholar]
- 4.Mangrum JM, DiMarco JP. The evaluation and management of bradycardia. N Engl J Med. 2000;342:703–9. doi: 10.1056/NEJM200003093421006. [DOI] [PubMed] [Google Scholar]
- 5.Short DS. The syndrome of alternating bradycardia and tachycardia. Br Heart J. 1954;16:208–14. doi: 10.1136/hrt.16.2.208. [DOI] [PMC free article] [PubMed] [Google Scholar]
- 6.Asseman P, Berzin B, Desry D, et al. Persistent sinus nodal electrograms during abnormally prolonged postpacing atrial pauses in sick sinus syndrome in humans: sinoatrial block vs overdrive suppression. Circulation. 1983;68:33–41. doi: 10.1161/01.cir.68.1.33. [DOI] [PubMed] [Google Scholar]
- 7.Mandel W, Hayakawa H, Danzig R, Marcus HS. Evaluation of sino-atrial node function in man by overdrive suppression. Circulation. 1971;44:59–66. doi: 10.1161/01.cir.44.1.59. [DOI] [PubMed] [Google Scholar]
- 8.Yeh SJ, Lin FC, Wu D. Complete sinoatrial block in two patients with bradycardia-tachycardia syndrome. J Am Coll Cardiol. 1987;9:1184–8. doi: 10.1016/s0735-1097(87)80325-x. [DOI] [PubMed] [Google Scholar]
- 9.West GA, Belardinelli L. Sinus slowing and pacemaker shift caused by adenosine in rabbit SA node. Pflugers Arch. 1985;403:66–74. doi: 10.1007/BF00583284. [DOI] [PubMed] [Google Scholar]
- 10.Drury AN, Szent-Gyorgyi A. The physiological activity of adenine compounds with especial reference to their action upon the mammalian heart. J Physiol. 1929;68:213–37. doi: 10.1113/jphysiol.1929.sp002608. [DOI] [PMC free article] [PubMed] [Google Scholar]
- 11.Watt AH. Sick sinus syndrome: an adenosine-mediated disease. Lancet. 1985;1:786–8. doi: 10.1016/s0140-6736(85)91449-7. [DOI] [PubMed] [Google Scholar]
- 12.Lin JM, Lin JL, Lai LP, Huang SK. Usefulness of single-bolus adenosine test for confirming sinus node dysfunction and correlation with atrial overdrive suppression test. Am J Cardiol. 2004;94:1569–72. doi: 10.1016/j.amjcard.2004.08.043. [DOI] [PubMed] [Google Scholar]
- 13.Fragakis N, Antoniadis AP, Korantzopoulos P, Kyriakou P, Koskinas KC, Geleris P. Sinus nodal response to adenosine relates to the severity of sinus node dysfunction. Europace. 2012;14:859–64. doi: 10.1093/europace/eur399. [DOI] [PubMed] [Google Scholar]
- 14.Saito D, Matsubara K, Yamanari H, et al. Effects of oral theophylline on sick sinus syndrome. J Am Coll Cardiol. 1993;21:1199–204. doi: 10.1016/0735-1097(93)90246-w. [DOI] [PubMed] [Google Scholar]
- 15.Fedorov VV, Schuessler RB, Hemphill M, et al. Structural and functional evidence for discrete exit pathways that connect the canine sinoatrial node and atria. Circ Res. 2009;104:915–23. doi: 10.1161/CIRCRESAHA.108.193193. [DOI] [PMC free article] [PubMed] [Google Scholar]
- 16.Fedorov VV, Chang R, Glukhov AV, et al. Complex interactions between the sinoatrial node and atrium during reentrant arrhythmias in the canine heart. Circulation. 2010;122:782–9. doi: 10.1161/CIRCULATIONAHA.109.935288. [DOI] [PMC free article] [PubMed] [Google Scholar]
- 17.Fedorov VV, Lozinsky IT, Sosunov EA, et al. Application of blebbistatin as an excitation-contraction uncoupler for electrophysiologic study of rat and rabbit hearts. Heart Rhythm. 2007;4:619–26. doi: 10.1016/j.hrthm.2006.12.047. [DOI] [PubMed] [Google Scholar]
- 18.Matiukas A, Mitrea BG, Qin M, et al. Near-infrared voltage-sensitive fluorescent dyes optimized for optical mapping in blood-perfused myocardium. Heart Rhythm. 2007;4:1441–51. doi: 10.1016/j.hrthm.2007.07.012. [DOI] [PMC free article] [PubMed] [Google Scholar]
- 19.Fedorov VV, Hucker WJ, Dobrzynski H, Rosenshtraukh LV, Efimov IR. Postganglionic Nerve Stimulation Induces Temporal Inhibition of Excitability in the Rabbit Sinoatrial Node. Am J Physiol. 2006;291:H612–H623. doi: 10.1152/ajpheart.00022.2006. [DOI] [PubMed] [Google Scholar]
- 20.Fedorov VV, Glukhov AV, Chang R. Conduction barriers and pathways of the sinoatrial pacemaker complex: their role in normal rhythm and atrial arrhythmias. Am J Physiol Heart Circ Physiol. 2012;302:H1773–H1783. doi: 10.1152/ajpheart.00892.2011. [DOI] [PubMed] [Google Scholar]
- 21.Fedorov VV, Glukhov AV, Chang R, et al. Optical mapping of the isolated coronary-perfused human sinus node. J Am Coll Cardiol. 2010;56:1386–94. doi: 10.1016/j.jacc.2010.03.098. [DOI] [PMC free article] [PubMed] [Google Scholar]
- 22.Gomes JA, Hariman RI, Chowdry IA. New application of direct sinus node recordings in man: assessment of sinus node recovery time. Circulation. 1984;70:663–71. doi: 10.1161/01.cir.70.4.663. [DOI] [PubMed] [Google Scholar]
- 23.West GA, Belardinelli L. Correlation of sinus slowing and hyperpolarization caused by adenosine in sinus node. Pflugers Arch. 1985;403:75–81. doi: 10.1007/BF00583285. [DOI] [PubMed] [Google Scholar]
- 24.Belardinelli L, Giles WR, West A. Ionic mechanisms of adenosine actions in pacemaker cells from rabbit heart. J Physiol. 1988;405:615–33. doi: 10.1113/jphysiol.1988.sp017352. [DOI] [PMC free article] [PubMed] [Google Scholar]
- 25.Zaza A, Rocchetti M, DiFrancesco D. Modulation of the hyperpolarization-activated current (I(f)) by adenosine in rabbit sinoatrial myocytes. Circulation. 1996;94:734–41. doi: 10.1161/01.cir.94.4.734. [DOI] [PubMed] [Google Scholar]
- 26.Lasley RD, Hegge JO, Noble MA, Mentzer RM., Jr Comparison of interstitial fluid and coronary venous adenosine levels in in vivo porcine myocardium. J Mol Cell Cardiol. 1998;30:1137–47. doi: 10.1006/jmcc.1998.0683. [DOI] [PubMed] [Google Scholar]
- 27.Jenkins JR, Belardinelli L. Atrioventricular nodal accommodation in isolated guinea pig hearts: physiological significance and role of adenosine. Circ Res. 1988;63:97–116. doi: 10.1161/01.res.63.1.97. [DOI] [PubMed] [Google Scholar]
- 28.James TN, Sherf L, Fine G, Morales AR. Comparative ultrastructure of the sinus node in man and dog. Circulation. 1966;34:139–63. doi: 10.1161/01.cir.34.1.139. [DOI] [PubMed] [Google Scholar]
- 29.Truex RC, Smythe MQ, Taylor MJ. Reconstruction of the human sinoatrial node. Anat Rec. 1967;159:371–8. doi: 10.1002/ar.1091590406. [DOI] [PubMed] [Google Scholar]
- 30.Boineau JP, Schuessler RB, Hackel DB, Miller CB, Brockus CW, Wylds AC. Widespread distribution and rate differentiation of the atrial pacemaker complex. Am J Physiol. 1980;239:H406–H415. doi: 10.1152/ajpheart.1980.239.3.H406. [DOI] [PubMed] [Google Scholar]
Associated Data
This section collects any data citations, data availability statements, or supplementary materials included in this article.


