Abstract
Objectives
Late-life major depression (LLD) is characterized by distinct epidemiological and psychosocial factors, as well as medical co-morbidities that are associated with specific neuroanatomical differences. The purpose of this study was to use interregional correlations of cortical and subcortical volumes to examine cortical-subcortical structural network properties in subjects with LLD compared to healthy comparison subjects.
Design
Cross-sectional neuroimaging study
Setting
General community
Participants
We recruited 73 healthy elderly comparison subjects and 53 subjects with LLD who volunteered in response to advertisements.
Measurements
Brain network connectivity measures were generated by correlating regional volumes after controlling for age, gender, and intracranial volume using the Brain Connectivity Toolbox (www.brain-connectivity-toolbox.net).
Results
Results for overall network strength revealed that LLD networks showed a greater magnitude of associations for both positive and negative correlation weights compared to healthy elderly networks. LLD networks also demonstrated alterations in brain network structure when compared to healthy comparison subjects. LLD networks were also more vulnerable to targeted attacks compared to healthy elderly comparison subjects and this vulnerability was attenuated when controlling for white matter alterations.
Conclusions
Overall, this study demonstrates that cortical-subcortical network properties are altered in LLD and may reflect the underlying neuroanatomical vulnerabilities of the disorder.
Keywords: geriatric, depression, neuroimaging, network analysis, connectivity
Objective
Late-life depression (LLD) is characterized by distinct epidemiological and psychosocial factors, as well as medical co-morbidities (1). Among the striking features of LLD are neuroanatomical alterations that have been demonstrated across a number of neuroimaging studies. Structural imaging studies in LLD have identified volume alterations in prefrontal cortex, hippocampus, amygdala, and basal ganglia structures (recently reviewed in (34)). In addition, white matter hyperintensities have been seen in periventricular, deep white matter and subcortical regions in LLD (24). More subtle white matter alterations have been detected with diffusion tensor imaging (DTI) and magnetization transfer (MT) suggestive of microstructural abnormalities, even in normal-appearing white matter (19,27,28). It has been suggested that the combination of gray matter and subcortical volumetric changes and white matter alterations are indicative of disruption of cortical-subcortical networks in LLD (26). Kumar and Cook also propose that such structural alterations adhere to the functional alterations seen in LLD given that the white matter connecting frontal and subcortical structures is involved with mood regulation and emotional functioning via the limbic-cortical-striatal-pallidal-thalamic circuit. Because of the hypothesized disruption in structural connectivity and its implications for behavior, methods to ascertain the topological organization of these networks would be of particularly utility in understanding LLD.
Several techniques to address structural connectivity have come to the fore in recent years. One method involves examining structural covariance based on interregional correlation of morphological measures such as cortical thickness, gray matter volume, or gray matter density. This technique is based on the notion that positive correlations are related to connectivity defined by axonal connections between regions with common trophic and developmental influences (32). Structural covariance has been shown to reveal patterns of correlation that reflect striking interhemispheric connectivity (33). Additionally, interregional correlations of cortical thickness have been used to identify age-related alterations in language networks and structural connectivity variations associated with IQ(29).
For the present study, we adapted structural covariance techniques to a graph theoretical approach in order to further understand brain connectivity alterations in LLD. Graph theory models provide an organizational chart for the brain based on anatomical features by creating a graph made up of nodes and edges that represent the network. Nodes are typically defined by brain region and edges are the connections between those regions. These graphs have quantifiable features that reveal characteristics about how information flows throughout the network. Such features include the clustering coefficient, characteristic path length, efficiency, and centrality. The clustering coefficient provides a measure of the degree to which neighboring nodes are interconnected. The characteristic path length is the average shortest distance between any two nodes. The optimal organization of a network has been characterized by high clustering coefficients relative to small path lengths and has been referred to as a “small-world” network(44). Small path lengths are also related to higher network efficiencies, since with small path lengths, information transfer occurs more readily throughout the network. Centrality is a measurement of a node’s importance or influence in the network. These measures have been used to identify altered cortical network organization in a number of conditions including Alzheimer’s disease, schizophrenia, synesthesia, and normal aging (4,21,22,46). Results of these studies have revealed disease-specific alterations in cortical organization, impaired network efficiencies, and regional abnormalities associated with these conditions.
The goal of the present study is to measure cortical-subcortical network properties associated with LLD using graph theory based methods. To our knowledge, this is the first application of this technique to examine whole-brain network characteristics associated with LLD. DTI and resting-state fMRI are imaging modalities that tend to demonstrate regional brain differences; the advantages of whole-brain network analysis (which may use the aforementioned modalities as source material) allow one to understand the organizational properties of the human brain when modeled as a graph, to examine the impact of specific brain regions in this context, and to investigate possible abnormalities or alternations in brain network properties in disease states. Given previous studies demonstrating white matter alterations involved in the disruption of cortical-subcortical circuits, we hypothesize that subjects with LLD will demonstrate altered connectivity patterns characterized by decreased smallworld network properties, decreased global network efficiency, and impaired network resilience when compared to healthy older adults.
Methods
Subject Recruitment
We recruited 53 patients (18 men and 35 women) diagnosed as having major depressive disorder (MDD) using established DSM-IV criteria and 73 healthy comparison subjects with no prior or current history of MDD (22 men and 51 women) who were 60 years of age or older (range 60 – 91 years old). Subjects were recruited from the community in response to local newspaper advertisements, newsletters, and radio advertisements. All study participants provided written informed consent in keeping with the guidelines of the Human Subjects Protection Committee of the University of California, Los Angeles.
All study participants received a Structured Clinical Interview for DSM based on the DSM-IV. Inclusion criteria encompassed a diagnosis of MDD, Hamilton Depression Scale (20) scores of 15 or greater on the 17-item scale, having not taken antidepressants and other psychotropic medications for at least 2 weeks before clinical assessments, and absence of dementia by medical history and mental status examination. Severity of depression was also assessed using the Geriatric Depression Scale (49) (GDS) and Beck Depression Inventory (5) (BDI). Comparison subjects did not meet criteria for MDD. Exclusion criteria for all subjects were history of substance abuse or other Axis I disorder as determined from the Structured Clinical Interview for DSM, clinical evidence of dementia, Mini-Mental State Examination (MMSE;(17)) score of less than 26, neurologic disorder such as Parkinson disease, history of transient ischemic attack, history of head trauma with loss of consciousness, current or unstable serious medical illness, chronic disease such as syphilis that could affect cognitive function, or history or evidence of psychotic symptoms or concurrent Axis I psychiatric disorder. Stable chronic conditions, such as diabetes mellitus, hypertension, or history of non-central nervous system cancers, were not exclusionary. All subjects received a comprehensive laboratory assessment and a comprehensive neuropsychological battery. The predicted Verbal IQ from the Wechsler Test of Adult Reading (45)was assessed as a global measure of pre-morbid IQ.
MRI Acquisition and Volumetric Analysis
All subjects were scanned using a Trio Tim 3T MRI scanner (Siemens Medical Solutions, Inc., Munich, Germany). High resolution 3D MPRAGE (Magnetization Prepared Rapid Acquisition Gradient Echo) sequence was acquired on each subject with the following parameters: FOV=240×210mm, TR/TE/TI=2200/2.24/900ms, flip angle 9°, 224 contiguous coronal slices, in-plane resolution=0.9375×0.9375mm2, acquisition matrix=256×224, slice thickness=0.9mm, NOA=1. All MRI results were examined for space-occupying and other focal lesions, including stroke and all subjects were free of any gross neuroanatomical abnormalities.
After acquisition, cortical reconstruction and volumetric segmentation were performed using the Freesurfer Image Analysis Suite (version 4.5.0, http://surfer.nmr.mgh.harvard.edu). The technical details of these procedures are described in prior publications (13,16). Briefly, this processing includes motion correction of volumetric T1 weighted images, removal of non-brain tissue using a hybrid watershed/surface deformation procedure (36), automated Talairach transformation, segmentation of the subcortical white matter and deep gray matter volumetric structures (including hippocampus, amygdala, caudate, putamen, ventricles) (15,16), normalization(39), tessellation of the gray matter white matter boundary, automated topology correction(14,37), and surface deformation following intensity gradients to optimally place the gray/white and gray/cerebrospinal fluid borders at the location where the greatest shift in intensity defines the transition to the other tissue class (10,13). The structural segmentation described above was used to identify white matter hypointensities (WMH) on T1 weighted images as proxy measures of white matter hyperintensities found on T2 weighted images. A prior study by Smith et al. demonstrated a good agreement between Freesurfer and manual methods for measuring white matter hyperintensities (40). In our own internal analysis, Freesurferobtained WMH values were highly correlated with manual measurements of white matter hyperintensities in a test sample of LLD subjects with both T1 and T2 weighted images available (r = .91, p < 10−7, n = 20).
Network Analysis
Network Construction
To construct connectivity matrices, we used the Freesurfer image analysis suite to parcellate cortical and subcortical gray matter into a total of 82 regions of interest (41 per hemisphere). The list of regions is detailed in Appendix I. For each subject group, we constructed a corresponding 82 × 82 brain connectivity matrix by defining both the (i, j) and (j, i) components of the matrix to be the Pearson’s product-moment correlation of regions i and j using volume measurements after controlling for age, gender, and intracranial volume (rij). Connectivity matrices were binarized such that for any matrix entry aij was equal to 1 if rij exceeded a given threshold (i.e. 0.2); otherwise aij was set to zero. Binarized connectivity matrices were constructed using a range of thresholds (from 0 to 1), thus creating networks of different densities. This was done to ensure that any group differences in network measures were not due to differences in the number of connections in any given matrix.
Network Parameters
The clustering coefficient of a network reflects the degree of network segregation and can be measured by calculating gamma, the normalized clustering coefficient (Creal/Crand). Creal is the clustering coefficient of the actual network and Crand represents clustering coefficient of random networks of equal size and density to the actual network. The characteristic path length indicates the degree of network integration and can be measured by calculating lambda, a normalized characteristic path length (Lreal/Lrand). Lreal is the average shortest path length for all node pairs in the network and Lrand is the average shortest path length in a random network of equal size and density. The small-world nature of the networks was determined by sigma, the ratio of gamma and lambda. Sigma values greater than 1 are indicative of a small-world network, reflecting the optimal design of a network balancing segregation and integration(44). These measures as well as network strength (the mean positive and negative correlation weights) and global efficiency (a measure related to the inverse of the path length) were calculated using the Brain Connectivity Toolbox(35) (http://www.brain-connectivitytoolbox.net). Network influence was measured using betweenness centrality to determine hubs. Betweenness centrality is a measure of a node’s influence on the network and is defined by the proportion of all shortest paths in the network that contain a given node. Details on the equations used to generate the network metrics of interest have been previously published (35).
Network Resilience
Resilience refers to the ability to withstand perturbations or failures in the network. To measure network resilience, networks were constructed at a fixed density of 19%, the lowest density at which all regions were connected in the networks in our sample. This ensures the involvement of all regions in the network model without extraneous connections that could influence the results of the subsequent failure analyses. In the random failure analysis, nodes or regions were removed at random and the size of the largest connected component was calculated as a measure of network resilience. In the targeted failure analysis, hub nodes or regions were removed from the network in decreasing order of importance, as assessed by betweenness centrality. In a secondary analysis, networks were constructed using interregional correlations of volume controlling for age, gender, ICV, and WMH volume to assess the impact of WMH on network resilience.
Statistical Analysis
Demographic and clinical variables were analyzed using an independent sample t-test for continuous variables and chi-squared test for categorical variables. Levene’s Test for Equality of Variances were used for all t-tests (30). Overall correlation strength differences were determined using a two-sample ttest after performing a Fisher r-to-z transformation. According to the methods of He et al(22), specific interregional correlation differences were analyzed by determining whether correlations were first significantly nonzero within both subject groups after false discovery rate (FDR) (6) correction and then were significantly different between groups after FDR correction. All tests were two-tailed and FDR correction was performed with a significance threshold set at q < .05. Between-group differences in network metrics and network resilience measures were determined using non-parametric permutation tests with 1000 iterations (8). Significance was set a threshold of p < .05.
Results
Clinical and demographic data
There was no significant difference in age, gender, ethnicity, education, MMSE or verbal IQ between subject groups. As expected, LLD subjects scored significantly higher on self-rated depression measures (Table 1).
Table 1.
Clinical and Demographic Variables.
Clinical and Demographic Measures
| HC | LLD | t | df | p-value | |
|---|---|---|---|---|---|
| N | 73 | 53 | |||
| Age | 70.64 (7.15) | 69.36 (8.52) | .909 | 124 | .360 |
| Gender (M/F) | 22/51 | 18/35 | χ2 = .207 | 1 | .649 |
| Race (White/Non-White) | 58/15 | 47/6 | χ2 = 4.82 | 1 | .185 |
| Education (years) | 16.40 (2.20) | 15.62 (2.94) | 1.62 | 91.735 | .109 |
| GDS | 2.03 (1.69) | 19.65 (4.59) | −26.64 | 62.38 | <.0001 |
| SOl | 2.75 (4.26) | 25.64 (9.11) | −20.05 | 59.33 | <.0001 |
| MMSE | 29.04 (1.23) | 28.91 (1.43) | .569 | 124 | .570 |
| VerballQ | 114.40 (7.05) | 113.83 (8.09) | .417 | 120 | .678 |
Healthy comparison (HC) and late-life depressed (LLD) subjects were well matched on age, gender, education, race, and global cognition. LLD subjects had significantly higher scores on depression rating scales (GDS – Geriatric Depression Scale; BDI – Beck Depression Inventory; MMSE – Mini-Mental Status Exam; WTAR – Wechsler Test of Adult Reading).
Global network characteristics
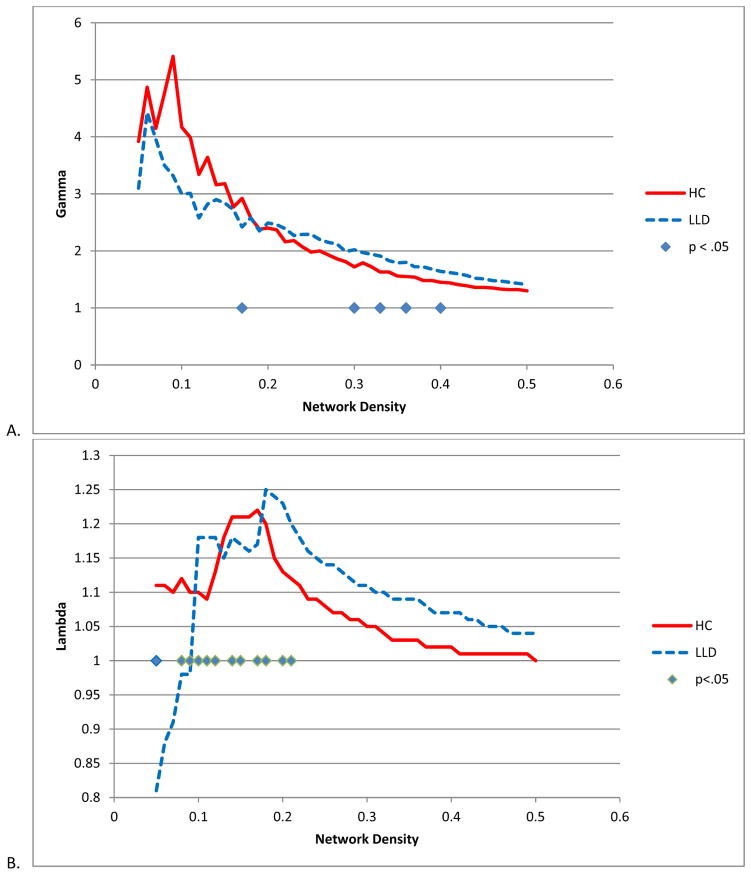
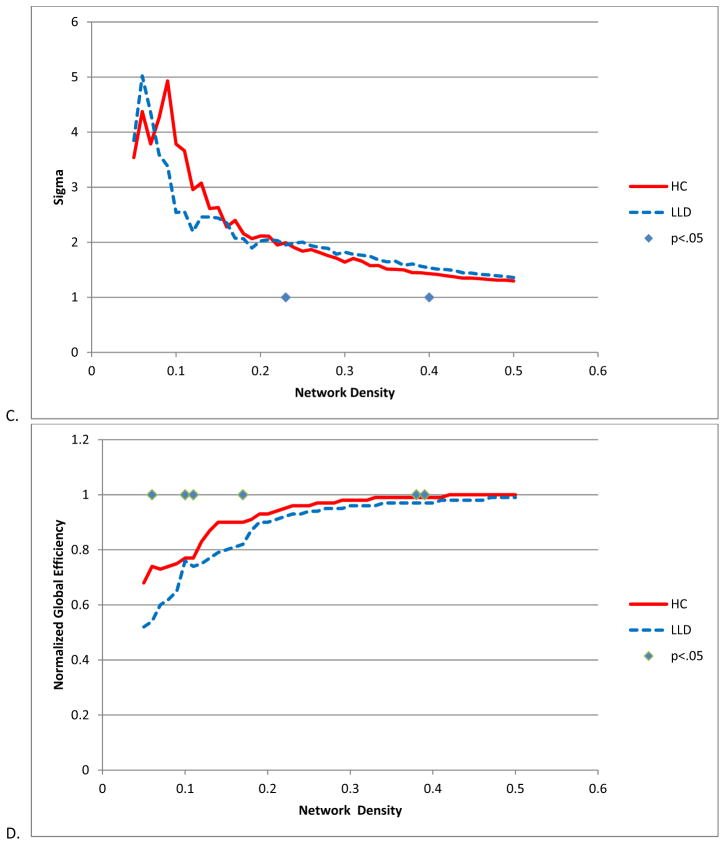
Both HC and LLD networks demonstrated extensive positive and negative interregional correlations with strong correlations between bilateral homologous regions (Figure 1). The LLD network had significantly overall stronger positive (t = −26, df = 5500, p < .0001) and more negative correlation strengths (t = 4.25, df = 485, p < .0001) compared to the HC network (Figure 2). When examining specific interregional correlations, with the exception of the left middle frontal and medial orbitofrontal gyri, LLD correlations were significantly higher compared to HC, particularly between interhemispheric and interlobar regions (Table 2). Across a range of network densities, LLD networks tended to have higher gamma and lambda values compared to HC networks with a select number of densities showing a significant difference between groups (Figure 3A and 3B). While at smaller network densities, LLD networks had less “small-worldness” compared to HC networks, we observed very few significant differences in small-world characteristics as measured by sigma (Figure 3C). However, normalized global efficiency was significant lower in LLD networks relative to HC networks (Figure 3D) for select densities.
Figure 1.
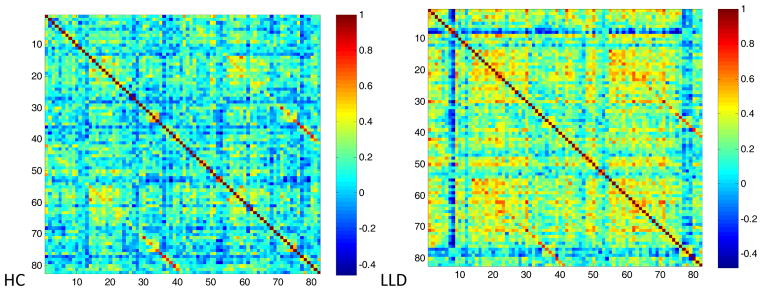
Interregional volume correlation matrices.
Figure 2.
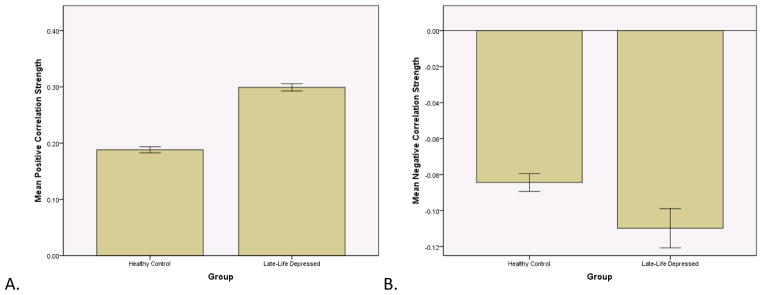
Correlation strength. The late-life depressed correlations matrix had overall significantly higher positive strengths (t = −26, df = 5500, p < .0001) and significantly more negative strengths (t = 4.25, df = 485, p < .0001). Error bars represent one standard deviation.
Table 2.
Significant interregional correlation differences.
| Correlation (r) | |||||
|---|---|---|---|---|---|
| Region | Region | HC | LLD | Z score | p-value |
| rh entorhinal | Ih superior frontal | −0.241 | 0.393 | −3.57 | <.001 |
| rh isthmus cingulate | Ih entorhinal | −0.274 | 0.375 | −3.65 | <.001 |
| rh isthmus cingulate | rh superior temporal | −0.182 | 0.484 | −3.85 | <.001 |
| Ih temporal pole | rh precuneus | −0.134 | 0.551 | −4.08 | <.0001 |
| Ih rostral middle frontal | Ih medial orbitofrontal | 0.257 | −0.330 | 3.27 | .001 |
HC – Healthy comparison, LLD – Late-life depressed. Bold: The only interregional correlation with lower r values in LLD was a local connection between the left middle frontal and left orbital frontal gyri.
Figure 3.
Global network metrics. A. Gamma B. Lambda C. Sigma D. Global Efficiency. Significance was established if the absolute difference between groups was greater than 95% of the differences observed in 1000 resampled groups (p < .05).
Network Influence
Abnormalities in network influence were assessed at a fixed network density of 19%. The small-world parameters of the networks generated at this density are shown in Table 3. Thirteen regions demonstrated altered network influence in the LLD network compared to the HC network (Table 4). These regions comprise both elements of limbic networks (bilateral hippocampus, right amygdala, right insula, right entorhinal cortex) and the default mode network (left paracentral, left fusiform, right precuneus, right inferior parietal, right bank of the superior temporal sulcus). The location of significantly different network hubs is shown in Figure 4.
Table 3.
Cross-sectional network metrics.
| HC | LLD | |
|---|---|---|
| Gamma | 2.38 | 2.35 |
| Lambda | 1.15 | 1.24 |
| Sigma | 2.066 | 1.897 |
| Normalized Global Efficiency | 0.93 | 0.9 |
Network parameters at network density of 19%, minimum threshold at which all regions are connected in the network for healthy comparison (HC) and late-life depressed subjects (LLD).
Table 4.
Hub regions.
| HC> LLD | LLD > HC |
|---|---|
| Ih paracentral gyrus | Ih fusiform gyrus |
| Ih postcentral gyrus | rh precentral gyrus |
| rh inferior parietal lobule | rh precuneus |
| rh bank of the superior temporal sulcus | rh insula |
| Ih hippocampus | rh lingual gyrus |
| rh hippocampus | rh entorhinal |
| rh amygdala |
HC – Healthy comparison, LLD – Late-life depressed
Figure 4.
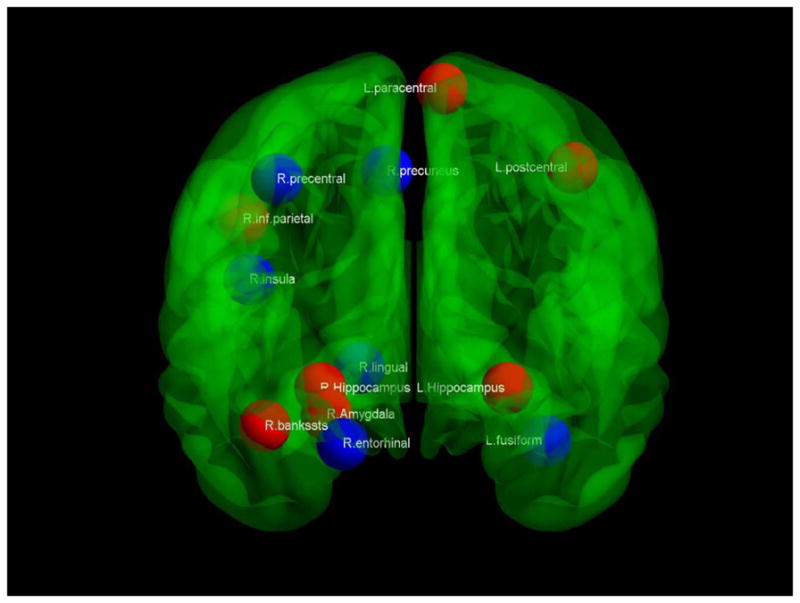
Hub differences. Coronal view of a transparent brain with hubs that are stronger in healthy comparison subjects indicated in red, while stronger hubs in late-life depressed subjects are in blue
Network Resilience
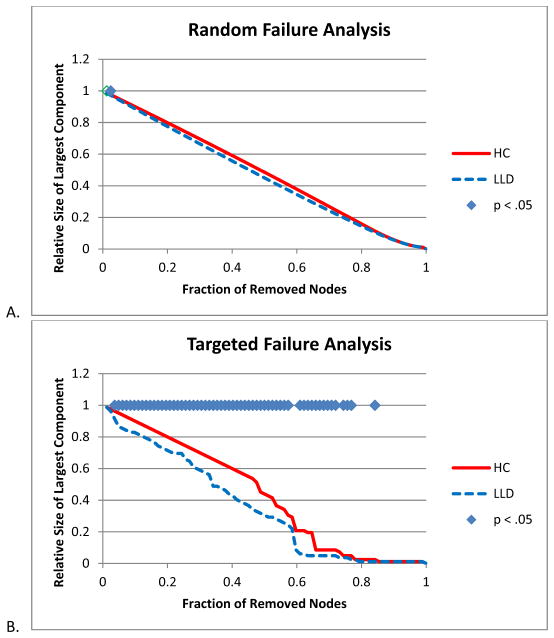
While HC and LLD networks did not differ when nodes were removed randomly (Figure 5A), there was a significant difference between network resilience when nodes were removed in order of influence (Figure 5B). To further explore such significant group differences, networks were constructed controlling for the presence of WMH. Differences in network resilience were present to a lesser extent and were no longer statistically significant (Figure 5C).
Figure 5.
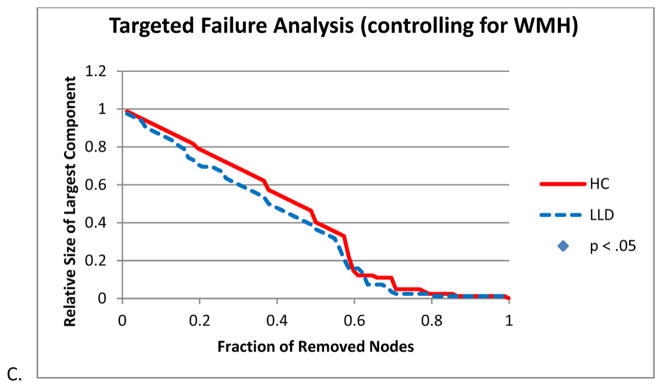
Network resilience. A. Random Failure Analysis B. Targeted Failure Analysis C. Targeted Failure Analysis controlling for white matter hypointensities (WMH). Significance was established if the absolute difference between groups was greater than 95% of the differences observed in 1000 resampled groups (p < .05).
Conclusions
Using graph theory-based network analytical techniques, we have shown that LLD networks demonstrate stronger connection strengths, preserved small-world networks but with a tendency towards higher clustering coefficients and path lengths, and lower global efficiencies compared to HC networks. In addition, LLD networks have altered network influence in limbic and default mode network regions and lower resilience against failure than may be partially explained by WMH burden.
Interregional Volume Correlations
Stronger correlation strengths seen in LLD networks may be related to compensation for disrupted pathways or the relatively novel notion of “hyperconnectivity”, which has been described in a number of pathological conditions, such as schizophrenia and autism (11,31). Stronger correlation strengths in LLD may also be related to more consistent volume loss. However, the correlations matrices were constructed controlling for intracranial volume which may mitigate this influence. The stronger correlations in LLD also reflected positive correlations where HC subjects had negative correlations. The negative correlations are possibly related to anticorrelated networks often reported in fMRI studies, thus positive correlations in LLD may indicate a failure to segregate competing neuronal processes (18). Despite most studies showing lower fractional anisotropy (2,9,48) (FA) or magnetization transfer ratios (19,28) (MTR) in LLD, indicating findings that may predict lower correlation strengths, several depression studies using a number of different imaging modalities have demonstrated increased connectivity. Two DTI studies by Taylor et al (42,43) showed that treatmentresistant LLD patients had higher FA in frontal regions at baseline and lower reductions in anterior cingulate FA after one year. Additionally, in a study by Zhang et al (50), younger MDD patients had significantly increased connectivity, particularly in long-distance connections that linked lobes. This data across the lifespan is in line with ours showing that the specific correlations that were stronger in LLD crossed hemispheres and/or lobes. Less consistent, however, was the single correlation that was significantly lower in LLD represented a local connection between left prefrontal regions.
In studies focused exclusively on LLD, it has been shown that increased cortical-subcortical connectivity is present compared to non-depressed controls; for example in a resting-state functional MRI (rs-fMRI) study by Kenny et al (25). Likewise, PET studies have revealed increased glucose metabolism in bilateral superior frontal gyrus, precuneus, and inferior parietal lobule(41). More recently, a rs-fMRI study by Sheline et al (38) identified a “dorsal nexus”, located in the dorsomedial prefrontal cortex, intersected by three resting-state networks with increased activity in depression. Activity of the dorsal nexus also positively correlated with depression severity. It has been suggested that this region may serve as a therapeutic target for stimulation-based treatments like deep brain stimulation (DBS). Of note, in addition to the global correlation differences observed in the present study, the specific interregional differences occurred between brain areas involved the default mode network (precuneus, superior frontal cortex), affective networks (entorhinal cortex, superior temporal lobe), and regions that bridge these networks (isthmus of the cingulate). In summary, our results are consistent with growing evidence that connectivity in depression may be characterized by hyperactivity and disruption of these circuits may have therapeutic benefits.
Small-World Network Properties
Across a range of network densities, there was a tendency for LLD networks to have higher gammas (normalized clustering coefficient), higher lambdas (normalized path length) and lower global efficiencies relative to comparison subjects. A similar pattern has been recently reported in a study demonstrating lower global efficiencies and increased path lengths in remitted geriatric depression patients (3). It has been hypothesized that the ideal structure of a network exhibits small-world architecture characterized by high clustering coefficients and low path length s(44). The pattern of higher clustering coefficients and higher path lengths thus represents an aberration of the optimal organization of a network. While these network parameters may be difficult to interpret without clinical or cognitive correlates, this pattern has been observed in disease states such as Alzheimer’s disease (AD). In He et al, the authors demonstrated that AD networks were characterized by higher clustering coefficients and higher path lengths (22). Furthermore, in a subsequent DTI study, in AD networks, higher path lengths were associated with worsening performance on the California Verbal Learning Task (CVLT), while global efficiency was positively associated with CVLT performance (32). This suggests that, in the case of AD, measures like path length and global efficiency may characterize how network disorganization can impact cognitive function associated with disease processes. LLD networks demonstrated altered network influence in regions comprising the limbic systems and the default mode network. There have been a number of studies demonstrating altered functional connectivity of these systems in LLD. For example, in a resting-state fMRI study, Wu and colleagues demonstrated decreased subgenual anterior cingulate connectivity and increased dorsomedial and orbitofrontal connectivity in LLD (47). There have been interesting clinical correlates found in a recent PET study that showed, in LLD patients, citalopram reduced cerebral metabolism in the regions that overlapped with significant hub regions found in the present study, namely medial temporal lobe, precuneus, and amygdala (12). Given that our patient sample is unmedicated, our results suggest that altered network influence may be reflected in abnormal elevations in cerebral metabolism.
Network Resilience
Results of our study also revealed that LLD networks were less resilient compared to healthy comparison networks. This pattern has been exhibited in neurological diseases such as temporal lobe epilepsy and Alzheimer’s disease (7,22). In addition, He et al found that both local and global network efficiencies decreased with increasing total white matter lesion load (23). Loss of network resilience has been hypothesized to be related to deficits in parallel organization due to underlying disease processes. This is likely to be valid for the present study as well since our results demonstrated that the impairments in network resilience were attenuated when controlling for WMH. Thus, in LLD, it appears that impairments in network resilience may be, at least in part, due to disruptions of the corticalsubcortical networks by WMH.
Limitations
The results presented in this study must be interpreted in the context of a few limitations. First, using structural covariance to construct the network depends on interregional correlations, thus collapsing individual data to a single network representing the entire subject group. This limits the ability to correlate specific network metrics with individual clinical or cognitive characteristics. In addition, white matter hyperintensities were detected by the automated algorithm on T1 images as hypointensities. This is not as sensitive and specific as methods that use T2 FLAIR images to measure WMH. However, controlling for our WMH measure was sensitive enough to attenuate impaired network resilience observed in LLD. Finally, LLD subjects represented a heterogeneous sample of late-onset and earlyonset LLD, thus subtle differences dependent on depression subtypes could not be ascertained. Despite these limitations, we are able to demonstrate network-level differences based on structural connectivity in LLD that are consistent with findings from published functional connectivity analyses.
Conclusion
In summary, the novel application of graph theory-based connectivity analysis reveals that corticalsubcortical network properties are altered in late-life depression and may reflect the underlying neuroanatomical substrates of the disease. These network properties are characterized by stronger connection strengths and altered small-world characteristics which contribute to impaired network efficiency and resiliency. Future studies using DTI to construct structural networks and functional connectivity analysis from rs-fMRI studies will help elucidate the clinical and cognitive correlates of these altered network properties in late-life depression and provide possible targets for therapies that modulate the activity of these networks.
Supplementary Material
Acknowledgments
I would like to thank Drs. K. Luan Phan and Christopher Abbott for their helpful comments on this manuscript
Footnotes
Portions of this paper have been presented at the Annual Meeting of the International College of Geriatric Psychoneuropharmacology at Irvine, California on November 2, 2011
Publisher's Disclaimer: This is a PDF file of an unedited manuscript that has been accepted for publication. As a service to our customers we are providing this early version of the manuscript. The manuscript will undergo copyediting, typesetting, and review of the resulting proof before it is published in its final citable form. Please note that during the production process errorsmaybe discovered which could affect the content, and all legal disclaimers that apply to the journal pertain.
Reference List
- 1.Alexopoulos GS. Depression in the elderly. Lancet. 2005;365 (9475):1961–1970. doi: 10.1016/S0140-6736(05)66665-2. [DOI] [PubMed] [Google Scholar]
- 2.Alexopoulos GS, Kiosses DN, Choi SJ, et al. Frontal white matter microstructure and treatment response of late-life depression: a preliminary study. Am J Psychiatry. 2002;159 (11):1929–1932. doi: 10.1176/appi.ajp.159.11.1929. [DOI] [PubMed] [Google Scholar]
- 3.Bai F, Shu N, Yuan Y, et al. Topologically Convergent and Divergent Structural Connectivity Patterns between Patients with Remitted Geriatric Depression and Amnestic Mild Cognitive Impairment. J Neurosci. 2012;32 (12):4307–4318. doi: 10.1523/JNEUROSCI.5061-11.2012. [DOI] [PMC free article] [PubMed] [Google Scholar]
- 4.Bassett DS, Bullmore E, Verchinski BA, et al. Hierarchical organization of human cortical networks in health and schizophrenia. J Neurosci. 2008;28 (37):9239–9248. doi: 10.1523/JNEUROSCI.1929-08.2008. [DOI] [PMC free article] [PubMed] [Google Scholar]
- 5.Beck AT, Steer RA, Brown GK. Manual for the Beck Depression Inventory-II. San Antonio, TX: The Psychological Corporation; 1996. [Google Scholar]
- 6.Benjamini Y, Hochberg Y. Controlling the False Discovery Rate - A Practical and Powerful Approach to Multiple Testing. Journal of the Royal Statistical Society Series B-Methodological. 1995;57 (1):289– 300. [Google Scholar]
- 7.Bernhardt BC, Chen Z, He Y, et al. Graph-theoretical analysis reveals disrupted small-world organization of cortical thickness correlation networks in temporal lobe epilepsy. Cereb Cortex. 2011;21 (9):2147– 2157. doi: 10.1093/cercor/bhq291. [DOI] [PubMed] [Google Scholar]
- 8.Bullmore ET, Suckling J, Overmeyer S, et al. Global, voxel, and cluster tests, by theory and permutation, for a difference between two groups of structural MR images of the brain. IEEE Trans Med Imaging. 1999;18 (1):32–42. doi: 10.1109/42.750253. [DOI] [PubMed] [Google Scholar]
- 9.Dalby RB, Frandsen J, Chakravarty MM, et al. Depression severity is correlated to the integrity of white matter fiber tracts in late-onset major depression. Psychiatry Res. 2010;184 (1):38–48. doi: 10.1016/j.pscychresns.2010.06.008. [DOI] [PubMed] [Google Scholar]
- 10.Dale AM, Fischl B, Sereno MI. Cortical surface-based analysis. I. Segmentation and surface reconstruction. Neuroimage. 1999;9 (2):179–194. doi: 10.1006/nimg.1998.0395. [DOI] [PubMed] [Google Scholar]
- 11.Di MA, Kelly C, Grzadzinski R, et al. Aberrant striatal functional connectivity in children with autism. Biol Psychiatry. 2011;69 (9):847–856. doi: 10.1016/j.biopsych.2010.10.029. [DOI] [PMC free article] [PubMed] [Google Scholar]
- 12.Diaconescu AO, Kramer E, Hermann C, et al. Distinct functional networks associated with improvement of affective symptoms and cognitive function during citalopram treatment in geriatric depression. Hum Brain Mapp. 2011;32 (10):1677–1691. doi: 10.1002/hbm.21135. [DOI] [PMC free article] [PubMed] [Google Scholar]
- 13.Fischl B, Dale AM. Measuring the thickness of the human cerebral cortex from magnetic resonance images. Proc Natl Acad Sci U S A. 2000;97 (20):11050–11055. doi: 10.1073/pnas.200033797. [DOI] [PMC free article] [PubMed] [Google Scholar]
- 14.Fischl B, Liu A, Dale AM. Automated manifold surgery: constructing geometrically accurate and topologically correct models of the human cerebral cortex. IEEE Trans Med Imaging. 2001;20 (1):70–80. doi: 10.1109/42.906426. [DOI] [PubMed] [Google Scholar]
- 15.Fischl B, Salat DH, Busa E, et al. Whole brain segmentation: automated labeling of neuroanatomical structures in the human brain. Neuron. 2002;33 (3):341–355. doi: 10.1016/s0896-6273(02)00569-x. [DOI] [PubMed] [Google Scholar]
- 16.Fischl B, van der KA, Destrieux C, et al. Automatically parcellating the human cerebral cortex. Cereb Cortex. 2004;14 (1):11–22. doi: 10.1093/cercor/bhg087. [DOI] [PubMed] [Google Scholar]
- 17.Folstein MF, Folstein SE, McHugh PR. “Mini-mental state” A practical method for grading the cognitive state of patients for the clinician. J Psychiatr Res. 1975;12 (3):189–198. doi: 10.1016/0022-3956(75)90026-6. [DOI] [PubMed] [Google Scholar]
- 18.Fox MD, Snyder AZ, Vincent JL, et al. The human brain is intrinsically organized into dynamic, anticorrelated functional networks. Proc Natl Acad Sci U S A. 2005;102 (27):9673–9678. doi: 10.1073/pnas.0504136102. [DOI] [PMC free article] [PubMed] [Google Scholar]
- 19.Gunning-Dixon FM, Hoptman MJ, Lim KO, et al. Macromolecular white matter abnormalities in geriatric depression: a magnetization transfer imaging study. Am J Geriatr Psychiatry. 2008;16 (4):255–262. doi: 10.1097/JGP.0b013e3181602a66. [DOI] [PubMed] [Google Scholar]
- 20.Hamilton M. A rating scale for depression. J Neurol Neurosurg Psychiatry. 1960;23:56–62. doi: 10.1136/jnnp.23.1.56. [DOI] [PMC free article] [PubMed] [Google Scholar]
- 21.Hanggi J, Wotruba D, Jancke L. Globally altered structural brain network topology in grapheme-color synesthesia. J Neurosci. 2011;31 (15):5816–5828. doi: 10.1523/JNEUROSCI.0964-10.2011. [DOI] [PMC free article] [PubMed] [Google Scholar]
- 22.He Y, Chen Z, Evans A. Structural insights into aberrant topological patterns of large-scale cortical networks in Alzheimer’s disease. J Neurosci. 2008;28 (18):4756–4766. doi: 10.1523/JNEUROSCI.0141-08.2008. [DOI] [PMC free article] [PubMed] [Google Scholar]
- 23.He Y, Dagher A, Chen Z, et al. Impaired small-world efficiency in structural cortical networks in multiple sclerosis associated with white matter lesion load. Brain. 2009;132 (Pt 12):3366–3379. doi: 10.1093/brain/awp089. [DOI] [PMC free article] [PubMed] [Google Scholar]
- 24.Hoptman MJ, Gunning-Dixon FM, Murphy CF, et al. Structural neuroimaging research methods in geriatric depression. Am J Geriatr Psychiatry. 2006;14 (10):812–822. doi: 10.1097/01.JGP.0000238588.34205.bd. [DOI] [PMC free article] [PubMed] [Google Scholar]
- 25.Kenny ER, O’Brien JT, Cousins DA, et al. Functional connectivity in late-life depression using resting-state functional magnetic resonance imaging. Am J Geriatr Psychiatry. 2010;18 (7):643–651. doi: 10.1097/JGP.0b013e3181cabd0e. [DOI] [PubMed] [Google Scholar]
- 26.Kumar A, Cook IA. White matter injury, neural connectivity and the pathophysiology of psychiatric disorders. Dev Neurosci. 2002;24 (4):255–261. doi: 10.1159/000066746. [DOI] [PubMed] [Google Scholar]
- 27.Kumar A, Gupta R, Thomas A, et al. Focal subcortical biophysical abnormalities in patients diagnosed with type 2 diabetes and depression. Arch Gen Psychiatry. 2009;66 (3):324–330. doi: 10.1001/archgenpsychiatry.2008.548. [DOI] [PubMed] [Google Scholar]
- 28.Kumar A, Gupta RC, Albert TM, et al. Biophysical changes in normal-appearing white matter and subcortical nuclei in late-life major depression detected using magnetization transfer. Psychiatry Res. 2004;130 (2):131–140. doi: 10.1016/j.pscychresns.2003.12.002. [DOI] [PubMed] [Google Scholar]
- 29.Lerch JP, Worsley K, Shaw WP, et al. Mapping anatomical correlations across cerebral cortex (MACACC) using cortical thickness from MRI. Neuroimage. 2006;31 (3):993–1003. doi: 10.1016/j.neuroimage.2006.01.042. [DOI] [PubMed] [Google Scholar]
- 30.Levene H. Contributions to Probability and Statistics: Essays in Honor of Harold Hotelling. Stanford University Press; 1960. Robust tests for equality of variances; pp. 278–292. [Google Scholar]
- 31.Liu H, Kaneko Y, Ouyang X, et al. Schizophrenic patients and their unaffected siblings share increased resting-state connectivity in the task-negative network but not its anticorrelated task-positive network. Schizophr Bull. 2012;38 (2):285–294. doi: 10.1093/schbul/sbq074. [DOI] [PMC free article] [PubMed] [Google Scholar]
- 32.Lo CY, Wang PN, Chou KH, et al. Diffusion tensor tractography reveals abnormal topological organization in structural cortical networks in Alzheimer’s disease. J Neurosci. 2010;30 (50):16876–16885. doi: 10.1523/JNEUROSCI.4136-10.2010. [DOI] [PMC free article] [PubMed] [Google Scholar]
- 33.Mechelli A, Friston KJ, Frackowiak RS, et al. Structural covariance in the human cortex. J Neurosci. 2005;25 (36):8303–8310. doi: 10.1523/JNEUROSCI.0357-05.2005. [DOI] [PMC free article] [PubMed] [Google Scholar]
- 34.Naismith SL, Norrie LM, Mowszowski L, et al. The neurobiology of depression in later-life: clinical, neuropsychological, neuroimaging and pathophysiological features. Prog Neurobiol. 2012;98 (1):99–143. doi: 10.1016/j.pneurobio.2012.05.009. [DOI] [PubMed] [Google Scholar]
- 35.Rubinov M, Sporns O. Complex network measures of brain connectivity: uses and interpretations. Neuroimage. 2010;52 (3):1059–1069. doi: 10.1016/j.neuroimage.2009.10.003. [DOI] [PubMed] [Google Scholar]
- 36.Segonne F, Dale AM, Busa E, et al. A hybrid approach to the skull stripping problem in MRI. Neuroimage. 2004;22 (3):1060–1075. doi: 10.1016/j.neuroimage.2004.03.032. [DOI] [PubMed] [Google Scholar]
- 37.Segonne F, Pacheco J, Fischl B. Geometrically accurate topology-correction of cortical surfaces using nonseparating loops. IEEE Trans Med Imaging. 2007;26 (4):518–529. doi: 10.1109/TMI.2006.887364. [DOI] [PubMed] [Google Scholar]
- 38.Sheline YI, Price JL, Yan Z, et al. Resting-state functional MRI in depression unmasks increased connectivity between networks via the dorsal nexus. Proc Natl Acad Sci U S A. 2010;107 (24):11020–11025. doi: 10.1073/pnas.1000446107. [DOI] [PMC free article] [PubMed] [Google Scholar]
- 39.Sled JG, Zijdenbos AP, Evans AC. A nonparametric method for automatic correction of intensity nonuniformity in MRI data. IEEE Trans Med Imaging. 1998;17 (1):87–97. doi: 10.1109/42.668698. [DOI] [PubMed] [Google Scholar]
- 40.Smith EE, Salat DH, Jeng J, et al. Correlations between MRI white matter lesion location and executive function and episodic memory. Neurology. 2011;76 (17):1492–1499. doi: 10.1212/WNL.0b013e318217e7c8. [DOI] [PMC free article] [PubMed] [Google Scholar]
- 41.Smith GS, Kramer E, Ma Y, et al. The functional neuroanatomy of geriatric depression. Int J Geriatr Psychiatry. 2009;24 (8):798–808. doi: 10.1002/gps.2185. [DOI] [PMC free article] [PubMed] [Google Scholar]
- 42.Taylor WD, Kuchibhatla M, Payne ME, et al. Frontal white matter anisotropy and antidepressant remission in late-life depression. PLoS One. 2008;3 (9):e3267. doi: 10.1371/journal.pone.0003267. [DOI] [PMC free article] [PubMed] [Google Scholar]
- 43.Taylor WD, Macfall JR, Boyd B, et al. One-year change in anterior cingulate cortex white matter microstructure: relationship with late-life depression outcomes. Am J Geriatr Psychiatry. 2011;19 (1):43–52. doi: 10.1097/JGP.0b013e3181e70cec. [DOI] [PMC free article] [PubMed] [Google Scholar]
- 44.Watts DJ, Strogatz SH. Collective dynamics of ‘small-world’ networks. Nature. 1998;393 (6684):440–442. doi: 10.1038/30918. [DOI] [PubMed] [Google Scholar]
- 45.Wechsler D. Wechsler Test of Adult Reading. San Antonio, TX: Psychological Corporation; 1997. [Google Scholar]
- 46.Wen W, Zhu W, He Y, et al. Discrete neuroanatomical networks are associated with specific cognitive abilities in old age. J Neurosci. 2011;31 (4):1204–1212. doi: 10.1523/JNEUROSCI.4085-10.2011. [DOI] [PMC free article] [PubMed] [Google Scholar]
- 47.Wu M, Andreescu C, Butters MA, et al. Default-mode network connectivity and white matter burden in late-life depression. Psychiatry Res. 2011;194 (1):39–46. doi: 10.1016/j.pscychresns.2011.04.003. [DOI] [PMC free article] [PubMed] [Google Scholar]
- 48.Yang Q, Huang X, Hong N, et al. White matter microstructural abnormalities in late-life depression. Int Psychogeriatr. 2007;19 (4):757–766. doi: 10.1017/S1041610207004875. [DOI] [PubMed] [Google Scholar]
- 49.Yesavage JA, Brink TL, Rose TL, et al. Development and validation of a geriatric depression screening scale: a preliminary report. J Psychiatr Res. 1982;17 (1):37–49. doi: 10.1016/0022-3956(82)90033-4. [DOI] [PubMed] [Google Scholar]
- 50.Zhang J, Wang J, Wu Q, et al. Disrupted brain connectivity networks in drug-naive, first-episode major depressive disorder. Biol Psychiatry. 2011;70 (4):334–342. doi: 10.1016/j.biopsych.2011.05.018. [DOI] [PubMed] [Google Scholar]
Associated Data
This section collects any data citations, data availability statements, or supplementary materials included in this article.


