

Abstract
Introduction
Efficacy describes the property of a ligand that enables the receptor to change its behavior towards the host cell, while biased agonism defines the ability of a ligand to differentially activate some of the vectorial pathways over others mediated through the receptor. However, little is known about the molecular basis defining the efficacy of ligands at G protein-coupled receptors. Here we characterize the biased agonism and cell phenotypic efficacy of seven agonists at the endogenous muscarinic M3 receptors in six different cell lines including HT-29, PC-3, HeLa, SF268, CCRF-CEM and HCT-15 cells.
Methods
Quantitative real-time PCR and multiple label-free whole cell dynamic mass redistribution (DMR) assays were used to determine the functional muscarinic receptors in each cell line. DMR pathway deconvolution assay was used to determine the pathway biased activity of the muscarinic agonists. Operational agonism model was used to quantify the pathway bias, while macro-kinetic data reported in literature was used to analyze the biochemical mechanism of action of these agonists.
Results
Quantitative real-time PCR and ligand pharmacology studies showed that all the native cell lines endogenously express functional M3 receptors. Furthermore, different agonists triggered distinct DMR signals in a specific cell line as well as in different cell lines. DMR pathway deconvolution using known G protein modulators revealed that the M3 receptor in all the six cell lines signals through multiple G protein-mediated pathways, and certain agonists display biased agonism in a cell line-dependent manner. The whole cell efficacy and potency of these agonists were found to be sensitive to the assay time as well as the cell background. Correlation analysis suggested that the whole cell efficacy of agonists is correlated well with their macro-dissociation rate constants.
Discussion
This study implicates that the endogenous M3 receptors are coupled to multiple pathways, and the muscarinic agonists can display distinct biased agonism and whole cell phenotypic efficacy.
Keywords: Biased agonism, Drug residence time, Dynamic mass redistribution, G protein-coupled receptor, Efficacy, Muscarinic M3 receptor
1. Introduction
Efficacy and affinity, the two hallmarks of drug pharmacology, are considered to be totally independent properties of drugs (Onaran & Costa, 2012). Affinity is the ability of the drug to bind to a receptor, while efficacy is the ability of the drug to change the behavior of the receptor towards the host cell. The concept of ‘efficacy’ has evolved over the past decades, owing to the increasing resolution of pharmacological assays to characterize the drug pharmacology. This is the best exemplified by drugs at G protein-coupled receptors (GPCRs), a family of receptors that are the master regulator of a wide range of physiological processes of cells and tissues (Neves, Ram, & Iyengar, 2002). As a family of allosteric proteins designed to transmit information GPCRs can display rich behaviors, ranging from pleiotropic coupling with multiple G proteins to receptor internalization, oligomerization, desensitization, and interaction with distinct membrane guest proteins (Kenakin & Miller, 2010). As a result, efficacy becomes vectorial (positive and negative cell activation) and pluridimensional (assay readout-dependent), instead of being linear in controlling different receptor behaviors (Galandrin & Bouvier, 2006; Kenakin, 2005, 2009). To date, the molecular mechanism of efficacy is mostly explored in terms of ‘active state(s)’, a conformation that triggers cellular response or a change in the behavior of the receptor towards the host cell (Kahsai et al., 2011; Liu, Horst, Katritch, Stevens, & Wuthrich, 2012; Sauliere et al., 2012).
In the recent years, amassing data suggest that label-free biosensor-enabled dynamic mass redistribution (DMR) assay is capable of translating an agonist-activated signal transduction process into a real-time whole cell phenotypic response under non-equilibrium condition (Fang, 2011). The rapid onset DMR responses of many agonists for almost all GPCRs tested to date suggest that receptor signaling proceeds right after agonist binding but long before reaching equilibrium binding (Fang, Li, & Ferrie, 2007); and some, but not all, of signaling events downstream the activated receptor can continue propagating after agonist removal (Goral, Jin et al., 2011; Goral, Wu, Sun, & Fang, 2011). Furthermore, the ability of several antagonists to block endogenous M3 receptor signaling in HT-29 cells has been recently found to correlate with their residence time (the reciprocal of Koff) (Deng, Wang, Su, & Fang, 2012). These studies suggest the important role of drug residence time in GPCR signaling, and thus ligand efficacy. We herein characterize the signaling pathways of the endogenous M3 receptors in six different cell lines, and deconvolute the biased agonism and cell phenotypic efficacy of seven agonists in these cell lines (Fig. 1). We found that these agonists displayed time- and cell line-dependent efficacy and potency; and their whole cell phenotypic efficacy is correlated well with their macro-dissociation rate constants.
Fig. 1.

Chemical structures of seven muscarinic receptor agonists examined.
2. Materials and methods
2.1. Materials
Atropine, bethanechol chloride, cholera toxin (CTx), methacholine chloride, and pertussis toxin (PTx) were purchased from Sigma Chemical Co. (St. Louis, MO, USA). Acetylcholine chloride, carbachol (carbamoylcholine chloride), gallamine triethiodide, ipratropium bromide, McN-A-343, oxotremorine sesquifumarate, oxotremorine M, and pilocarpine hydrochloride were obtained from Tocris Bioscience Co. (St. Louis, MO, USA). Tiotropium was purchased from Santa Cruz Biotechnology Inc. (Santa Cruz, CA). Gαq inhibiting component (QIC), a Gαq-specific inhibitor structurally related to YM-254890 (Schröder et al., 2010), was obtained from Prof. Evi Kostenis (University of Bonn). Except for QIC which was stocked in 50 mM, all other compounds were stocked in 100 mM. Acetylcholine was dissolved in water, while all other drugs were prepared in dimethyl sulfoxide (DMSO). Before use, all compounds were freshly diluted using the assay buffer (1 times Hank’s balanced salt solution (HBSS) buffer, 20 mM Hepes, pH 7.1) to the indicated concentrations. Both Epic® 384-well biosensor cell culture compatible and fibronectin-coated microplates were obtained from Corning Incorporated (Corning, NY, USA).
2.2. Cell culture
All six cell lines were obtained from American Type Cell Culture (Manassas, VA, USA). They are human colorectal adenocarcinoma cell line HT-29, human colorectal carcinoma cell line HCT-15, human epitheloid cervix carcinoma cell line HeLa, human glioblastoma cell line SF268, human prostate cancer cell line PC3, and human T cell lymphoblast-like cell line CCRF-CEM. Except for CCRF-CEM which is a suspension cell line, the rest are anchorage dependent. These cells were passaged at 37 °C with 5% CO2 using the following complete medium: McCoy’s 5A medium for HT-29, Eagle’s Minimum Essential Medium for HeLa, F-12K Medium for PC3, and RPMI 1640 medium for HCT-15, SF268 and CCRF-CEM. All media were supplemented with 10% fetal bovine serum, 4.5 g/l glucose, 2 mM glutamine, 100 μg/ml penicillin and streptomycin. All anchorage-dependent cells were passed with trypsin/ethylene-diaminetetraacetic acid when approaching 90% confluence to provide new maintenance culture on T-75 flasks and experimental culture on the biosensor microplates. For DMR assays, both the cell seeding density and biosensor surface were optimized for each cell line so that all cells reached ~95% confluency after overnight culture (~20 h). The fibronectin coated biosensor plates were used for HCT-15, SF268 and CCRF-CEM cells, while the cell culture compatible biosensor plates were used for the remaining cell lines. The optimal seeding densities were found to be 30 K, 32 K, 25 K, 15 K, 20 K and 40 K per well for HCT-15, HT-29, HeLa, SF268, PC3 and CCRF-CEM cells, respectively. The optimal seeding densities were 25 K, 15 K, 25 K, 25 K, and 21 K for A431, A498, A549, DU145, and HepG2 cells, respectively.
2.3. Quantitative real-time PCR (qRT-PCR)
Total RNA was extracted from the respective cell line using an RNeasy mini kit (Qiagen, Cat#74104). On-column DNase digestion was performed using RNase-free DNase set (Qiagen, Cat#79254) to eliminate genomic DNA contamination. The concentration and quality of total RNA were determined using a Nanodrop 8000 (Thermo Scientific). Customized PCR-array plates for 352 G protein-coupled receptor (GPCR) genes and reagents were ordered from SABiosciences (Qiagen, Valencia, CA). About 1 μg total RNA was used for each 96-well PCR-array. The PCR-array was performed on an ABI 7300 Real-Time PCR System following the manufacturer’s instructions.
2.4. DMR assays
All DMR assays were performed in microplate under the persistent stimulation condition, where cells are exposed to a compound throughout the assays (Deng et al., 2012). These assays were performed using conventional Epic® system (Corning Incorporated), which is a wavelength interrogation reader system tailored for resonant waveguide grating (RWG) biosensors in microplates (Fang, Ferrie, Fontaine, Mauro, & Balakrishnan, 2006; Li, Ferrie, & Fang, 2006). This system consists of a temperature-control unit, an optical detection unit, and an on-board liquid handling unit operated by robotics. The detection unit is centered on integrated fiber optics, and enables kinetic measures of cellular responses with a time interval of about 15 s. For toxin treatment, cells were pretreated with 100 ng ml−1 PTx for overnight, or 400 ng ml−1 CTx for 3 h, or 1 μM QIC for 3 h, all in the complete medium at 37 °C/5% CO2. Afterwards, the confluent cells were washed twice and maintained with the assay buffer (HBSS) and then incubated within the reader system for about 1 h. Antagonist pretreatment was performed in HBSS for 1 h. After a 2-min baseline was established, agonist solutions were transferred into the biosensor wells using the on-board liquid handling device, and the cell responses were recorded in real time. All studies were carried out with duplicates and two independent measurements (four replicates in total) unless specifically mentioned.
2.5. Data analysis
All experimental data were analyzed by using GraphPad Prism 5.0 (GraphPad Software Inc., San Diego, CA, USA). The EC50 values and maxima were obtained by fitting the dose DMR response curves with nonlinear regression. The relative maxima of each ligand were obtained by normalizing to the maxima of acetylcholine in the respective cell line. One-way ANOVA followed by Tukey’s multiple comparison test was used to determine the significance of the difference among the DMR responses of different agonists in a respective cell line.
3. Results
3.1. Expression patterns of endogenous muscarinic receptors in six native cell lines
For label-free cell phenotypic profiling of a panel of seven muscarinic receptor agonists, we first examined the expression patterns of endogenous muscarinic receptors across 25 different cell lines using quantitative RT-PCR. Results showed that only six cell lines endogenously express predominantly M3 receptors at the mRNA level (Table 1). These cell lines were the colon cancer cell lines HT-29 and HCT-15, the prostate cancer cell line PC3, the epitheloid cervix carcinoma cell line HeLa, the glioblastoma cell line SF268, and the T cell leukemia cell line CCRF-CEM. Using three control genes as controls, the relative mRNA level for the M3 receptors was found to be the lowest in HeLa and SF268 cells and the highest in PC3 cells.
Table 1.
Cycle threshold values of endogenous muscarinic receptors and control genes obtained using quantitative real time PCR of mRNA samples.
| Cell line | CHRM1 | CHRM2 | CHRM3 | CHRM4 | CHRM5 | HPRT1 | ACTB | GAPDH |
|---|---|---|---|---|---|---|---|---|
| HCT15 | 30.8 | 34.3 | 26.1 | 30.4 | 32.1 | 21.6 ± 0.3a | 17.5 ± 0.2 | 16.1 ± 0.2 |
| HT29 | 38.1 | 35.0 | 26.0 | 32.7 | > 40 | 22.0 ± 0.3 | 17.4 ± 0.3 | 15.9 ± 0.2 |
| CCRF-CEM | 36.1 | 35.0 | 26.2 | 31.3 | 34.3 | 21.1 ± 0.2 | 16.3 ± 0.3 | 15.2 ± 0.2 |
| HeLa | 38.4 | 35.8 | 28.6 | 31.5 | 32.0 | 20.6 ± 0.2 | 15.9 ± 0.2 | 15.4 ± 0.3 |
| PC3 | 35.0 | 35.4 | 23.1 | 31.7 | 31.6 | 22.8 ± 0.2 | 18.1 ± 0.3 | 16.2 ± 0.2 |
| SF268 | 39.2 | 32.7 | 28.0 | 32.1 | 32.8 | 20.3 ± 0.4 | 15.2 ± 0.4 | 14.3 ± 0.3 |
| A431 | > 40 | 36.9 | >40 | 33.9 | 34.1 | 21.4 ± 0.4 | 17.5 ± 0.3 | 16.8 ± 0.3 |
| A549 | 39.7 | 34.1 | 34.4 | 31.3 | 32.4 | 20.7 ± 0.2 | 16.3 ± 0.3 | 15.1 ± 0.2 |
| DU145 | 37.4 | 34.7 | 36.4 | 32.9 | 31.2 | 21.2 ± 0.2 | 17.0 ± 0.2 | 15.0 ± 0.2 |
| HUVEC | > 40 | 33.9 | 38.7 | 31.3 | 32.5 | 22.0 ± 0.4 | 17.0 ± 0.3 | 16.1 ± 0.3 |
| HepG2 | > 40 | 34.3 | 37.8 | 30.7 | 31.0 | 21.5 ± 0.1 | 17.3 ± 0.3 | 15.6 ± 0.4 |
Mean ± s.d. of four replicates.
3.2. Characterization of functional muscarinic receptor(s) in the six cell lines
Next, we determined the functional muscarinic receptor subtype(s) in these cell lines using multiple DMR assays. First, DMR agonism assay showed that 16 μM acetylcholine, the non-selective muscarinic receptor native agonist, triggered detectable DMR but with distinct characteristics in the six cell lines (Fig. 2a). In contrast, McN-A-343, a M1- and M4-selective bitopic orthosteric/allosteric partial agonist (Mitchelson, 2012; Valant et al., 2008), up to 64 μM triggered negligible DMR, identical to the negative control (buffer), in the six cell lines (Fig. 2b), suggesting that there is no or little DMR response originating from endogenous M1 or M4 receptors in all the six cell lines. Second, DMR antagonist assay showed that gallamine, a M2-selective allosteric antagonist (Huang, Prilla, Mohr, & Ellis, 2005), up to 64 μM only slightly suppressed the early signal (i.e., decreased the kinetics) of the DMR of 4 μM acetylcholine in HCT-15 cells, but not any other cell lines including SF268 (Fig. 2c), suggesting that there is no or little DMR response originating from endogenous M2 receptors in all the six cell lines. In contrast, the three muscarinic antagonists, atropine, ipratropium, and tiotropium, all dose-dependently blocked the DMR of 4 μM acetylcholine in HCT-15 cells (Fig. 2d), and gave rise to a similar potency rank order across the six cell lines (Table 2). Although these antagonists are non-selective (Casarosa et al., 2009), their potency rank order and inhibition profiles obtained suggest that the acetylcholine DMR is mostly originated from a single muscarinic receptor subtype in all the six cell lines. This is further confirmed by the comparable potency rank order for the panel of seven agonists to desensitize or block the DMR arising from subsequent stimulation with 4 μM acetylcholine (Table 2). Third, DMR pathway deconvolution data showed that the acetylcholine DMR signals in all the six cell lines were primarily resulted from the Gαq pathway (see below). Fourth, agonist profiling of the five M3-negative control cells including A431, A498, A549, Du145 and HepG2 showed that neither 10 μM acetylcholine nor 10 μM oxotremorine M triggered any detectable DMR, suggesting that the DMR assays appear to be only sensitive to endogenous receptors with high or moderate expression levels. Together, these results suggest that the endogenous M3 receptors account primarily for the DMR signals obtained in these cell lines. This was further confirmed by literature mining showing that HT-29 (Kopp et al., 1989; Yang & Frucht, 2000) and PC-3 (Luthin, Wang, Zhou, Dhanasekaran, & Ruggieri, 1997) almost exclusively express the M3 receptor subtype, while HeLa (Nginamau, Maehle, & Jonsson, 2011) and CCRF-CEM (Yoshikawa, Fujii, & Kawashima, 2005) are known to express functional M3 receptors.
Fig. 2.

Characterization of functional muscarinic receptor subtypes in the six native cell lines. (a) The DMR signals of 16 μM acetylcholine in these cell lines; (b) The DMR dose responses of McN-A-343 in HCT-15; (c) The dose-dependent effect of gallamine on the DMR of 4 μM acetylcholine in SF268 (the maximal amplitudes within 10 min, “early P-DMR”, or the amplitudes at 50 min post stimulation) or HCT-15 cells (the amplitudes at 15 min or 50 min post stimulation); (d) The dose-dependent inhibition of three antagonists on the DMR amplitudes at 50 min post stimulation with 4 μM acetylcholine in HCT-15 cells. Data represents mean ± s.d (n = 16 for a, n = 4 for b to d).
Table 2.
The pIC50 values of ligands to block or desensitize the DMR of 4 μM acetylcholine in the six cell lines (n = 4).
| HCT-15 | HT-29 | HeLa | PC-3 | CCRF-CEM | SF268 | |
|---|---|---|---|---|---|---|
| Acetylcholine | 6.65 ± 0.03 | 6.65 ± 0.02 | 6.32 ± 0.13 | 6.48 ± 0.06 | 6.20 ± 0.03 | 6.69 ± 0.06 |
| Oxotremorine M | 6.53 ± 0.04 | 6.29 ± 0.03 | 6.23 ± 0.05 | 6.20 ± 0.04 | 6.31 ± 0.03 | 6.40 ± 0.06 |
| Methacholine | 6.30 ± 0.04 | 6.26 ± 0.02 | 6.04 ± 0.05 | 5.84 ± 0.05 | 6.12 ± 0.06 | 6.53 ± 0.07 |
| Carbachol | 5.71 ± 0.06 | 5.71 ± 0.03 | 5.56 ± 0.06 | 5.50 ± 0.06 | 5.72 ± 0.05 | 5.76 ± 0.05 |
| Oxotremorine | 5.70 ± 0.14 | 5.72 ± 0.08 | 5.94 ± 0.19 | 5.57 ± 0.12 | 5.63 ± 0.07 | 5.70 ± 0.20 |
| Pilocarpine | 4.56 ± 0.14 | 5.11 ± 0.10 | 5.27 ± 0.38 | 4.56 ± 0.08 | 4.50 ± 0.05 | 4.79 ± 0.16 |
| Bethanechol | 4.83 ± 0.13 | 4.33 ± 0.13 | 4.78 ± 0.15 | 4.16 ± 0.10 | 4.45 ± 0.05 | 4.51 ± 0.08 |
| Atropine | 4.74 ± 0.04 | 5.84 ± 0.03 | 6.09 ± 0.26 | 5.72 ± 0.23 | 5.46 ± 0.16 | 4.97 ± 0.15 |
| Ipratropium | 6.21 ± 0.04 | 6.53 ± 0.06 | 6.40 ± 0.10 | 6.91 ± 0.32 | 6.16 ± 0.16 | 6.76 ± 0.12 |
| Tiotropium | 7.76 ± 0.02 | 8.22 ± 0.02 | 8.34 ± 0.09 | 7.66 ± 0.01 | 8.33 ± 0.18 | 8.25 ± 0.04 |
3.3. DMR characteristics of the muscarinic receptor agonists
Next, we compared the DMR characteristics of all seven agonists, each at its 1× EC100, in the six different cell lines. The characteristic DMR of these agonists was summarized in Fig. 3. Several interesting features emerged. First, pilocarpine only displayed weak agonistic activity in HCT-15, PC3 and CCRF-CEM, the three cell lines that have relatively high expression of the M3 receptors at the mRNA level. In contrast, oxotremorine was active in all cell lines except for HeLa, while the remaining agonists were active in all cell lines. Given that the agonistic activity of partial agonists is more sensitive to the receptor expression level (Charlton, 2009), these results are largely in agreement with the mRNA expression level of the M3 receptors in the respective cell line. Second, the maximal DMR signals of different agonists, when being active, shared similar characteristics in a specific cell line; however, a ligand resulted in clearly distinct DMR across different cell lines. Third, except for PC3 cells, the DMR of all agonists, when being active in a specific cell line, generally remains elevated over the assay period (~1 h). Fourth, different agonists displayed a cell line-dependent efficacy. Compared to the maximal responses of acetylcholine, oxotremorine M displayed noticeably higher efficacy in CCRF-CEM, SF268 and HeLa cells, while carbachol gave rise to noticeably lower efficacy in HeLa cells, and methacholine had relatively lower efficacy in PC3 and HeLa cells (Fig. 3, Supplementary Fig. S1). Furthermore, for the three partial agonists including bethanechol, oxotremorine and pilocarpine, all displayed relatively higher efficacy in CCRF-CEM, compared to the other cell lines (Fig. 3, Supplementary Fig. S1). Together, these results suggest that different muscarinic receptor agonists display cell line-dependent potency and efficacy.
Fig. 3.

The real-time DMR of muscarinic receptor agonists in the six different cell lines. The agonist doses, each at its 1× EC100, were 16 μM, 32 μM, 64 μM, 32 μM, 64 μM, 8 μM, and 8 μM in HCT-15 cells (a); 16 μM, 32 μM, 64 μM, 16 μM, 64 μM, 8 μM, and 64 μM in HT-29 cells (b); 16 μM, 8 μM, 32 μM, 32 μM, 32 μM, 32 μM, and 32 μM in HeLa cells (c); 32 μM, 8 μM, 32 μM, 16 μM, 32 μM, 8 μM and 64 μM in SF268 cells (d); 16 μM, 16 μM, 64 μM, 32 μM, 64 μM, 16 μM and 64 μM in PC3 cells (e); 16 μM, 16 μM, 64 μM, 32 μM, 64 μM, 16 μM, and 32 μM in CCRF-CEM cells (f) for oxotremorine M, acetylcholine, carbachol, metacholine, bethanechol, oxotremorine, and pilocarpine, respectively. Data represents mean ± s.d. (n = 16).
3.4. Distinct time-dependent potency of different muscarinic receptor agonists
Next, we analyzed the time dependent potency of different muscarinic receptor agonists only in HTC-15, HT-29, PC3 and CCRF-CEM cells, given that their DMR signals are robust in these cell lines, but not in HeLa and SF268 cells. Nonlinear regression analysis gave rise to a series of time-dependent EC50 values, each at specific time-point post stimulation, for agonists that were active in the respective cell line (Fig. 4). Results showed that different ligands exhibited distinct time-dependent potency changes in different cell lines. In HCT-15 cells carbachol exhibited a relatively small increase in potency over time, while metacholine, acetylcholine and oxotremorine M displayed an initial small decrease in potency, followed by a small increase in potency over time (Fig. 4a). In contrast, the potency of bethanechol showed little change over time, but oxotremorine gave rise to the biggest change in time-dependent potency (Fig. 4b). For the other three cell lines, the potency of carbachol, oxotremorine M, metacholine and acetylcholine generally decreased over time (Fig. 4c, e, and g), while the potency of both bethanechol and oxotremorine exhibited little sensitivity over time in HT-29 or CCRF-CEM cells (Fig. 4d and f, respectively), but displayed an initial increase followed by a decrease in PC3 cells (Fig. 4h).
Fig. 4.

Time-dependent potency of muscarinic receptor agonists in different cell lines. (a, b) HCT-15; (c, d) HT-29; (e, f) CCRF-CEM; (g, h) PC3. Data represents mean ± s.d. (n = 4).
3.5. Cell line-dependent biased agonism of muscarinic agonists
We next examined the biased agonism of muscarinic receptor agonists using the established pathway deconvolution approach (Schröder et al., 2010; Verrier et al., 2011). Here, CTx was used to cause the permanent activation of Gαs by ADP ribosylation of an arginine residue of the protein, while PTx was used to result in the permanent inhibition of Gαi by ADP ribosylation of a cysteine of the protein, and QIC to selectively inhibit Gαq protein. These toxins were used to pretreat the cells before stimulation with a specific muscarinic receptor agonist. Results showed that in HCT-15 cells the acetylcholine DMR was suppressed partially by CTx, or mostly by QIC, or completely by the combination of CTx and QIC, while PTx only slightly slowed down the kinetics of the acetylcholine DMR (Fig. 5a), suggesting that the acetylcholine activated M3 receptors in HCT-15 cells propagate signaling through both Gαq and Gαs pathways. Almost identical trend was found for oxotremorine M (Fig. 5b), carbachol (Fig. 5c), and methacholine (Fig. 5d), and to less extent, bethanechol (Fig. 5e). The DMR of oxotremorine or pilocarpine was originated only from the Gαq pathway, since QIC alone completely abolished their DMR (Fig. 5f and g, respectively). Interestingly, one-way ANOVA followed by Tukey’s multiple comparison test suggests that the remaining DMR after QIC pretreatment gave rise to an order in DMR amplitude of acetylcholine ~ oxotremorine M > carbachol ~ methacholine ⪢ bethanechol (Fig. 5h), suggesting that these agonists have distinct efficacy to activate the Gαs pathway. These results suggest that oxotremorine and pilocarpine are two partial agonists for the Gαq pathway, but not the Gαs pathway in HCT-15 cells, while the other agonists activate both pathways.
Fig. 5.

Pathway biased agonism of muscarinic receptor agonists in HCT-15 cells. (a) 16 μM acetylcholine; (b) 16 μM oxotremorine M; (c) 64 μM carbachol; (d) 32 μM methacholine; (e) 64 μM bethanechol; (f) 16 μM oxotremorine; (g) 64 μM pilocarpine. Data represents mean ± s.d. (n = 4). (h) One-way ANOVA followed by Tukey’s multiple comparison test of the maximal DMR of different agonists in the QIC-treated cells.
The pathway deconvolution also showed that in HT-29 cells QIC alone almost completely inhibited the DMR arising from all seven agonists (Supplementary Fig. S2). Neither CTx nor PTx had obvious effect on the DMR of all agonists. Combining QIC with PTx and/or CTx made the cells responding to all agonists with a small, rapid, but detectable DMR, similar to the treatment with QIC alone. These results suggest that the activation of endogenous M3 receptors in HT-29 results in signaling primarily through the Gαq pathway, and also to small degree a non-Gαs, Gαq, Gαi pathway (possibly G12/13 pathway).
In HeLa cells the activation of the M3 receptors also primarily mediated signaling via the Gαq pathway, as evidenced by the significant attenuation of the DMR signals of the five active agonists by the QIC treatment (Supplementary Fig. S3). Both PTx and CTx also altered the late DMR responses of these agonists. Only the combination of PTx, CTx and QIC, but not QIC with CTx or PTx, completely blocked the DMR of these five agonists. Together, these results suggest that the activation of endogenous M3 receptors in HeLa may mediate signaling via multiple pathways.
In SF268 cells QIC greatly suppressed the DMR of all six active agonists, while PTx partially suppressed the DMR of these agonists (Supplementary Fig. S4). The combination of QIC and PTx completely abolished the DMR of these agonists. These results suggest that the activation of endogenous M3 receptors in SF268 may mediate signaling via both the Gαi and Gαq pathways.
In PC-3 cells, QIC, PTx, and CTx all had obvious effects on the DMR of all six active agonists (Supplementary Fig. S5). The combination of QIC with PTX and CTx only completely blocked the acetylcholine DMR, but not the DMR of the other five agonists. These results suggest that the activation of endogenous M3 receptors in PC-3 may mediate signaling via multiple pathways. Similar results were also observed in CCRF-CEM cells (Supplementary Fig. S6).
Collectively, these results suggest that the endogenous muscarinic M3 receptor can mediate signaling via multiple pathways including Gαq, Gαi, Gαs, and possibly G12/13 pathways; specific pathways contributing to the DMR are cell background dependent; and muscarinic agonists can display biased agonism in a cellular context dependent manner.
3.6. Label-free cell phenotypic potency and efficacy of muscarinic receptor agonists
Given the complexity in signaling pathways contributing to the DMR as well as the time-dependent potency observed in the four cell lines, we chose two time points, one at early and another at 50 min post stimulation, to determine the potency and efficacy of all ligands in the six cell lines. The early time points were 15 min, 2 min, 3 min, 10 min, 3 min and 3 min post stimulation for HCT-15, HT-29, PC3, CCRF-CEM, SF268 and HeLa cells, respectively. The potency and efficacy for all agonists in the six cell lines were obtained using nonlinear regression and summarized in Supplementary Table S1. The early DMR dose responses were summarized in Supplementary Fig. S7, while the DMR amplitudes at 50 min post stimulation were shown in Fig. 6. Results showed that both the potency and efficacy of agonists are time- and cell line-dependent.
Fig. 6.

Dose-dependent DMR responses at 50 min post stimulation of the seven agonists in the six different cell lines. (a) HCT-15; (b) HT-29; (c) HeLa; (d) SF268; (e) PC3; (f) CCRF-CEM cells. Data represents mean ± s.d. (n = 4).
3.7. Operational agonism analysis
The Black and Leff model of operational agonism (Black & Leff, 1983; Kenakin, 2009) defines the value of τ, the ratio of receptor density to the efficiency of signal transduction by the agonist–receptor complex, as
| (1) |
where [A] is the agonist concentration, Emax the maximal response capability of the receptor in the respective cell line, KA the equilibrium dissociation constant of the agonist–receptor complex, n the slope of the dose DMR response curve, and τ the efficacy equal to the ratio of receptor density to the efficiency of signal transduction by the ligand–receptor complex.
Given the relatively low expression levels of endogenous M3 receptors in the six cell lines it is obviously difficult to directly determine the binding affinity of all agonists. Further complication arises from the observations that the binding affinity of a ligand to a GPCR is often cell line dependent and sensitive to the co-existence and nature of the receptor-interacting signaling protein (Kenakin, 2013). Thus, we first estimated the KA value of each agonist in the respective cell line by fitting its dose DMR response curve with the Eq. (1), given (Kenakin, 2013):
| (2) |
Analysis of the dose responses of five agonists that triggered robust DMR in HCT-15 or HT-29 showed that the estimated pKA values (Table 3) are somewhat different from, but generally tracked the rank order with, those obtained using radiobinding assays with CHO-M3 cell lines (Sykes, Dowling, & Charlton, 2009). The reported pKi values were −4.87, −4.09, −4.52, −4.61, and −3.71 for acetylcholine, carbachol, methacholine, oxotremorine M, and bethanechol, respectively. Furthermore, the operational bias analysis suggests that among the five agonists that resulted in robust DMR in HCT-15 cells, only bethanechol is clearly biased towards the early response. In contrast, bethanechol was found to be biased towards the late Gαq-mediated response in HT-29, compared to the early response mediated through both Gαq- and possibly G12/13-pathways (Supplementary Fig. S2).
Table 3.
The τ, KA, log (τ / KA), and bias calculated based on the model of operational agonism. The bias was calculated by subtracting the log (τ / KA) at 50 min from the log (τ / KA) at early time point (15 min for HCT-15, and 2 min for HT-29).
| HCT15 | HT29 | ||
|---|---|---|---|
| τ (early) | Acetylcholine | 40.9 ± 5.6 (0.93) | 31.3 ± 1.1 (1.00) |
| Carbachol | 47.2 ± 8.9 (1.02) | 21.6 ± 7.3 (1.14) | |
| Methacholine | 8.6 ± 1.9 (1.00) | 12.5 ± 4.6 (1.02) | |
| Oxotremorine M | 32.4 ± 9.3 (1.03) | 13.7 ± 3.1 (1.30) | |
| Bethanechol | 1.0 ± 0.04 (1.35) | 1.4 ± 0.1 (1.4) | |
| τ (50 min) | Acetylcholine | 26.6 ± 5.0 (0.98) | 83.3 ± 20.6 (0.99) |
| Carbachol | 32.9 ± 6.8 (1.00) | 48.9 ± 12.1 (1.03) | |
| Methacholine | 31.2 ± 7.5 (0.94) | 6.1 ± 0.7 (1.04) | |
| Oxotremorine M | 54.3 ± 8.1 (0.91) | 68.7 ± 15.2 (1.06) | |
| Bethanechol | 4.3 ± 0.86 (0.88) | 1.0 ± 0.02 (1.45) | |
| pKA (early) | Acetylcholine | 4.82 | 5.22 |
| Carbachol | 3.76 | 4.29 | |
| Methacholine | 5.14 | 5.12 | |
| Oxotremorine M | 4.80 | 5.24 | |
| Bethanechol | 4.71 | 4.68 | |
| pKA (50 min) | Acetylcholine | 5.30 | 4.48 |
| Carbachol | 4.25 | 3.73 | |
| Methacholine | 4.76 | 5.26 | |
| Oxotremorine M | 4.79 | 4.25 | |
| Bethanechol | 4.02 | 4.77 | |
| Log (τ / KA) (early) | Acetylcholine | 6.43 | 6.72 |
| Carbachol | 5.43 | 5.63 | |
| Methacholine | 6.08 | 6.21 | |
| Oxotremorine M | 6.31 | 6.38 | |
| Bethanechol | 4.73 | 4.83 | |
| Log (τ / KA) (50 min) | Acetylcholine | 6.72 | 6.40 |
| Carbachol | 5.76 | 5.42 | |
| Methacholine | 6.26 | 6.05 | |
| Oxotremorine M | 6.52 | 6.09 | |
| Bethanechol | 4.66 | 4.78 | |
| Bias (early – 50 min) | Acetylcholine | 0.00 | 0.00 |
| Carbachol | −0.04 | −0.11 | |
| Methacholine | 0.11 | −0.15 | |
| Oxotremorine M | 0.08 | − 0.02 | |
| Bethanechol | 0.36 | − 0.26 |
The values in parentheses is n, the slope of the dose response curve, which is mostly unity.
3.8. The biochemical mechanism of action of muscarinic receptor agonists
Lastly, to estimate the biochemical mechanism of action of these agonists, we used their known Ki, Kon and Koff values which were obtained using radioligand binding assays (Sykes et al., 2009). The biochemical mechanism of action defines the interaction between a drug and its target that creates a binding kinetics-determined response (Fang, 2013; Swinney, 2004). Given that in practice it is obviously difficult to accurately determine the binding kinetics of each ligand for each receptor-G protein complex in each cell line, as well as our operational model analysis pointed to the similarity between the KA values calculated (Table 3) and those measured using radioligand binding assays (Sykes et al., 2009), we felt that it is possible to estimate the biochemical mechanism of action of muscarinic receptor agonists using the reported macro-Ki values and macro-binding kinetics. The M3 receptor is known to couple with multiple G proteins in a specific cell line (Caulfield & Birdsall, 1998; Jakubik, Janickova, Randakova, Ei-Fakahany, & Dolezal, 2011), and certain fractions of M3 receptor in a specific cell line can be precoupled with specific G protein(s), in particular Gαq proteins (Jakubik et al., 2011; Qin, Dong, Wu, & Lambert, 2011), as predicted by ensemble theory (Boehr, Nussinov, & Wright, 2009; Fang, 2012). Furthermore, the binding characteristics of ligands, in particular agonists, are sensitive to the presence and nature of receptor interacting proteins (Kenakin, 2013).
We examined the agonist responses in HCT-15 cells, since all the seven ligands were active in this cell line but with a wide range of efficacy (Fig. 3a). First, correlation analysis showed that for all seven agonists tested their EC50 values at 15 min post stimulation were found to be linear with the corresponding EC50 values at 50 min post stimulation (Fig. 7a), suggesting that both early and late DMR were resulted from the activation of the same receptor. Second, the relative maxima at 15 min were deviated from the linear relation with their corresponding relative maxima at 50 min (Fig. 7b). This suggests that there are two different cellular events/signaling pathways contributing differently to the early and late DMR responses, respectively; and the coupling efficiency to the pathway contributing to the late response was relatively stronger than that dominating the early response (Onaran & Costa, 2012) (Fig. 7c). This was confirmed by the pathway deconvolution results showing that the Gαq-pathway contributes to the early response, while both Gαq- and Gαs-pathways co-contribute to the late response (Fig. 5). Third, the efficacy τ values at 15 min were found to be in linear with those at 50 min, regardless whether the τ values were estimated based on the reported Ki or the calculated KA (Fig. 7d). Interestingly, the correlation analysis between the τ values at 15 min and 50 min obtained using the reported Ki values gave rise to a slope one-fold greater than that obtained using the calculated KA values. These results suggest that although there is a system bias towards the late over the early responses, most of the agonists examined displayed little signaling bias (Table 3). This was confirmed by the pathway deconvolution results (Fig. 5), and further confirmed by the linear relation between the log (τ / KA) values at 15 min and 50 min post stimulation (Fig. 7e). The log (τ) values at 50 min exhibited better linear relation with the corresponding relative maxima than those at 15 min (Fig. 7f). This may be due to the fact that the late response more closely resembles the equilibrium condition than the early response. Fourth, the pEC50 values of different agonists showed relatively good correlation with their reported pKi values, regardless of time points measured (Fig. 7g), but neither their on rate (Fig. 7h) nor off rate (Fig. 7i). Fifth, except for oxotremorine and pilocarpine, the log (τ) values of the remaining five agonists at 15 min or 50 min were found to be positively correlated with their reported pKi values (Fig. 7j) or log(on rate) (Fig. 7k), but negatively with their log(off rate) (Fig. 7l). Furthermore, the relative maxima of these agonists did not correlate with their pKi values (Fig. 7m) or log(on rate) (Fig. 7n), but were negatively correlated with their log(off rate) (Fig. 7o). Similarly, for other cell lines the relative maxima of these muscarinic receptor agonists also gave rise to a negative linear relation with their off rate (Fig. 8). Collectively, these analyses suggest that the off rates of muscarinic receptor agonists have a direct impact on their label-free cell phenotypic efficacy.
Fig. 7.

Correlation analysis of muscarinic receptor agonists in HCT-15 cells. (a) The relation between pEC50 at 15 min and 50 min poststimulation. (b) The relation between the relative maxima at 15 min and 50 min poststimulation. (c) Schematic drawing showing distinct pathways contributing differently to the early and late DMR, respectively, with a stronger coupling efficiency towards the late response. (d) The relation between the τ values at 15 min and 50 min poststimulation; wherein the τ values were obtained based on the reported Ki values or the data fitting derived KA values. (e) The relation between the log (τ / KA) values at 15 min and 50 min. (f) The relation between log (τ) and relative maxima. (g) The relation between pKi and pEC50. (h) The relation between log (kon) and pEC50. (i) The relation between log (koff) and pEC50. (j) The relation between pKi and log (τ). (k) The relation between log (Kon) and log (τ). (l) The relation between log (koff) and log (τ). (m) The relation between pKi and relative maxima. (n) The relation between log (kon) and relative maxima. (o) The relation between log (koff) and relative maxima. Data represents mean ± s.d. (n = 4). The p (probability) value for determining the slope if it is significantly non-zero was calculated using linear regression with Prism. A p-value below 0.05 means that the difference is statistically significant. All pKi, Kon and Koff values were obtained from Sykes et al. (2009).
Fig. 8.
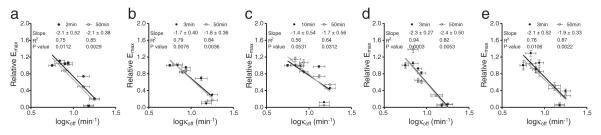
Relation between relative maxima and log (Koff) values of muscarinic receptor agonists in different cell lines. (a) HT-29; (b) PC3; (c) CCRF-CEM; (d) SF268; (e) HeLa cells. Data represents mean ± s.d. (n = 4). The p (probability) value for determining the slope if it is significantly non-zero was calculated using linear regression with Prism. A p-value below 0.05 means that the difference is statistically significant. All pKi, Kon and Koff values were obtained from Sykes et al. (2009).
4. Discussion
To study the biased agonism and label-free cell phenotypic efficacy of muscarinic receptor agonists acting at the endogenous M3 receptor, we first identified six out of the total 25 different cell lines that gave rise to the comparatively highest mRNA level for the M3 receptor subtype over other muscarinic receptor subtypes. Given that the relationship between steady state mRNA levels and receptor protein expression at the cell surface plasma membrane might differ not only across the five muscarinic receptor subtypes but also across the different cell lines, the quantitative RT-PCR data may not be sufficient to identify the functional receptor subtype(s) in these cell lines. Thus, we further determined using multiple DMR assays, together with literature mining, that the six cell lines predominantly express functional M3 receptors.
The endogenous M3 receptors in the six different cell lines are further used as model systems to examine the label-free whole cell efficacy of a panel of seven muscarinic receptor agonists. DMR agonist assays showed that different agonists gave rise to cell system-dependent potency, efficacy and DMR characteristics. This is largely in line with the fact that the DMR arising from a receptor–ligand interaction is a holistic representation of the signaling pathways being activated (Fang, 2010; Fang, Li, & Peng, 2005; Tran & Fang, 2008) and different cells have distinct cellular signaling circuits (Kenakin, 2012). Interestingly, the label-free pharmacology of muscarinic antagonists is also sensitive to cell background, as evidenced by atropine that was about 20 times more potent at inhibiting the acetylcholine response in HeLa cells than in HCT-15 cells, and by the relative potency of tiotropium over ipatropium in which tiotropium was 147 fold more potent than ipatropium in CCRF-CEM cells, but only 5.5 fold in PC3 cells. Although exact mechanism(s) are unknown, several factors including differences in receptor expression level and receptor interacting proteins (Kenakin, 2012), and the different binding kinetics (kon and Koff) of antagonists relative to acetylcholine as well as the DMR assay formats (Deng et al., 2012) may contribute to these cell line-dependent differences.
Different muscarinic receptor agonists are found to display biased agonism in a cell line dependent manner. First, different agonists exhibited distinct time-dependent potency changes in different cell lines. GPCR signaling is known to consist of a series of spatial and temporal events and pathways, each with its own characteristics such as kinetics, dynamics, amplitude and location (Fang, Frutos, & Verklereen, 2008; Kholodenko, 2006; Lohse et al., 2008). Many of these events and pathways not only can contribute to the DMR arising from the receptor activation, but also can be encoded in different time domains of the DMR (Fang, 2011; Tran & Fang, 2008). Furthermore, the DMR signals of the muscarinic receptor agonists, when being active in a specific cell line, remain above the baseline throughout the assay (Fig. 3). Given that the DMR is a readout of cell signaling events under non-equilibrium condition (Deng et al., 2012; Goral, Jin et al., 2011; Goral, Wu et al., 2011), and different DMR events/pathways have different kinetics (Fang et al., 2007; Tran & Fang, 2008), these results suggest that different agonists may have distinct biased agonism. Of note, we cannot rule out the possibility that the binding kinetics, in particular on-rates, may also contribute to this. Second, pathway deconvolution studies showed that the activation of M3 receptor can mediate signaling beside the Gq pathway. Specifically, the M3 receptors in HCT-15 cells can mediate signaling through both Gαq and Gαs pathways, while the receptors in HT-29 mediate signaling primarily through the Gαq pathway, and also to a small degree a non-Gαs, Gαq, Gαi pathway (possibly G12/13 pathway). The M3 receptor is known to primarily mediate signaling through Gq/11, but also to couple to other G proteins including Gs, Gi and G12/13 (Felder, 1995; Jakubik et al., 2011; Nahorski, Tobin, & Willars, 1997). Third, pathway deconvolution studies also showed that muscarinic agonists display biased agonism in a cellular context dependent manner. For instance, in HCT-15 cells oxotremorine and pilocarpine are two partial agonists for the QIC-sensitive Gq pathway but inactive in the CTx-sensitive Gs pathway, whereas the other agonists appear active in both pathways. Furthermore, oxotremorine M, carbachol, acetylcholine and methacholine resulted in a DMR that reaches the maximal possible in the native HCT-15 cells, but triggered DMR with different amplitudes in the QIC-treated HCT-15 cells. Fourth, our operational model analysis also pointed out that there are different biases at activating the early versus late responses in HCT-15 and HT-29 cells for different agonists. Of note, given that the DMR signal is a holistic response reflecting the activation of a large number of, as yet often undefined, signaling pathways (Fang, 2011, 2013), DMR is viewed to not be the best readout for studies of agonist signaling bias. Canonically for studying pathway-specific signaling one would have isolated independent readouts of the separate pathways, and the biased agonism is inferred from the reversals of rank order of potency or efficacy among agonists for different signaling pathways. Here, we present evidence suggesting that the endogenous M3 receptors are capable of mediating signaling via multiple pathways, the exact of which is dependent on both agonist and cell line. These results suggest that combining pathway deconvolution with DMR profiling could assist in elucidating the biased agonism of GPCR ligands.
Lastly, we applied the macro-kinetic parameters of muscarinic receptor agonists binding to the M3 receptors to estimate their biochemical mechanism of action. Correlation analysis between the label-free efficacy obtained and the reported macro-kinetic parameters suggests that the whole cell efficacy of muscarinic receptor agonists, as defined by the relative maxima of DMR responses, was mostly correlated with their macro-off rate. These findings are in line with recent increasing data suggesting that the kinetics, in particular, drug residence time, of drug–target interactions plays an important role in determining efficacy, safety, duration of action, tolerability, indication and therapeutic differentiation (Copeland, Pompliano, & Meek, 2006; Guo, Mulder-Krieger, Ijzerman, & Heitman, 2012; Lu & Tonge, 2010; Singh, Petter, Baillie, & Whitty, 2011; Swinney, 2011; Sykes et al., 2009; Zhang & Monsma, 2009). The direct impact of both on and off rates of GPCR agonists on their whole cell efficacy is also sensible. It is known that GPCRs can display rich behavior, ranging from rapid onset response to transit response (Fang et al., 2008), as well as delayed and persistent responses via the internalized receptors (Calebiro, Nikolaev, Persani, & Lohse, 2010). The off-rates of agonists, in particular those that cannot get into and accumulate inside the cytoplasm of cells through a mechanism (e.g., transporter) other than the endocytosis process, are expected to have more direct impact on receptor behaviors once being internalized. As a matter of fact, the recent agonist removal studies using the perfusion approach showed that certain signaling can propagate even after agonist removal, but some require the agonist occupancy (Goral, Jin et al., 2011); and the whole cell responses of long-acting β2-adrenergic receptor agonists, but not the short-acting ones, are insensitive to the agonist removal, suggesting that the agonist residence time is important for its signaling (Calebiro et al., 2010; Goral, Jin et al., 2011). Nonetheless, the present study provides extra evidence supporting the binding kinetics, particularly the drug residence time, as a plausible molecular mechanism defining the whole cell phenotypic efficacy of GPCR ligands. Of note, the impact of ligand binding kinetics on the in vitro whole cell efficacy observed may not be translated directly into the importance in their in vivo efficacy where circulation and metabolism can be extensive (Fang, 2013).
Supplementary Material
Acknowledgments
This work is supported partially by National Institutes of Health Grant 5U54MH084691.
Abbreviations
- DMR
dynamic mass redistribution
- GPCR
G protein-coupled receptor
- HBSS
Hanks’ balanced salt solution
- RT-PCR
real time polymerase chain reaction
- RWG
resonant waveguide grating
Footnotes
Appendix A. Supplementary data Supporting Information Available: Table S1 summarizes the EC50, τ, and relative maxima values of all muscarinic receptor agonists tested. Fig. S1 shows the relative maxima of all seven agonists in different cell lines. Fig. S2 to S6 show the pathway deconvolution results in HT-29, HeLa, SF268, PC3 and CCRF-CEM cells, respectively. Fig. S7 shows the dose-dependent early DMR responses of all agonists in all six cell lines. This information is available free of charge via the Internet at http://www.sciencedirect.com/science/journal/10568719. Supplementary data associated with this article can be found, in the online version, at http://dx.doi.org/10.1016/j.vascn.2013.07.005.
References
- Black JW, Leff P. Operational models of pharmacological agonism. Proceedings of the Royal Society B: Biological Sciences. 1983;220:141–162. doi: 10.1098/rspb.1983.0093. [DOI] [PubMed] [Google Scholar]
- Boehr DD, Nussinov R, Wright PE. The role of dynamic conformational ensembles in biomolecular recognition. Nature Chemical Biology. 2009;5:789–796. doi: 10.1038/nchembio.232. [DOI] [PMC free article] [PubMed] [Google Scholar]
- Calebiro D, Nikolaev VO, Persani L, Lohse MJ. Signaling by internalized G-protein-coupled receptors. Trends in Pharmacological Sciences. 2010;31:221–228. doi: 10.1016/j.tips.2010.02.002. [DOI] [PubMed] [Google Scholar]
- Casarosa P, Bouyssou T, Germeyer S, Schnapp A, Gantner F, Pieper M. Pre-clinical evaluation of long-acting muscarinic antagonists: comparison of tiotropium and investigational drugs. The Journal of Pharmacology and Experimental Therapeutics. 2009;330:660–668. doi: 10.1124/jpet.109.152470. [DOI] [PubMed] [Google Scholar]
- Caulfield MP, Birdsall NJ. International Union of Pharmacology. XVII. Classi-fication of muscarinic acetylcholine receptors. Pharmacological Reviews. 1998;50:279–290. [PubMed] [Google Scholar]
- Charlton SJ. Agonist efficacy and receptor desensitization: from partial truths to a fuller picture. British Journal of Pharmacology. 2009;158:165–168. doi: 10.1111/j.1476-5381.2009.00352.x. [DOI] [PMC free article] [PubMed] [Google Scholar]
- Copeland RA, Pompliano DL, Meek TD. Drug–target residence time and its implications for lead optimization. Nature Reviews Drug Discovery. 2006;5:730–739. doi: 10.1038/nrd2082. [DOI] [PubMed] [Google Scholar]
- Deng H, Wang C, Su M, Fang Y. Probing biochemical mechanisms of action of muscarinic M3 receptor antagonists with label-free whole-cell assays. Analytical Chemistry. 2012;84:8232–8239. doi: 10.1021/ac301495n. [DOI] [PubMed] [Google Scholar]
- Fang Y. Label-free receptor assays. Drug Discovery Today: Technologies. 2010;7:e5–e11. doi: 10.1016/j.ddtec.2010.05.001. [DOI] [PMC free article] [PubMed] [Google Scholar]
- Fang Y. The development of label-free cellular assays for drug discovery. Expert Opinion on Drug Discovery. 2011;6:1285–1298. doi: 10.1517/17460441.2012.642360. [DOI] [PubMed] [Google Scholar]
- Fang Y. Ligand–receptor interaction platforms and their applications for drug discovery. Expert Opinion on Drug Discovery. 2012;7:969–988. doi: 10.1517/17460441.2012.715631. [DOI] [PubMed] [Google Scholar]
- Fang Y. Troubleshooting and deconvoluting label-free cell phenotypic assays in drug discovery. Journal of Pharmacological and Toxicological Methods. 2013;67:69–81. doi: 10.1016/j.vascn.2013.01.004. [DOI] [PubMed] [Google Scholar]
- Fang Y, Ferrie AM, Fontaine NH, Mauro J, Balakrishnan J. Resonant waveguide grating biosensor for living cell sensing. Biophysical Journal. 2006;91:1925–1940. doi: 10.1529/biophysj.105.077818. [DOI] [PMC free article] [PubMed] [Google Scholar]
- Fang Y, Frutos AG, Verklereen R. Label-free cell-based assays for GPCR screening. Combinatorial Chemistry & High Throughput Screening. 2008;11:357–369. doi: 10.2174/138620708784534789. [DOI] [PubMed] [Google Scholar]
- Fang Y, Li G, Ferrie AM. Non-invasive optical biosensor for assaying endogenous G protein-coupled receptors in adherent cells. Journal of Pharmacological and Toxicological Methods. 2007;55:314–322. doi: 10.1016/j.vascn.2006.11.001. [DOI] [PubMed] [Google Scholar]
- Fang Y, Li G, Peng J. Optical biosensor provides insights for bradykinin B2 receptor signaling in A431 cells. FEBS Letters. 2005;579:6365–6374. doi: 10.1016/j.febslet.2005.10.019. [DOI] [PubMed] [Google Scholar]
- Felder CC. Muscarinic acetylcholine receptors: signal transduction through multiple effectors. The FASEB Journal. 1995;9:619–625. [PubMed] [Google Scholar]
- Galandrin S, Bouvier M. Distinct signaling profiles of β1 and β2 adrenergic receptor ligands toward adenylyl cyclase and mitogen-activated protein kinase reveals the pluridimensionality of efficacy. Molecular Pharmacology. 2006;70:1575–1584. doi: 10.1124/mol.106.026716. [DOI] [PubMed] [Google Scholar]
- Goral V, Jin Y, Sun H, Ferrie AM, Wu Q, Fang Y. Agonist-directed desensitization of the β2-adrenergic receptor. PLoS One. 2011;6:e19282. doi: 10.1371/journal.pone.0019282. [DOI] [PMC free article] [PubMed] [Google Scholar]
- Goral V, Wu Q, Sun H, Fang Y. Label-free optical biosensor with microfluidics for sensing ligand-directed functional selectivity on trafficking of thrombin receptor. FEBS Letters. 2011;585:1054–1060. doi: 10.1016/j.febslet.2011.03.003. [DOI] [PubMed] [Google Scholar]
- Guo D, Mulder-Krieger T, Ijzerman AP, Heitman LH. Functional efficacy of adenosine A A receptor agonists is positively correlated to their receptor residence time. British Journal of Pharmacology. 2012;166:1846–1959. doi: 10.1111/j.1476-5381.2012.01897.x. [DOI] [PMC free article] [PubMed] [Google Scholar]
- Huang XP, Prilla S, Mohr K, Ellis J. Critical amino acid residues of the common allosteric site on the M2 muscarinic acetylcholine receptor: more similarities than differences between the structurally divergent agents gallamine and bis(ammonio)alkane-type hexamethylene-bis-[dimethyl-(3-phthalimidopropyl)ammonium]dibromide. Molecular Pharmacology. 2005;68:769–778. doi: 10.1124/mol.105.014043. [DOI] [PubMed] [Google Scholar]
- Jakubik J, Janickova H, Randakova A, Ei-Fakahany EE, Dolezal V. Subtype differences in pre-coupling of muscarinic acetylcholine receptors. PLoS One. 2011;6:e27732. doi: 10.1371/journal.pone.0027732. [DOI] [PMC free article] [PubMed] [Google Scholar]
- Kahsai AW, Xiao K, Rajagopal S, Ahn S, Shukla AK, Sun J, et al. Multiple ligand-specific conformations of the β2-adrenergic receptor. Nature Chemical Biology. 2011;7:692–700. doi: 10.1038/nchembio.634. [DOI] [PMC free article] [PubMed] [Google Scholar]
- Kenakin T. New concepts in drug discovery: collateral efficacy and permissive antagonism. Nature Reviews Drug Discovery. 2005;4:919–927. doi: 10.1038/nrd1875. [DOI] [PubMed] [Google Scholar]
- Kenakin T. Quantifying biological activity in chemical terms: a pharmacology primer to describe drug effect. ACS Chemical Biology. 2009;4:249–260. doi: 10.1021/cb800299s. [DOI] [PubMed] [Google Scholar]
- Kenakin T. The potential for selective pharmacological therapies through biased receptor signaling. BMC Pharmacology & Toxicology. 2012;13:3. doi: 10.1186/2050-6511-13-3. [DOI] [PMC free article] [PubMed] [Google Scholar]
- Kenakin T. New concepts in pharmacological efficacy at 7TM receptors: IUPHAR review 2. British Journal of Pharmacology. 2013;168:554–575. doi: 10.1111/j.1476-5381.2012.02223.x. [DOI] [PMC free article] [PubMed] [Google Scholar]
- Kenakin T, Miller LJ. Seven transmembrane receptors as shapeshifting proteins: the impact of allosteric modulation and functional selectivity on new drug discovery. Pharmacological Reviews. 2010;62:265–304. doi: 10.1124/pr.108.000992. [DOI] [PMC free article] [PubMed] [Google Scholar]
- Kholodenko BN. Cell-signalling dynamics in time and space. Nature Reviews Molecular Cell Biology. 2006;7:165–176. doi: 10.1038/nrm1838. [DOI] [PMC free article] [PubMed] [Google Scholar]
- Kopp R, Lambrecht G, Mutschler E, Moser U, Tacke R, Pfeiffer A. Human HT-29 colon carcinoma cells contain muscarinic M3 receptors coupled to phosphoinositide metabolism. European Journal of Pharmacology. 1989;172:397–405. doi: 10.1016/0922-4106(89)90021-7. [DOI] [PubMed] [Google Scholar]
- Li G, Ferrie AM, Fang Y. Label-free profiling of ligands for endogenous GPCRs using a cell-based high-throughput screening technology. Journal of the Association for Laboratory Automation. 2006;11:181–187. [Google Scholar]
- Liu JJ, Horst R, Katritch V, Stevens R, Wuthrich K. Biased signaling pathways in β2-adrenergic receptor characterized by 19F-NMR. Science. 2012;335:1106–1110. doi: 10.1126/science.1215802. [DOI] [PMC free article] [PubMed] [Google Scholar]
- Lohse MJ, Nikolaev VO, Hein P, Hoffmann C, Vilardaga JP, Bunemann M. Optical techniques to analyze real-time activation and signaling of G-protein-coupled receptors. Trends in Pharmacological Sciences. 2008;29:159–165. doi: 10.1016/j.tips.2007.12.002. [DOI] [PubMed] [Google Scholar]
- Lu H, Tonge PJ. Drug–target residence time: critical information for lead optimization. Current Opinion in Chemical Biology. 2010;14:467–474. doi: 10.1016/j.cbpa.2010.06.176. [DOI] [PMC free article] [PubMed] [Google Scholar]
- Luthin GR, Wang P, Zhou H, Dhanasekaran, Ruggieri MR. Role of M1 receptor-G protein coupling in cell proliferation in the prostate. Life Sciences. 1997;60:963–968. doi: 10.1016/s0024-3205(97)00035-0. [DOI] [PMC free article] [PubMed] [Google Scholar]
- Mitchelson FJ. The pharmacology of McN-A-343. Pharmacology & Therapeutics. 2012;135:216–245. doi: 10.1016/j.pharmthera.2012.05.008. [DOI] [PubMed] [Google Scholar]
- Nahorski SR, Tobin AB, Willars GB. Muscarinic M3 receptor coupling and regulation. Life Sciences. 1997;60:1039–1045. doi: 10.1016/s0024-3205(97)00045-3. [DOI] [PubMed] [Google Scholar]
- Neves SR, Ram PT, Iyengar R. G protein pathways. Science. 2002;296:1636–1639. doi: 10.1126/science.1071550. [DOI] [PubMed] [Google Scholar]
- Nginamau ES, Maehle BO, Jonsson R. An experimental protocol for the fractionation and 2DE separation of HeLa and A-253 cell lysates suitable for the identification of the individual antigenic proteome in Sjögren’s syndrome. Autoimmunity. 2011;44:652–663. doi: 10.3109/08916934.2011.593598. [DOI] [PubMed] [Google Scholar]
- Onaran HO, Costa T. Where have all the active receptor states gone? Nature Chemical Biology. 2012;8:674–677. doi: 10.1038/nchembio.1024. [DOI] [PubMed] [Google Scholar]
- Qin K, Dong C, Wu G, Lambert NA. Inactive-state preassembly of Gq coupled receptors and Gq heterotrimers. Nature Chemical Biology. 2011;7:740–747. doi: 10.1038/nchembio.642. [DOI] [PMC free article] [PubMed] [Google Scholar]
- Sauliere A, Bellot M, Paris H, Denis C, Finana F, Hansen JT, et al. Deciphering biased-agonism complexity reveals a new active AT1 receptor entity. Nature Chemical Biology. 2012;8:622–630. doi: 10.1038/nchembio.961. [DOI] [PubMed] [Google Scholar]
- Schröder R, Janssen N, Schmidt J, Kebig A, Merten N, Hennen S, et al. Deconvolution of complex G protein-coupled receptor signaling in live cells using dynamic mass redistribution measurements. Nature Biotechnology. 2010;28:943–949. doi: 10.1038/nbt.1671. [DOI] [PubMed] [Google Scholar]
- Singh J, Petter RC, Baillie TA, Whitty A. The resurgence of covalent drugs. Nature Reviews Drug Discovery. 2011;10:307–317. doi: 10.1038/nrd3410. [DOI] [PubMed] [Google Scholar]
- Swinney DC. Biochemical mechanisms of drug action: what does it take for success? Nature Reviews Drug Discovery. 2004;3:801–808. doi: 10.1038/nrd1500. [DOI] [PubMed] [Google Scholar]
- Swinney DC. Molecular mechanism of action (MMoA) in drug discovery. Annual Review of Medicinal Chemistry. 2011;46:301–317. [Google Scholar]
- Sykes DA, Dowling MR, Charlton SJ. Exploring the mechanism of agonist efficacy: a relationship between efficacy and agonist dissociation rate at the muscarinic M3 receptor. Molecular Pharmacology. 2009;76:543–551. doi: 10.1124/mol.108.054452. [DOI] [PubMed] [Google Scholar]
- Tran E, Fang Y. Duplexed label-free G protein-coupled receptor assays for high-throughput screening. Journal of Biomolecular Screening. 2008;13:975–985. doi: 10.1177/1087057108326141. [DOI] [PubMed] [Google Scholar]
- Valant C, Gregory KJ, Hall NE, Scammells PJ, Lew MJ, Sexton PM, et al. A novel mechanism of G protein-coupled receptor functional selectivity. Muscarinic partial agonist McN-A-343 as a bitopic orthosteric/allosteric ligand. Journal of Biological Chemistry. 2008;283:29312–29321. doi: 10.1074/jbc.M803801200. [DOI] [PMC free article] [PubMed] [Google Scholar]
- Verrier F, An S, Ferrie AM, Sun H, Kyoung M, Deng H, et al. GPCRs regulate the assembly of a multienzyme complex for purine biosynthesis. Nature Chemical Biology. 2011;7:909–915. doi: 10.1038/nchembio.690. [DOI] [PMC free article] [PubMed] [Google Scholar]
- Yang W-L, Frucht H. Cholinergic receptor up-regulates COX-2 expression and prostaglandin E2 production in colon cancer cells. Carcinogenesis. 2000;21:1789–1793. doi: 10.1093/carcin/21.10.1789. [DOI] [PubMed] [Google Scholar]
- Yoshikawa K, Fujii T, Kawashima K. Significance of M3 muscarinic acetylcholine receptor (mAChR) in Ca2+ signaling to mAChR agonist in human leukemic T cell line CCRF-CEM (CEM) by reduction of response in small interfering RNA (siRNA)-treated cells. Journal of Pharmacological Sciences. 2005;97(Supplement 1):126. [Google Scholar]
- Zhang R, Monsma F. The importance of drug–target residence time. Current Opinion in Drug Discovery & Development. 2009;12:488–496. [PubMed] [Google Scholar]
Associated Data
This section collects any data citations, data availability statements, or supplementary materials included in this article.