

Abstract
Objectives
Behavioral and psychological symptoms of dementia (BPSD) are prevalent in Alzheimer’s disease (AD) and are related to poor outcomes such as nursing home placement. No study has examined the impact of individual BPSD on dependence, a clinically important feature that reflects changing patient needs and their impact on caregivers. The current study characterized independent cross-sectional and longitudinal relationships between three BPSD (i.e., psychosis, depressed mood, and agitation/aggression), cognition, and dependence to better understand the interplay between these symptoms over time.
Design
The Predictors Study measured changes in BPSD, cognition, and dependence in AD patients every six months. Cross-sectional and longitudinal relationships between individual BPSD, cognition, and dependence over six years were characterized using multivariate latent growth curve modeling. This approach characterizes independent changes in multiple outcome measures over time.
Setting
Four memory clinics in the United States and Europe.
Participants
517 patients with probable Alzheimer’s disease.
Measurements
Columbia University Scale for Psychopathology, modified Mini-Mental State Exam, Dependence Scale.
Results
Both psychosis and depressed mood at study entry were associated with worse subsequent cognitive decline. Independent of cognitive decline, initial psychosis was associated with worse subsequent increases in dependence. Rates of increase in agitation/aggression separately correlated with rates of declines in both cognition and independence.
Conclusions
Although purely observational, findings support the poor prognosis associated with psychosis and depression in AD. Results also show that agitation/aggression tracks declines in cognition and independence independently over time. Targeted intervention for individual BPSD, particularly psychosis, could have broad impacts on not only patient well-being, but also care costs and family burden.
Keywords: dementia, statistical modeling, depression
OBJECTIVE
Behavioral and psychological symptoms of dementia (BPSD) are prevalent in Alzheimer’s disease (AD), occurring in 75% of patients (1). They include symptoms such as agitation, depression, and psychosis. BPSD accelerate poor outcomes in AD, including nursing home placement. A recent review found that in 21 out of 36 studies, the presence of BPSD predicted nursing home placement among individuals with dementia (2). As in most research on BPSD and family outcomes (3), most studies combined all BPSD into a single category despite evidence for disparate trajectories. A previous study on a subset of the present sample followed over a shorter period of time suggested that agitation is common and persistent in AD, whereas psychotic symptoms are persistent but less common, and depressed mood rarely persists (4).
Results from studies examining the impact of individual BPSD on nursing home placement have been mixed. Agitation/aggression is repeatedly associated with nursing home admission (5–7), but results regarding psychosis and depression are inconsistent (2,6,8–9). Unfortunately, many of these studies featured relatively short follow-up, did not control for other contributors to patient care needs (e.g., cognitive decline), and/or focused on only one BPSD. The current paper sought to overcome these limitations by examining the impact of individual BPSD (i.e., psychosis, depressed mood, agitation/aggression) on patient care needs over six years in a sample of 517 AD patients, controlling for other factors that influence disease outcomes (e.g., education and cognitive decline).
In addition, the current study used a dynamic, quantitative measure of patient dependence rather than nursing home placement to index patient care needs. Nursing home placement is influenced not only by patient care needs, but also by caregiver factors and financial, cultural, and regional differences (2,10–11). Racial differences in formal care service utilization exist (12), and the number of in-home services covered by Medicaid differs by geography. Nursing home placement may not fully capture a patient’s needs or the impact of these needs on the family. Dependence level correlates with dementia severity (13), level of disability (14), home health aide use (15), longitudinal increases in medical and non-medical costs (16), overall resource utilization (14), increases in caregiving time (17), and caregiver burden (14). Thus, identifying and treating specific contributors to dependence has the potential for wide-ranging impacts not only on patient quality of life, but also on care costs and family burden.
The goals of the present study were to characterize: 1) cross-sectional and longitudinal relationships between individual BPSD (i.e., psychosis, depressed mood, agitation/aggression) and cognition; and 2) cross-sectional and longitudinal relationships between dependence and individual BPSD independent of cognitive decline. Based on previous findings of disparate courses of individual BPSD (4) and impacts of BPSD on nursing home placement (2), we predicted that worsening agitation/aggression and psychosis would each relate to cognitive decline and increased dependence, whereas depression would only be associated with cognition and dependence cross-sectionally.
METHOD
Participants and Procedures
The sample included 517 patients with probable AD enrolled in The Predictors Study, a multicenter study of predictors of disease course in AD (18). Local Institutional Review Boards (IRB) at all participating sites approved the study. Written informed consent was obtained directly from patients at study entry. All patients had mild dementia at enrollment and were deemed capable of providing informed consent by a study physician. Patient assent was documented at each subsequent visit in accordance with IRB requirements. Characteristics of the sample are shown in Table 1. Race and ethnicity were determined via patient and caregiver report using the format of the 2000 US Census.
Table 1.
Patient Characteristics at Study Enrollment
| N | Mean or % | Standard Deviation | |
|---|---|---|---|
| Age | 517 | 74.19 | 8.45 |
| Education | 517 | 13.72 | 3.62 |
| Sex (% Male) | 517 | 43.1 | - |
| Race (% White) | 516 | 93.2 | - |
| Ethnicity (% Non-Hispanic) | 514 | 95.2 | - |
| Anti-dementia medications (% yes)a | 450 | 31.1 | - |
| Antidepressants (% yes) | 428 | 21.3 | - |
| Antipsychotics (% yes) | 428 | 1.2 | - |
Note. DS=Dependence Scale; mMMS=modified Mini Mental State Exam; CUSPAD=Columbia Scale for Psychopathology in Alzheimer’s Disease.
Only participants recruited during the second wave (after 1997) reported taking anti-dementia medication at study entry.
Study Design
Complete descriptions of study procedures have been described previously (18–19). In brief, participants were recruited in two waves beginning in 1989 (N=252) or 1998 (N=265) from clinics at four sites: Columbia University Medical Center (N=208), Johns Hopkins School of Medicine (N=147), Massachusetts General Hospital (N=124), and the Hôpital de la Salpêtrière in Paris, France (N=38). Cross-site standardization was ensured by requiring all raters to be certified at the Columbia site. Diagnoses of probable AD were made using NINCDS-ADRDA criteria (20) at consensus conferences. At enrollment, all patients were required to have mild dementia (i.e., score above 29 on the 57-point Modified Mini Mental State Exam, described below) and at least one family member/caregiver available. Exclusion criteria were non-AD dementia, parkinsonism, stroke, alcoholism, schizophrenia, schizoaffective disorder, and electroconvulsive treatments.
Participants were assessed every 6-months for up to 16 years. At least one follow-up assessment was available for 97% of the present sample. On average, patients were assessed on 10 occasions (SD=5.9). Only data from the first 13 occasions (six years) were included in the present study to maximize available data. Average attrition rate between visits was 8.5%, and 176 participants were assessed at the last visit. Each of the following measures was administered on each occasion.
Measures
Global cognitive status was assessed with the Modified Mini Mental State Exam (mMMS; 21). The mMMS includes all items from the Mini Mental State Exam (22) and additional items assessing working memory, calculation, recall of presidents, confrontation naming, repetition, and visuoconstruction. Scores range from 0 to 57, with higher scores indicating better cognition.
The main outcome measure was the Dependence Scale (DS; 11), a 13-item instrument administered to a caregiver. The DS was specifically designed to capture the level of care required by a patient and more subtle changes in service needs and family impact than admission to a nursing home. Importantly, the DS is not merely an alternative scale to assess function. Rather, it assesses the impact of disability on the patient and family (e.g., does the patient need to be watched when outside). Substantial development work demonstrated that the DS is related to cognition and disease course independent of functional status (11). The DS comprises 11 dichotomous items (e.g., “Does the patient need to be watched or kept company when awake?”) and two items on a 3-point Likert-type scale (e.g., “Does the patient need reminders or advice to manage chores, do shopping, cooking, play games or handle money?”) Scores range from 0 to 15, with higher scores indicating greater dependence. Psychometric properties range from acceptable to excellent (11,23).
Neuropsychiatric symptoms were assessed with the Columbia University Scale for Psychopathology in AD (CUSPAD; 24), a semi-structured interview conducted with a caregiver assessing symptoms over the previous month. In the present study, items assessing a similar construct were summed to create the following subscores: psychosis (i.e., delusions, hallucinations, illusions), agitation/aggression (i.e., verbal outbursts, physical threats and/or violence, agitation or restlessness), and depressed mood (i.e., frequency of depressed mood). Because the depression construct was measured with a single item (range 0 to 4), separate models treating the depression variable as continuous versus categorical were run. Importantly, there were no differences in the patterns of associations between latent variables in these models. Results presented below represent the continuous variable models. Higher scores indicate more severe symptoms.
Statistical Analysis
Descriptive statistics were used to characterize the sample. Longitudinal data were analyzed in MPlus version 7 with latent growth curve (LGC), a special case of structural equation modeling (25–26). Unlike growth curve modeling using mixed models, LGC accommodates multiple time-varying outcomes in a multivariate framework. Multivariate LGC estimated associations between trajectories of dependence, cognition, and BPSD. This analytic approach controls for covariates measured at baseline or throughout the study. Repeatedly measured variables are modeled both as independent outcomes and as time-varying covariates. A primary advantage of this approach is that longitudinal correlations between the rates of change in multiple outcomes can be estimated.
Missing data were managed with full information maximum likelihood (FIML) using all available data at each occasion. FIML accumulates and maximizes casewise likelihood functions computed using all available data for each participant. Monte Carlo simulation has shown that FIML produces less biased estimates than alternative methods (27). FIML does not assume that data are missing completely at random and can therefore accommodate missingness related to previous scores. This feature of FIML is desirable in longitudinal studies of cognition in AD, as participants lost to follow-up are often those who were more impaired at earlier occasions.
The overall initial level (intercept) and amount of change (slope) were key parameters. Additional information regarding parameter estimation in multivariate LGC is available elsewhere (25,28). Time was parameterized in years from study entry. For all outcomes, raw scores were used. Unstandardized parameter estimates can be interpreted in terms of the original scales. For example, linear slope estimates reflect raw annual change on each outcome. Model fit was assessed with chi square, root mean square error of approximation (RMSEA), standardized root mean square residual (SRMSR), comparative fit index (CFI), and Tucker-Lewis index (TLI). Fit between nested models was compared statistically using the chi square test.
Model building proceeded in two stages. First, trajectories of all five variables (i.e., DS, mMMS, three CUSPAD subscores) were examined separately with unconditional univariate models. Models estimating only linear change were statistically compared to those estimating linear and quadratic change. Second, best-fitting univariate models were combined into three conditional multivariate models, in which obtained parameter estimates control for all included variables. Each model simultaneously estimated growth curves for three outcomes: DS, mMMS, and a CUSPAD variable (i.e., psychosis, depressed mood, agitation/aggression). Each model also estimated the effects of four covariates measured at baseline (i.e., sex, age, education level, recruitment site) on all latent factors (i.e., intercepts, linear slopes, quadratic slopes), and all unique correlations between the latent factors, independent of the covariates. In the multivariate models, associations between any two outcome variables (e.g., CUSPAD psychosis and dependence) are independent of associations involving all other variables. Covariates were centered to facilitate parameter interpretation. Specifically, values of 0 corresponded to age 74, 12 years of education, male sex, and enrollment at the Columbia site.
RESULTS
Unconditional Univariate Models
Nested univariate models were built separately for the five variables of interest. Slope estimates represent model-estimated raw, annual rates of change. In models allowing only linear change, dependence (slope estimate=1.03; SE=0.03; z=31.51; p<.001), cognition (slope estimate=−4.76; SE=0.17; z=−27.71; p<.001), and agitation/aggression (slope estimate=0.10; SE=.02; z=6.02; p<.001) worsened over the study period. DS scores worsened 1.03 points per year, mMMS scores worsened 4.76 points per year, and CUSPAD agitation/aggression scores worsened 0.10 points per year. In contrast, depressed mood improved (slope estimate=−0.03; SE=.01; z=2.87; p=.004), and psychotic symptoms did not change (slope estimate=−0.01; SE=0.02; z=−0.24; p=.81).
Allowing for curvilinear change significantly improved model fit for all variables: dependence (Δχ2(4)=−252.02, p<.001), cognition (Δχ2(4)=−576.30, p>.001), psychosis (Δχ2(4)=−103.75, p<.001), agitation/aggression (Δχ2(4)=−155.18, p<.001), and depressed mood (Δχ2(4)=−60.32, p<.001). Thus, models including both linear and quadratic slopes were retained. Growth curves estimated by the best-fitting univariate models are displayed in Figure 1. Dependence (linear slope estimate=1.38; SE=0.08; z=17.45; p<.001), cognition (linear slope estimate=−5.24; SE= 0.30; z=−17.69; p<.001), agitation/aggression (linear slope estimate=0.21; SE=.05; z=4.13; p<.001), and psychotic symptoms (linear slope estimate=0.33; SE=.07; z=4.45; p<.001) worsened over the study period. Psychotic symptoms subsequently improved (quadratic slope estimate=−0.06; SE=0.01; z=−5.09; p<.001), as shown by the inverse U-shaped curve in Figure 1. In contrast, depressed mood did not change (linear slope estimate=0.03; SE=.03; z=1.04; p=.30).
Figure 1.

Observed and model-estimated scores in the five univariate models. Y axes display full ranges for each scale so that relative differences between symptom types can be appreciated. Errors bars represent standard deviations in sample means at each visit.
Note. DS=Dependence Scale; mMMS=modified Mini Mental State Exam; CUSPAD=Columbia Scale for Psychopathology in Alzheimer’s disease
Raw scores at each occasion are shown in Figure 1. It should be noted that scores at the later occasions represent a highly select sample, as lower-performing participants were more likely to be lost to follow-up. As described above, FIML accommodates this pattern of missing data. For example, the model-estimated trajectory of mMMS shown in Figure 1 is not artificially elevated near the end of the study period.
Conditional Multivariate Models
The best-fitting univariate models were combined into three multivariate models, each of which estimated growth curves for DS, mMMS, and a CUSPAD subscale (psychosis, agitation/aggression, or depressed mood). Each model also included four covariates (i.e., age, sex, education, recruitment site). All three models fit well: psychosis (CFI=0.88, TLI=0.88, RMSEA=0.06, SRMSR=0.09); depressed mood (CFI=0.94, TLI=0.94, RMSEA=0.04, SRMSR=0.06); agitation/aggression (CFI=0.92, TLI=0.92, RMSEA=0.05, SRMSR=0.05).
Table 2 presents unstandardized parameter estimates from each model. Initial levels are independent of the other two outcomes. For example, the average initial DS score for a 74-year-old male with 12 years of education enrolled at the Columbia site was 5.2 in all three models.
Table 2.
Unstandardized Parameter Estimates in the Conditional Multivariate Models for three BPSD: Psychosis, Depressed Mood, and Agitation/Aggression
| TnQTable2 | Parameter | S.E. | z | Parameter | S.E. | z | Parameter | S.E. | z |
|---|---|---|---|---|---|---|---|---|---|
| Model 1: Psychosis | |||||||||
| Dependence Scale | 5.215** | 0.227 | 22.999 | 1.193** | 0.163 | 7.314 | −0.036 | 0.026 | −1.397 |
| mMMS | 38.438** | 0.566 | 67.922 | −5.044** | 0.605 | −8.340 | 0.066 | 0.116 | 0.357 |
| CUSPAD Psychosis | 0.917** | 0.203 | 4.509 | 0.472* | 0.159 | 2.965 | −0.077* | 0.025 | −3.068 |
| Model 2: Depressed Mood | |||||||||
| Dependence Scale | 5.204** | 0.227 | 22.920 | 1.215** | 0.163 | 7.438 | −0.039 | 0.026 | −1.511 |
| mMMS | 38.444** | 0.566 | 67.885 | −5.083** | 0.607 | −8.369 | 0.076 | 0.116 | 0.656 |
| CUSPAD Depressed Mood | 0.939** | 0.089 | 10.554 | −0.020 | 0.069 | −0.292 | −0.008 | 0.012 | −0.657 |
| Model 3: Agitation/Aggression | |||||||||
| Dependence Scale | 5.214** | 0.226 | 23.073 | 1.209** | 0.163 | 7.407 | −0.038 | 0.026 | −1.486 |
| mMMS | 38.449** | 0.566 | 67.894 | −5.118** | 0.611 | −8.380 | 0.085 | 0.118 | 0.720 |
| CUSPAD Agitation/Aggression | 1.002** | 0.142 | 7.068 | −0.001 | 0.104 | −0.005 | 0.010 | 0.017 | 0.592 |
Note. BPSD=behavioral and psychological symptoms of dementia; mMMS=modified Mini Mental State Exam; CUSPAD=Columbia Scale for Psychopathology in Alzheimer’s Disease.
p <.01
p < .001
As shown, linear worsening over time was still evident for dependence, cognition, and psychosis after controlling for all variables. DS scores worsened 1.2 points per year, and mMMS scores worsened about 5.1 points per year. CUSPAD Psychosis scores worsened 0.5 points per year. This rate decelerated by 0.1 points per year, leading to eventual improvement. Importantly, changes in psychotic symptoms were independent of both cognitive decline and changes in dependence. Changes in agitation/aggression were no longer significant, contrasting with the 0.21 points of annual worsening estimated by the univariate model. Thus, accounting for cognitive decline and changes in dependence level rendered the worsening of agitation/aggression negligible. Changes in depressed mood remained non-significant in the multivariate model.
Aim 1: BPSD and Cognition
Significant correlations between initial levels and rates of change within the multivariate models are shown in Figure 2. For clarity, correlations involving quadratic slopes (i.e., acceleration or deceleration) are not shown.
Figure 2.
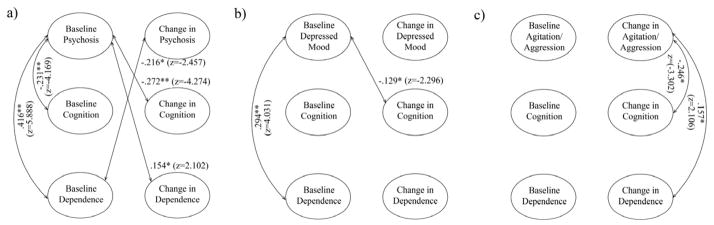
Schematic of significant associations between the latent variables in the three multivariate models. A) Psychosis; B) Depressed mood; C) Agitation/aggression. Effects are represented as correlation coefficients with the corresponding z-statistic used to determine significance. For simplicity, only associations involving the CUSPAD variable are shown. Indicators and quadratic slopes are not shown.
Note. CUSPAD= Columbia Scale for Psychopathology in Alzheimer’s disease
* p <.05
** p < .001
As shown in Figure 2, 5.3% of the variance in initial cognitive impairment was explained by patients’ initial psychosis, with more psychotic symptoms associated with worse cognition. Further, patients’ initial psychosis explained 7.3% of the variance in cognitive decline, with more initial psychotic symptoms associated with accelerated decline. Figure 3a displays cognitive trajectories separately for participants with and without baseline psychotic symptoms. As shown, patients with psychotic symptoms scored worse on the mMMS at baseline and declined faster over time. Rates of change in psychosis and cognition were not correlated.
Figure 3.

Estimated cognitive trajectories from the unconditional univariate models shown separately for participants with and without a) psychotic symptoms or b) depressed mood at baseline.
Note. DS=Dependence Scale; mMMS=modified Mini Mental State Exam; CUSPAD=Columbia Scale for Psychopathology in Alzheimer’s disease
Initial depressed mood and cognition were not correlated. Only 1.6% of the variance in cognitive decline was explained by patients’ initial depressed mood, with greater depressed mood associated with accelerated cognitive decline. Figure 3b displays cognitive trajectories separately for participants with and without baseline depressed mood. As shown, patients with depressed mood scored similarly on the mMMS initially but declined faster over time. Rates of change in depressed mood and cognition were not correlated.
Initial agitation/aggression and cognition were not correlated. Initial agitation/aggression was not related to cognitive decline. 6% of the variance in cognitive decline was explained by rate of change in agitation/aggression.
Aim 2: BPSD and Dependence
17.3% of the variance in initial dependence was explained by initial psychotic symptoms, with more symptoms associated with greater dependence. Initial psychosis also explained 2.4% of the variance in the trajectory of dependence levels, with more baseline psychotic symptoms associated with accelerated increase in dependence. Figure 4 displays dependence trajectories separately for participants with and without baseline psychotic symptoms. As shown, patients with psychotic symptoms had worse initial DS scores steeper increases over time. Rates of change in psychosis and dependence were not correlated.
Figure 4.
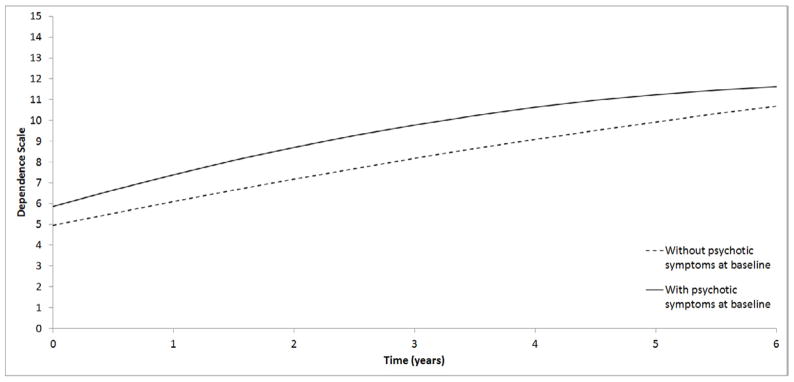
Estimated trajectories of dependence from the unconditional univariate model shown separately for participants with and without psychotic symptoms at baseline.
Note. DS=Dependence Scale; mMMS=modified Mini Mental State Exam; CUSPAD=Columbia Scale for Psychopathology in Alzheimer’s disease
Initial depressed mood explained 8.6% of the variance in initial dependence. There was no longitudinal relationship between depressed mood and dependence.
Initial levels of agitation/aggression and dependence were not correlated. Initial agitation/aggression was not related to subsequent changes in dependence. 2.5% of the variance in the rate of change in dependence was explained by changes in agitation/aggression.
CONCLUSIONS
There were three main findings regarding cognitive decline over six years in this study of 517 patients with mild AD: 1) greater initial psychosis was associated with worse baseline cognition; 2) greater initial psychosis and depressed mood each predicted accelerated cognitive decline; and 3) rates of change in agitation/aggression and cognition were correlated. There were three main findings regarding dependence, independent of cognitive decline: 1) higher initial psychosis and depressed mood were associated with greater baseline dependence; 2) higher initial psychosis predicted accelerated increases in dependence over time; and 3) rates of change in agitation/aggression and dependence were correlated. While this study was purely observational, this pattern of findings provides new insights into the prognostic value of psychosis and depressed mood in early AD and suggests that agitation/aggression tracks closely with declining cognition and dependence over time.
With regard to psychosis, initial levels were associated not only with worse initial cognition and dependence, but also with more rapid disease progression, as defined by accelerated worsening of cognition and dependence. The magnitude of these associations ranged from small to medium. For example, baseline psychotic symptoms explained over 7% of the variance in cognitive decline. Above and beyond this relationship, baseline psychotic symptoms explained nearly one-fifth of the variance in initial dependence. Findings regarding depressed mood were smaller and more limited in that initial levels were only associated with worse initial dependence and accelerated cognitive decline.
These findings extend results from smaller samples with more limited follow-up. For example, survival analyses in a subset of the present cohort followed over three years showed that baseline psychosis predicted faster progression to a functional endpoint, but not nursing home placement (8). In independent studies, psychosis and affective symptoms predicted greater functional declines over two years (29–31). Similarly, psychosis and depression predicted nursing home placement in independent studies that did not control for longitudinal changes in cognition (32–33). The current study provides three novel observations regarding psychosis and depression in early AD. First, their prognostic value extends beyond functional outcomes or nursing home placement to patient care needs and their impact on the family (i.e., dependence). Second, the prognostic value of psychosis is independent of longitudinal changes in cognition. Third, psychosis has greater prognostic value than depression.
Potential explanations for the prognostic value of psychosis and depressed mood include “early symptom” and “risk factor” hypotheses. In the early symptom hypothesis, BPSD reflect more AD-related neurodegenerative changes in the brain. For example, AD patients with psychosis show more neocortical neurofibrillary tangles, but not plaques, compared to patients without psychosis (34). Similarly, AD patients with a lifetime history of major depression have more hippocampal plaques and tangles than patients without a depression history. Depression has also been associated with AD pathology in older adults without AD (35). Recent evidence from a community-based longitudinal study supports the hypothesis that late-life depression accompanies cognitive decline and does not precede it (36).
In the risk factor hypothesis, BPSD lower brain reserve capacity via non-AD pathology, which reduces the brain’s ability to cope with AD pathology. For example, AD psychosis is associated with polymorphisms in multiple genes linked to schizophrenia, including neuregulin-q and interferon 1-beta (37–38). Resulting brain abnormalities may increase susceptibility to AD-type neurodegeneration. In the case of depression, dysregulation of the hypothalamic-pituitary-adrenal axis, lowered levels of brain-derived neurotrophic factor, and/or elevated homocysteine levels may reduce resilience to AD pathology (39). Although depression was related to faster cognitive decline in this and other studies, a recent study reported no effect of sertraline on cognition in AD after 24 weeks (40). Future studies should examine whether effective treatment of depression or psychosis in AD influences cognitive decline over longer periods. Whether such treatments differentially affect cognitive domains should also be explored, as cross-sectional studies suggest that mood and psychotic symptoms are associated with different profiles of cognitive impairment in AD (41).
Unlike psychosis and depression, of which baseline levels were markers of faster AD progression, changes in agitation/aggression were longitudinally associated with AD progression. Patients who developed agitation/aggression also had faster cognitive decline and loss of independence, suggesting that agitation/aggression consistently relates to declines in cognition and independence throughout AD. Importantly, the longitudinal association between agitation/aggression and dependence was independent of cognitive decline. It is possible that increased agitation/aggression interferes with engagement in cognitive tasks and increases the need for supervision. Alternatively, patients may react to both confusion and increased care delivery with agitation/aggression.
In the multivariate model combining agitation/aggression, cognition and dependence, changes in cognition and dependence fully accounted for the worsening of agitation/aggression. In contrast, changes in cognition and dependence remained significant. This pattern of findings suggests that improving cognition or dependence level has greater potential to alleviate agitation/aggression than improving agitation/aggression has to recover cognition or independence. Because changes in psychotic symptoms were not eliminated in the multivariate model, interventions to improve cognition or dependence may not alleviate psychotic symptoms. Future studies are needed to directly test these hypotheses.
Due to modeling constraints, this study did not include all variables associated with poor outcome in AD. The included covariates were chosen because they are prominent moderators of AD progression in the extant literature and/or were associated with outcomes in this sample. Previous reports from our group have explored relationships between AD progression and other variables, including APOE genotype and motor signs (8,42–45).
Strengths of this study include latent growth curve modeling, which estimated longitudinal relationships between variables. Another major strength is the multivariate nature of the models, which estimated associations involving dependence independent of cognitive decline. Models also used FIML to manage missing data, which accommodates drop-out related to previous scores on outcomes. Finally, this study examined individual BPSD separately to demonstrate their unique predictive values.
While this study was purely observational, the present finding that initial levels of psychosis and depression predicted worse AD progression adds to the literature on the prognostic value of individual BPSD. In addition, results indicate that agitation/aggression tracks declines in both cognition and independence independently throughout AD. Targeted intervention for individual BPSD, particularly psychosis, could have broad impacts on patient well-being, care costs, and family burden.
Acknowledgments
Sources of Funding: This work was supported by the National Institute on Aging (AG007370, AG000261) and the National Center for Advancing Translational Sciences (UL1 TR000040), formerly the National Center for Research Resources (UL1 RR024156).
Footnotes
Conflicts of Interest
No disclosures to report.
Publisher's Disclaimer: This is a PDF file of an unedited manuscript that has been accepted for publication. As a service to our customers we are providing this early version of the manuscript. The manuscript will undergo copyediting, typesetting, and review of the resulting proof before it is published in its final citable form. Please note that during the production process errors may be discovered which could affect the content, and all legal disclaimers that apply to the journal pertain.
References
- 1.Lyketsos CG, Lopez O, Jones B, et al. Prevalence of neuropsychiatric symptoms in dementia and mild cognitive impairment: results from the cardiovascular health study. JAMA. 2002;288:1475–1483. doi: 10.1001/jama.288.12.1475. [DOI] [PubMed] [Google Scholar]
- 2.Gaugler JE, Yu F, Krichbaum K, et al. Predictors of nursing home admission for persons with dementia. Medical Care. 2009;47:191–198. doi: 10.1097/MLR.0b013e31818457ce. [DOI] [PubMed] [Google Scholar]
- 3.Ornstein K, Gaugler JE. The problem with “problem behaviors”: a systematic review of the association between individual patient behavioral and psychological symptoms and caregiver depression and burden within the dementia patient-caregiver dyad. Int Psychobgeriatr. 2012;24:1536–1552. doi: 10.1017/S1041610212000737. [DOI] [PMC free article] [PubMed] [Google Scholar]
- 4.Devanand DP, Jacobs DM, Tang M-X, et al. The course of psychopathologic features in mild to moderate Alzheimer disease. Arch Gen Psychiatry. 1997;54:257–263. doi: 10.1001/archpsyc.1997.01830150083012. [DOI] [PubMed] [Google Scholar]
- 5.Kunik ME, Snow AL, Davila JA, et al. Consequences of aggressive behavior in patients with dementia. J Neurospychiatry Clin Neurosci. 2010;22:40–47. doi: 10.1176/jnp.2010.22.1.40. [DOI] [PubMed] [Google Scholar]
- 6.Okura T, Plassman BL, Steffens DC, et al. Neuropsychiatric symptoms and the risk of institutionalization and death: the Aging, Demographics, and Memory Study. JAGS. 2011;59:473–481. doi: 10.1111/j.1532-5415.2011.03314.x. [DOI] [PMC free article] [PubMed] [Google Scholar]
- 7.Knopman DS, Berg JD, Thomas R, et al. Nursing home placement is related to dementia progression: experience from a clinical trial. Alzheimer’s Disease Cooperative Study. Neurology. 1999;52:714–718. doi: 10.1212/wnl.52.4.714. [DOI] [PubMed] [Google Scholar]
- 8.Stern Y, Albert M, Brandt J, et al. Utility of extrapyramidal signs and psychosis as predictors of cognitive and functional decline, nursing home admission, and death in Alzheimer’s disease: prospective analyses from the Predictors Study. Neurology. 1994;44:2300–2307. doi: 10.1212/wnl.44.12.2300. [DOI] [PubMed] [Google Scholar]
- 9.Scarmeas N, Brandt J, Albert M, et al. Delusions and hallucinations are associated with worse outcome in Alzheimer disease. Arch Neurol. 2005;62:1604–1608. doi: 10.1001/archneur.62.10.1601. [DOI] [PMC free article] [PubMed] [Google Scholar]
- 10.Winblad B, Wimo A, Almkvist O. Outcome measures in Alzheimer’s disease: do they go far enough? Dement Geriatr Cogn Disord. 2000;11:3–10. doi: 10.1159/000051226. [DOI] [PubMed] [Google Scholar]
- 11.Stern Y, Albert SM, Sano M, et al. Assessing patient dependence in Alzheimer’s disease. J Gerontol. 1994;49:M216–M222. doi: 10.1093/geronj/49.5.m216. [DOI] [PubMed] [Google Scholar]
- 12.Akamigbo AB, Wolinsky FD. New evidence of racial differences in access and their effects on the use of nursing homes among older adults. Med Care. 2007;45:672–679. doi: 10.1097/MLR.0b013e3180455677. [DOI] [PubMed] [Google Scholar]
- 13.Cohen JT, McLaughlin TP, Neumann P, et al. Estimating dependence scale scores based on clinical dementia rating - sum of boxes scores in patients with mild cognitive impairment or mild to moderate Alzheimer’s disease. Alzheimers Dement. 2009;5:238–239. [Google Scholar]
- 14.Gallagher D, Mhaolain AN, Crosby L, et al. Dependence and caregiver burden in Alzheimer’s disease and mild cognitive impairment. Am J Alzheimers Dis Other Demen. 2011;26:110–114. doi: 10.1177/1533317510394649. [DOI] [PMC free article] [PubMed] [Google Scholar]
- 15.Scherer RK, Scarmeas N, Brandt J, et al. The relation of patient dependence to home health aide use in Alzheimer’s disease. J Gerontol A Biol Sci Med Sci. 2008;63:1005–1009. doi: 10.1093/gerona/63.9.1005. [DOI] [PMC free article] [PubMed] [Google Scholar]
- 16.Zhu CW, Leibman C, McLaughlin T, et al. Patient dependence and longitudinal changes in costs of care in Alzheimer’s disease. Dement Geriatr Cogn Disord. 2008;26:416–423. doi: 10.1159/000164797. [DOI] [PMC free article] [PubMed] [Google Scholar]
- 17.Zhu CW, Leibman C, McLaughlin T, et al. The effects of patient function and dependence on costs of care in Alzheimer’s disease. J Am Geriatr Soc. 2008;56:1497–1503. doi: 10.1111/j.1532-5415.2008.01798.x. [DOI] [PMC free article] [PubMed] [Google Scholar]
- 18.Stern Y, Folstein M, Albert M, et al. Multi-Center Study of Predictors of Disease Course in Alzheimer’s Disease (the “Predictors Study”): I. Study Design, Cohort Description and Intersite Comparisons. Alzheimer Dis Assoc Disord. 1993;7:3–21. doi: 10.1097/00002093-199307010-00002. [DOI] [PubMed] [Google Scholar]
- 19.Richards M, Folstein M, Albert M, et al. Multi-center study of predictors of disease course in Alzheimer’s disease (the ‘Predictors Study’). II. Baseline findings. Alzheimer Dis Assoc Disord. 1993;7:22–32. doi: 10.1097/00002093-199307010-00003. [DOI] [PubMed] [Google Scholar]
- 20.McKhann G, Drachman D, Folstein M, et al. Clinical diagnosis of Alzheimer’s disease. Report of the NINCDS-ADRDA Work Group under the auspices of the Department of Health and Human Services Task Force on Alzheimer’s disease. Neurology. 1984;34:939–944. doi: 10.1212/wnl.34.7.939. [DOI] [PubMed] [Google Scholar]
- 21.Stern Y, Sano M, Paulson J, et al. Modified mini-mental state examination: validity and reliability. Neurology. 1987;37:179. [Google Scholar]
- 22.Folstein MF, Folstein SE, McHugh PR. ‘Mini-mental state’. A practical method for grading the cognitive state of patients for the clinician. J Psychiatr Res. 1975;12:189–198. doi: 10.1016/0022-3956(75)90026-6. [DOI] [PubMed] [Google Scholar]
- 23.Brickman AM, Riba A, Bell K, et al. Longitudinal assessment of patient dependence in Alzheimer disease. Arch Neurol. 2001;59:1304–1308. doi: 10.1001/archneur.59.8.1304. [DOI] [PubMed] [Google Scholar]
- 24.Devanand DP, Miller L, Richards M, et al. The Columbia University Scale for Psychopathology in Alzheimer’s disease. Arch Neurol. 1992;49:371–376. doi: 10.1001/archneur.1992.00530280051022. [DOI] [PubMed] [Google Scholar]
- 25.Bollen KA, Curran PJ. Latent Curve Models: A Structural Equation Perspective. Hoboken, NJ: Wiley; 2006. [Google Scholar]
- 26.Muthén LK, Muthén BO. Mplus User’s Guide. Los Angeles, CA: Muthen & Muthen; 1998. [Google Scholar]
- 27.Enders CK, Bandalos DL. The relative performance of full information maximum likelihood estimation for missing data in structural equation models. Structural Equation Modeling. 2001;8:430–457. [PubMed] [Google Scholar]
- 28.Zahodne LB, Marsiske M, Okun MS, et al. Mood and motor trajectories in Parkinson’s disease: multivariate latent growth curve modeling. Neuropsychology. 2012;26:71–80. doi: 10.1037/a0025119. [DOI] [PMC free article] [PubMed] [Google Scholar]
- 29.Vilalta-Franch J, López-Pousa S, Clavó-Perxas L, et al. Psychosis of Alzheimer disease: prevalence, incidence, persistence, risk factors, and mortality. Am J Geriatr Psychiatry. 2012 doi: 10.1016/j.jagp.2013.01.051. Epub ahead of print. [DOI] [PubMed] [Google Scholar]
- 30.Palmer K, Lupo F, Perri R, et al. Predicting disease progression in Alzheimer’s disease: the role of neuropsychiatric symptoms on function and cognitive decline. J Alzheimers Dis. 2011;42:35–45. doi: 10.3233/JAD-2010-101836. [DOI] [PubMed] [Google Scholar]
- 31.Buccione I, Perri R, Carlesimo GA, et al. Cognitive and behavioural predictors of progression rates in Alzheimer’s disease. Eur J Neurol. 2007;14:440–446. doi: 10.1111/j.1468-1331.2007.01693.x. [DOI] [PubMed] [Google Scholar]
- 32.Dorenlot P, Harboun M, Bige V, et al. Major depression as a risk factor for early institutionalization of dementia patients living in the community. Int J Geriatr Psychiatry. 2005;20:471–478. doi: 10.1002/gps.1238. [DOI] [PubMed] [Google Scholar]
- 33.Lopez OL, Wisniewski SR, Becker JT, et al. Psychiatric medication and abnormal behavior as predictors of progression in probably Alzheimer’s disease. Arch Neurol. 1999;56:1266–1272. doi: 10.1001/archneur.56.10.1266. [DOI] [PubMed] [Google Scholar]
- 34.Farber NB, Rubin EH, Newcomer JW, et al. Increased neocortical neurofibrillary tangle density in subjects with Alzheimer disease and psychosis. Arch Gen Psychiatry. 2000;57:1165–1173. doi: 10.1001/archpsyc.57.12.1165. [DOI] [PubMed] [Google Scholar]
- 35.Sweet RA, Hamilton RL, Butters MA, et al. Neuropathologic correlates of late onset major depression. Neuropsychopharmacology. 2004;29:2242–2250. doi: 10.1038/sj.npp.1300554. [DOI] [PubMed] [Google Scholar]
- 36.Richard E, Reitz C, Honig LH, et al. Late-life depression, mild cognitive impairment, and dementia. Arch Neurol. 2012 doi: 10.1001/jamaneurol.2013.603. [Epub ahead of print] [DOI] [PMC free article] [PubMed] [Google Scholar]
- 37.Craig D, Hart DJ, McCool K, et al. The interleukin 1 beta gene promoter polymorphism (-511) acts as a risk factor for psychosis in Alzheimer’s dementia. Ann Neurol. 2004;56:121–124. doi: 10.1002/ana.20120. [DOI] [PubMed] [Google Scholar]
- 38.Go TC, Perry RT, Wiener H, et al. Neuregulin-1 polymotphism in late onset Alzheimer’s disease families with psychoses. Am J Med Genet B Neuropsychiatr Genet. 2005;139:28–32. doi: 10.1002/ajmg.b.30219. [DOI] [PubMed] [Google Scholar]
- 39.Meeks TW, Ropacki SA, Jeste DV. The neurobiology of neuropsychiatric symptoms in dementia. Curr Opin Psychiatry. 2006;19:581–586. doi: 10.1097/01.yco.0000245746.45384.0e. [DOI] [PubMed] [Google Scholar]
- 40.Munro CA, Longmire CF, Drye LT, et al. Cognitive outcomes after sertraline treatment in patients with depression of Alzheimer Disease. Am J Geriatr Psychiatry. 2012;20:1036–1044. doi: 10.1097/JGP.0b013e31826ce4c5. [DOI] [PMC free article] [PubMed] [Google Scholar]
- 41.Koppel J, Goldberg TE, Gordon M, et al. Relationships between behavioral syndromes and cognitive domains in Alzheimer disease: the impact of mood and psychosis. Am J Geriatr Psychiatry. 2012;20:994–1000. doi: 10.1097/JGP.0b013e3182358921. [DOI] [PubMed] [Google Scholar]
- 42.Stern Y, Tang MX, Albert MS, et al. Predicting time to nursing home and death in individuals with Alzheimer disease. JAMA. 1997;277:806–812. [PubMed] [Google Scholar]
- 43.Stern Y, Jacobs DM. Preliminary findings from the predictors study: utility of clinical signs for predicting disease course. Alzheimer Dis Assoc Disord. 1995;9:S14–S18. [PubMed] [Google Scholar]
- 44.Cosentino S, Scarmeas N, Helzner E, et al. APOE epsilon 4 allele predicts fast cognitive decline in mild Alzheimer disease. Neurology. 2008;70:1842–1849. doi: 10.1212/01.wnl.0000304038.37421.cc. [DOI] [PMC free article] [PubMed] [Google Scholar]
- 45.Scarmeas N, Hadjigeorgiou GM, Papadimitriou A, et al. Motor signs during the course of Alzheimer disease. Neurology. 2004;63:975–982. doi: 10.1212/01.wnl.0000138440.39918.0c. [DOI] [PMC free article] [PubMed] [Google Scholar]